
†These authors contributed equally.
Academic Editor: Gustavo Caetano-Anollés
Cardiac magnetic resonance has become a reliable imaging modality providing structural and functional data, and fundamental information about tissue composition. Cardiac magnetic resonance imaging with late gadolinium enhancement, T1-mapping, T2-mapping, T2*-imaging, and extracellular volume, has proved to be a valuable tool in investigating the etiology of heart failure. Such analysis is helpful for the diagnostic evaluation of both ischemic and non-ischemic cardiomyopathies. As primary heart muscle diseases, the ability to characterize the myocardial substrate is essential. Determining the heart failure etiology is fundamental and has implications regarding the prognosis prediction and best treatment. Investigation in cardiac magnetic resonance in heart failure patients has grown in the past decade, and the true value of this imaging modality to detect early disease likely remains underestimated. This review describes the importance of cardiac magnetic resonance for the diagnosis and prognosis of non-ischemic cardiomyopathies, particularly hypertrophic, infiltrative, and arrhythmogenic cardiomyopathies.
Lately, cardiac magnetic resonance (CMR) has emerged as a reliable imaging modality providing functional and structural data, and fundamental information regarding tissue composition [1]. CMR of the myocardium is based on different tissues’ intrinsic magnetic properties (T1, T2, and T2*). Late gadolinium enhancement (LGE) technique and calculation of extracellular volume (ECV) are examples where the administration of a contrast agent enhances the referred intrinsic magnetic properties [1, 2]. Such analysis is useful in assessing patients with heart failure (HF) for the diagnostic evaluation of ischemic and non-ischemic cardiomyopathies.
Establishing the etiology of HF is clinically important, as it has implications for the optimal treatment strategy and prognosis prediction [3]. Echocardiography is fundamental for diagnosing non-ischemic cardiomyopathies, but CMR provides more accurate morphological and prognostic information. In fact, the most recent 2021 European Society of Cardiology (ESC) HF guideline recommends CMR for tissue characterization in the initial assessment of patients with HF and suspected cardiomyopathy [4].
This review describes the importance of CMR for the diagnosis and prognosis of non-ischemic cardiomyopathies, particularly of hypertrophic, infiltrative, and arrhythmogenic cardiomyopathies.
Hypertrophic cardiomyopathy (HCM) is the most prevalent genetically determined
heart disorder, affecting 1 in 200 to 500 persons [5, 6]. The disease is
characterized by an increase of left ventricular (LV) wall thickness (maximal
end-diastolic wall thickness of
The clinical presentation is variable. While several patients with HCM are asymptomatic, others may present with palpitations, syncope, exertional dyspnea, or chest pain [9]. Rare cases with HCM present with sudden cardiac death (SCD) as their first clinical symptom, most commonly because of ventricular arrhythmias [10].
Transthoracic echocardiography remains the imaging technique of choice for the initial and successive evaluation of HCM in most patients [8]. Recently, CMR arised as a robust complementary tool, capable of providing information on cardiac phenotypic expression, its hemodynamic and functional characterization, microvascular dysfunction, and myocardial fibrosis [7, 11]. Compared with CMR imaging, echocardiography may overestimate the maximal LV wall thickness measurements, particularly when muscle structures of the right ventricle (RV), such as crista supraventricularis, are included [12]. Contrastingly, LV wall thickness measurements can be underestimated by echocardiography, especially when hypertrophy is limited to the anterolateral free wall, posterior septum, or apex [13]. CMR is more sensitive to detect left ventricular hypertrophy (LVH) due to its enhanced spatial resolution, allowing a better contrast between the dark myocardium and the bright blood. Additionally, it lacks the limitations of either poor acoustic windows or imaging planes [11, 14]. These reasons, ultimately support the role of multiparametric CMR in providing exceedingly accurate measurements of end-diastolic LV wall thickness, LV mass and systolic function, quantification of LV and RV chamber size, and identifying LVH areas which are less reliably detected by echocardiography [5, 8, 14, 15].
The distribution of LVH in most patients is asymmetric and often separated by
areas of normal wall thickness, providing a non-contiguous pattern [14]. The
anterior free wall and contiguous basal anterior ventricular septum are the most
common location of LVH (Fig. 1) [13]. In a small subset of patients, the LVH is
only confined to one or two LV segments, which can explain why nearly 20% of HCM
patients have normal LV mass index values in CMR [13, 16]. Patients with a LV wall
thickness
 Fig. 1.
Asymmetric septal nonobstructive hypertrophic cardiomyopathy (HCM). Steady-state free precession (SSFP) magnetic resonance images of a patient with a maximal left ventricular wall thickness of 31 mm in the mid inferoseptal are shown (A) in horizontal long-axis, (B) in midventricular short-axis, and (C) along the left ventricular outflow tract (LVOT).
The second most common phenotype is concentric HCM, characterized by global
thickening of the LV with no regional preferences and reduced LV cavity
dimensions [19]. Differentiating concentric HCM from acquired causes of
concentric LVH, like aortic stenosis, hypertension, or athlete’s heart, is
frequently challenging. Aortic stenosis can be ruled out by echocardiography in
most cases. In complex cases, to obtain a more precise measurement of the aortic
valve area and the transvalvular pressure gradient, cine imaging and
velocity-encoded imaging can be combined [20]. In hypertensive heart disease with
LV wall hypertrophy
Other infiltrative diseases such as cardiac amyloidosis (CA), Anderson-Fabry disease (AFD), or iron overload cardiomyopathy (IOC) can also manifest as diffuse myocardial hypertrophy as discussed later in this review.
Further phenotypic variations occur, such as midventricular HCM (involvement of midseptum and free wall) and apical HCM (wall thickening confined to the apex and the distinctive “ace of spades” configuration at end-diastole in CMR) [15]. Occasionally, these patients develop a dyskinetic or akinetic apical aneurysm. These features are linked to a higher risk of arrhythmic sudden death and thromboembolic events [23, 24]. Intracardiac thrombus, if present, appears as a low-signal intensity mass distinguishable from surrounding high-intensity structures in contrast-enhanced CMR (Fig. 2) [25]. Since echocardiography can be suboptimal in evaluating the apex, CMR plays an important role depicting apical hypertrophy, apical akinesis, and small-to-moderately sized apical aneurysms [26].
 Fig. 2.
Midventricular hypertrophic cardiomyopathy (HCM). Steady-state free precession (SSFP) magnetic resonance images are shown (A) in horizontal long-axis and (B) along the left ventricular outflow tract (LVOT), depicting apical aneurysm (asterisk) and millimetric intracardiac thrombus within the aneurysm (white arrows).
Even though HCM is classically a disease of the LV, several patients with HCM have RV hypertrophy and/or dysfunction; therefore, RV assessment should be included in the imaging workup of these patients [27].
Some morphological abnormalities in genetic carriers without LVH, like myocardial crypts (blood-filled fissures in the myocardium of LV), have been described as a subtle marker of HCM [28, 29]. However, recent reports have supported the hypothesis that crypts are benign anatomical variants, frequent in healthy subjects, and not connected to major adverse cardiovascular events [30].
A minority of HCM patients develop the so-called end-stage phase of the disease,
with regression of hypertrophied and hypercontractile non-dilated LV to severe
systolic dysfunction (ejection fraction
Apart from the presence of LVH, other structural manifestations of HCM include left atrial remodeling, myocardial bridging of coronary arteries, microvascular dysfunction, myocardial fibrosis, areas of LV noncompaction, LVOT obstruction, and abnormalities of papillary muscles and mitral apparatus [7].
Around 70% of patients with HCM present with LVOT obstruction (gradient
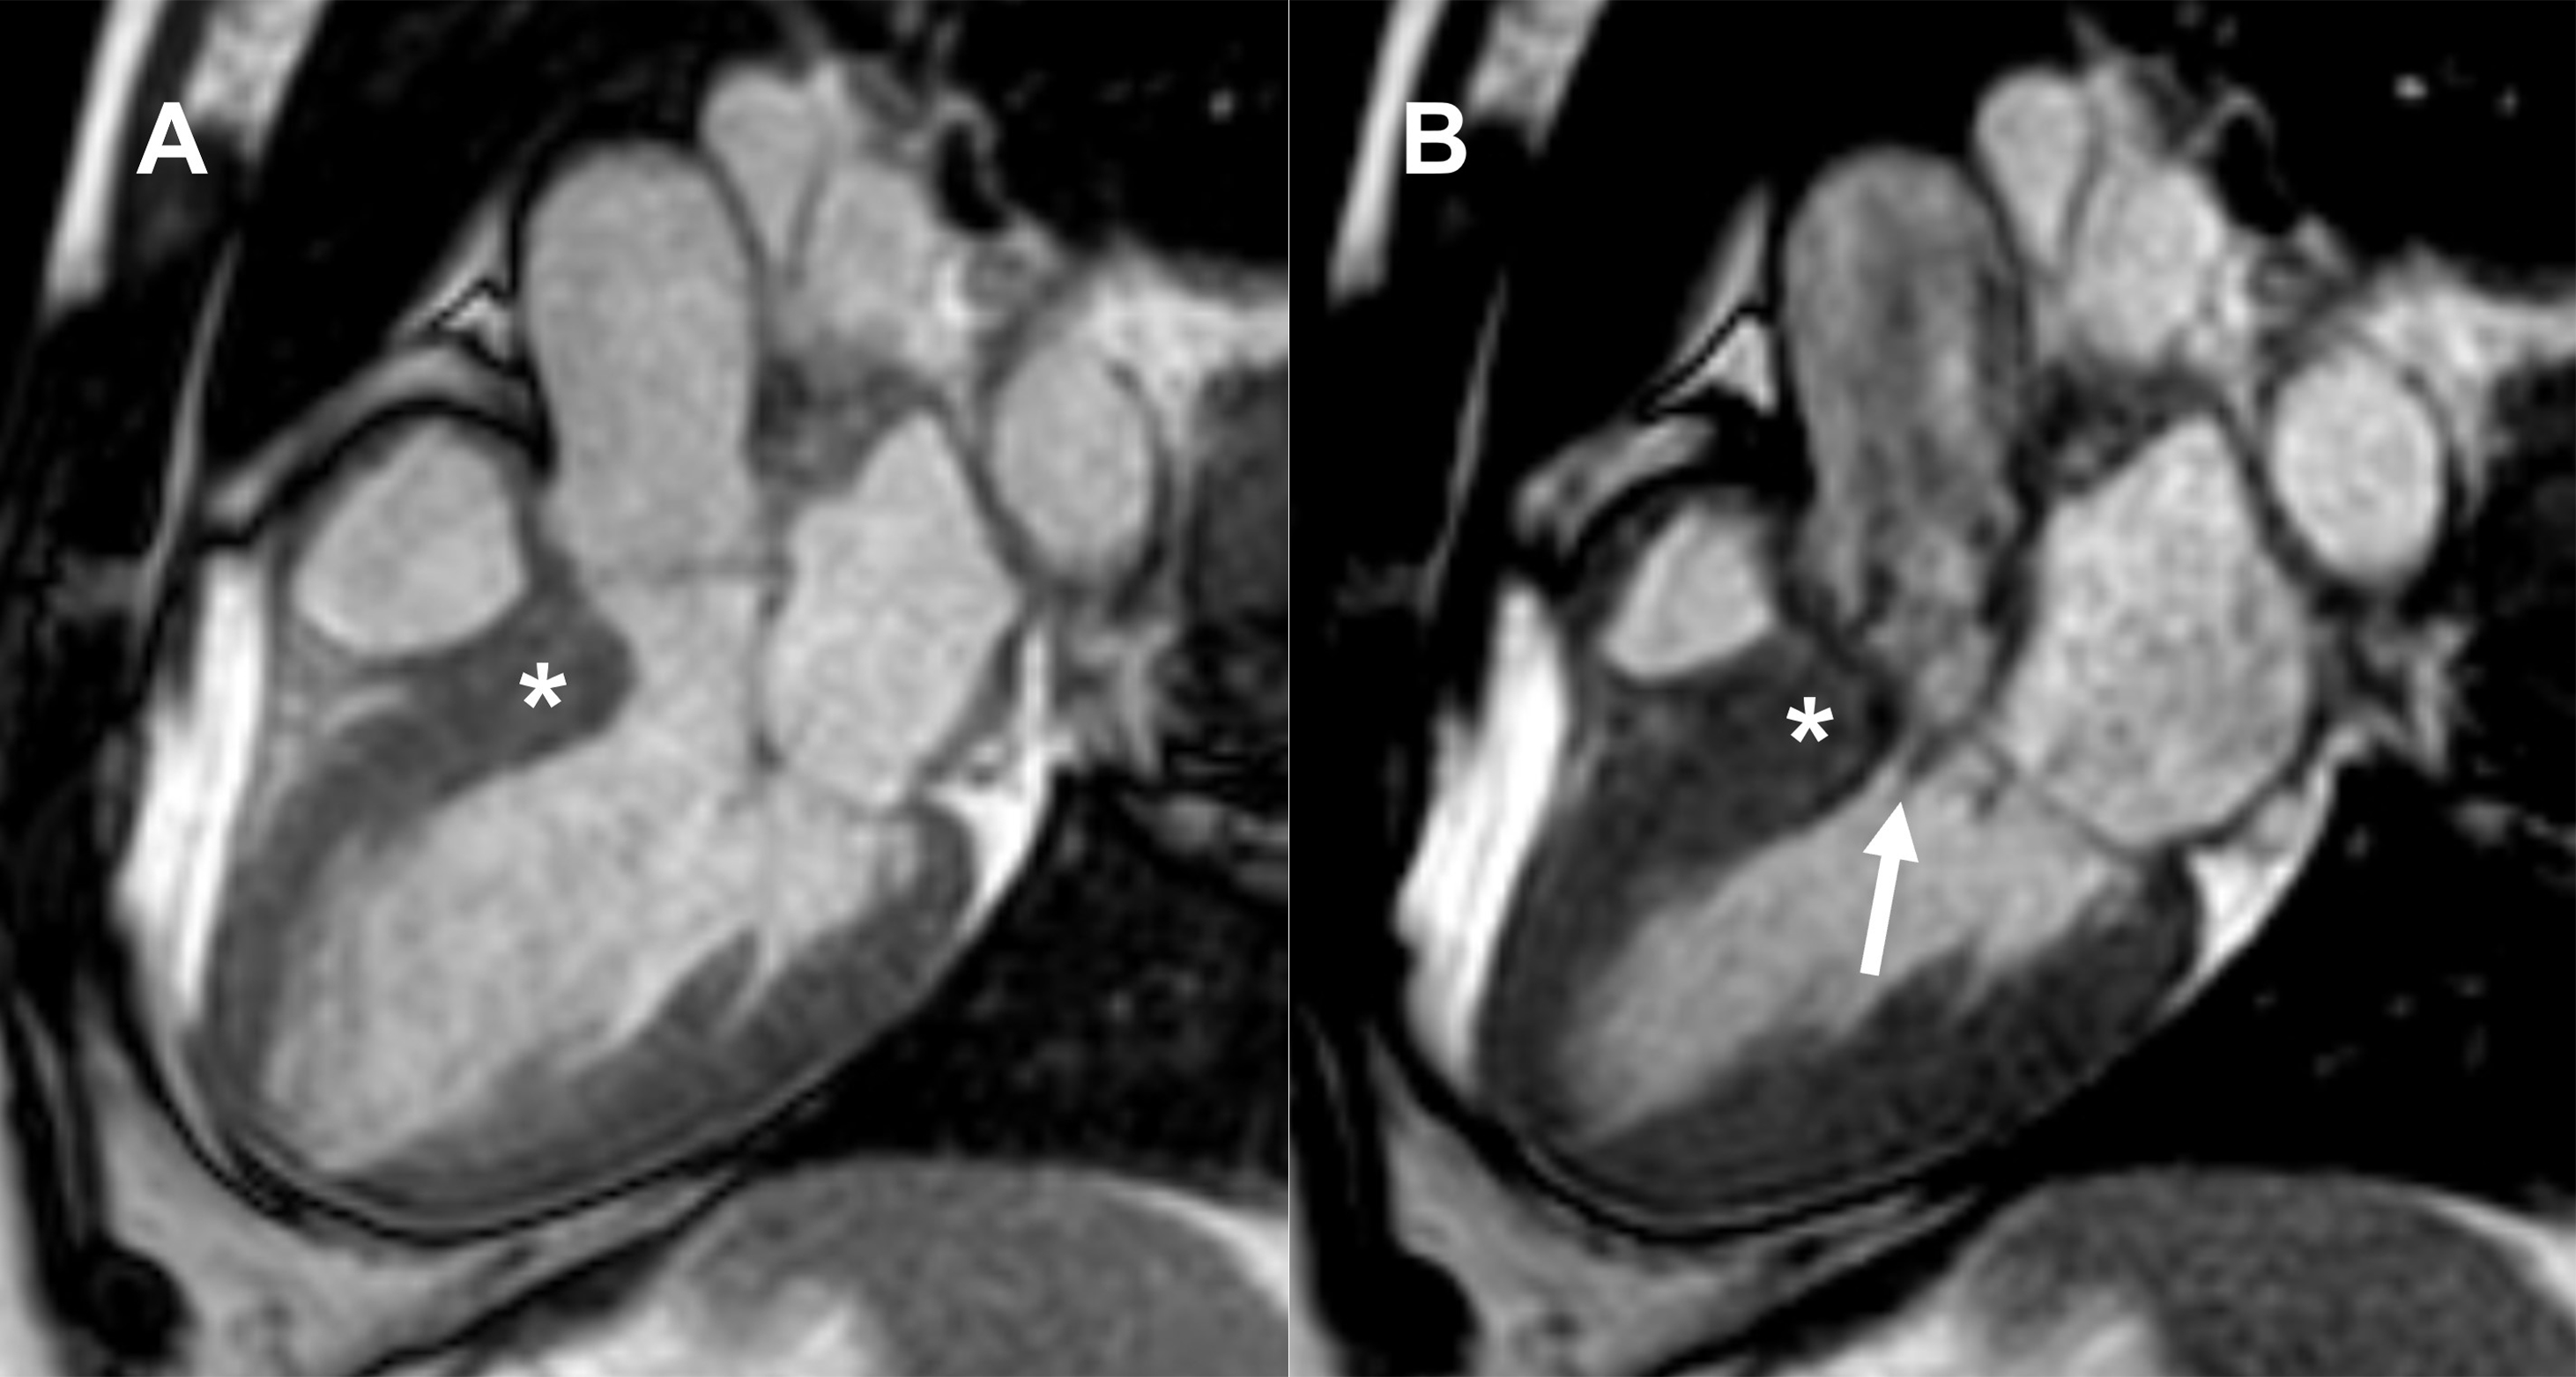 Fig. 3.
Asymmetric septal obstructive hypertrophic cardiomyopathy (HCM). Longitudinal cine steady-state free precession (SSFP) magnetic resonance images through left ventricular outflow tract (LVOT) at (A) end-diastole and (B) early systole depicting systolic anterior motion (SAM) of anterior mitral valve leaflet (white arrow) and thickened ventricular septum (asterisk).
Regarding structural abnormalities of the mitral valve, the most frequent is the marked elongation of both mitral leaflets [33]. Subvalvular abnormalities include hypertrophy and variation of the papillary muscle (PM) morphology (double bifid PM and anteroapical displacement of the anterolateral PM), which may also contribute to the severity of LVOT obstruction by anteriorly displacing the mitral valve plane toward the interventricular septum [37, 38].
Late gadolinium enhancement depends on varying uptake and washout patterns between normal and abnormal myocardium [39]. Following intravenous administration, gadolinium-based contrast agents accumulate in areas with expanded extracellular space due to either necrotic myocardium or scar tissue, resulting in increased signal intensity on T1-weighted gradient echo sequences [40]. This is depicted by applying an inversion recovery preparation pulse to achieve myocardial signal nulling while the scar tissue and blood remain bright [41].
The prevalence of LGE in patients with HCM is 60% [42]. It is well established
that LGE is a noninvasive marker of increased risk for ventricular arrhythmias
and HF progression with systolic dysfunction [42, 43, 44, 45]. The most common pattern or
distribution of LGE in HCM is a punctuate and/or patchy mid-wall hyperenhancement
at a noncoronary vascular distribution in the hypertrophic segments (Fig. 4),
although HCM may present practically with any pattern [19]. The extent of LGE
appears to have more discriminatory value than its presence, in particular when
LGE is
 Fig. 4.
Late gadolinium enhancement (LGE) in hypertrophic cardiomyopathy (HCM). (A) Short axis view with hyperenhancement (white arrows) at the right ventricular insertion to the ventricular septum. (B) Horizontal long-axis view and (C) vertical long-axis view show a patchy mid-wall hyperenhancement (white arrows) in the hypertrophic segments.
Some limitations to this technique have been reported, especially when diffuse myocardial fibrosis is present and the myocardial signal intensity is nearly isointense and in patients with subtle diffuse enhancement [48, 49]. T1 mapping is a novel and robust CMR technique, which offers quantitative measures of the myocardial signal. It creates a pixel-wise parametric map, in which each pixel reflects the absolute value of T1, coded in color (Fig. 5) [50]. Moreover, it directly measures ECV fraction from T1 values before (native T1) and after administration of gadolinium [14]. Increased native myocardial T1 values and an elevated ECV fraction were found in HCM, even in non-hypertrophic segments with preserved contraction function or in patients without LGE, suggesting that myocardial tissue remodeling may precede morphological and functional changes [49, 51].
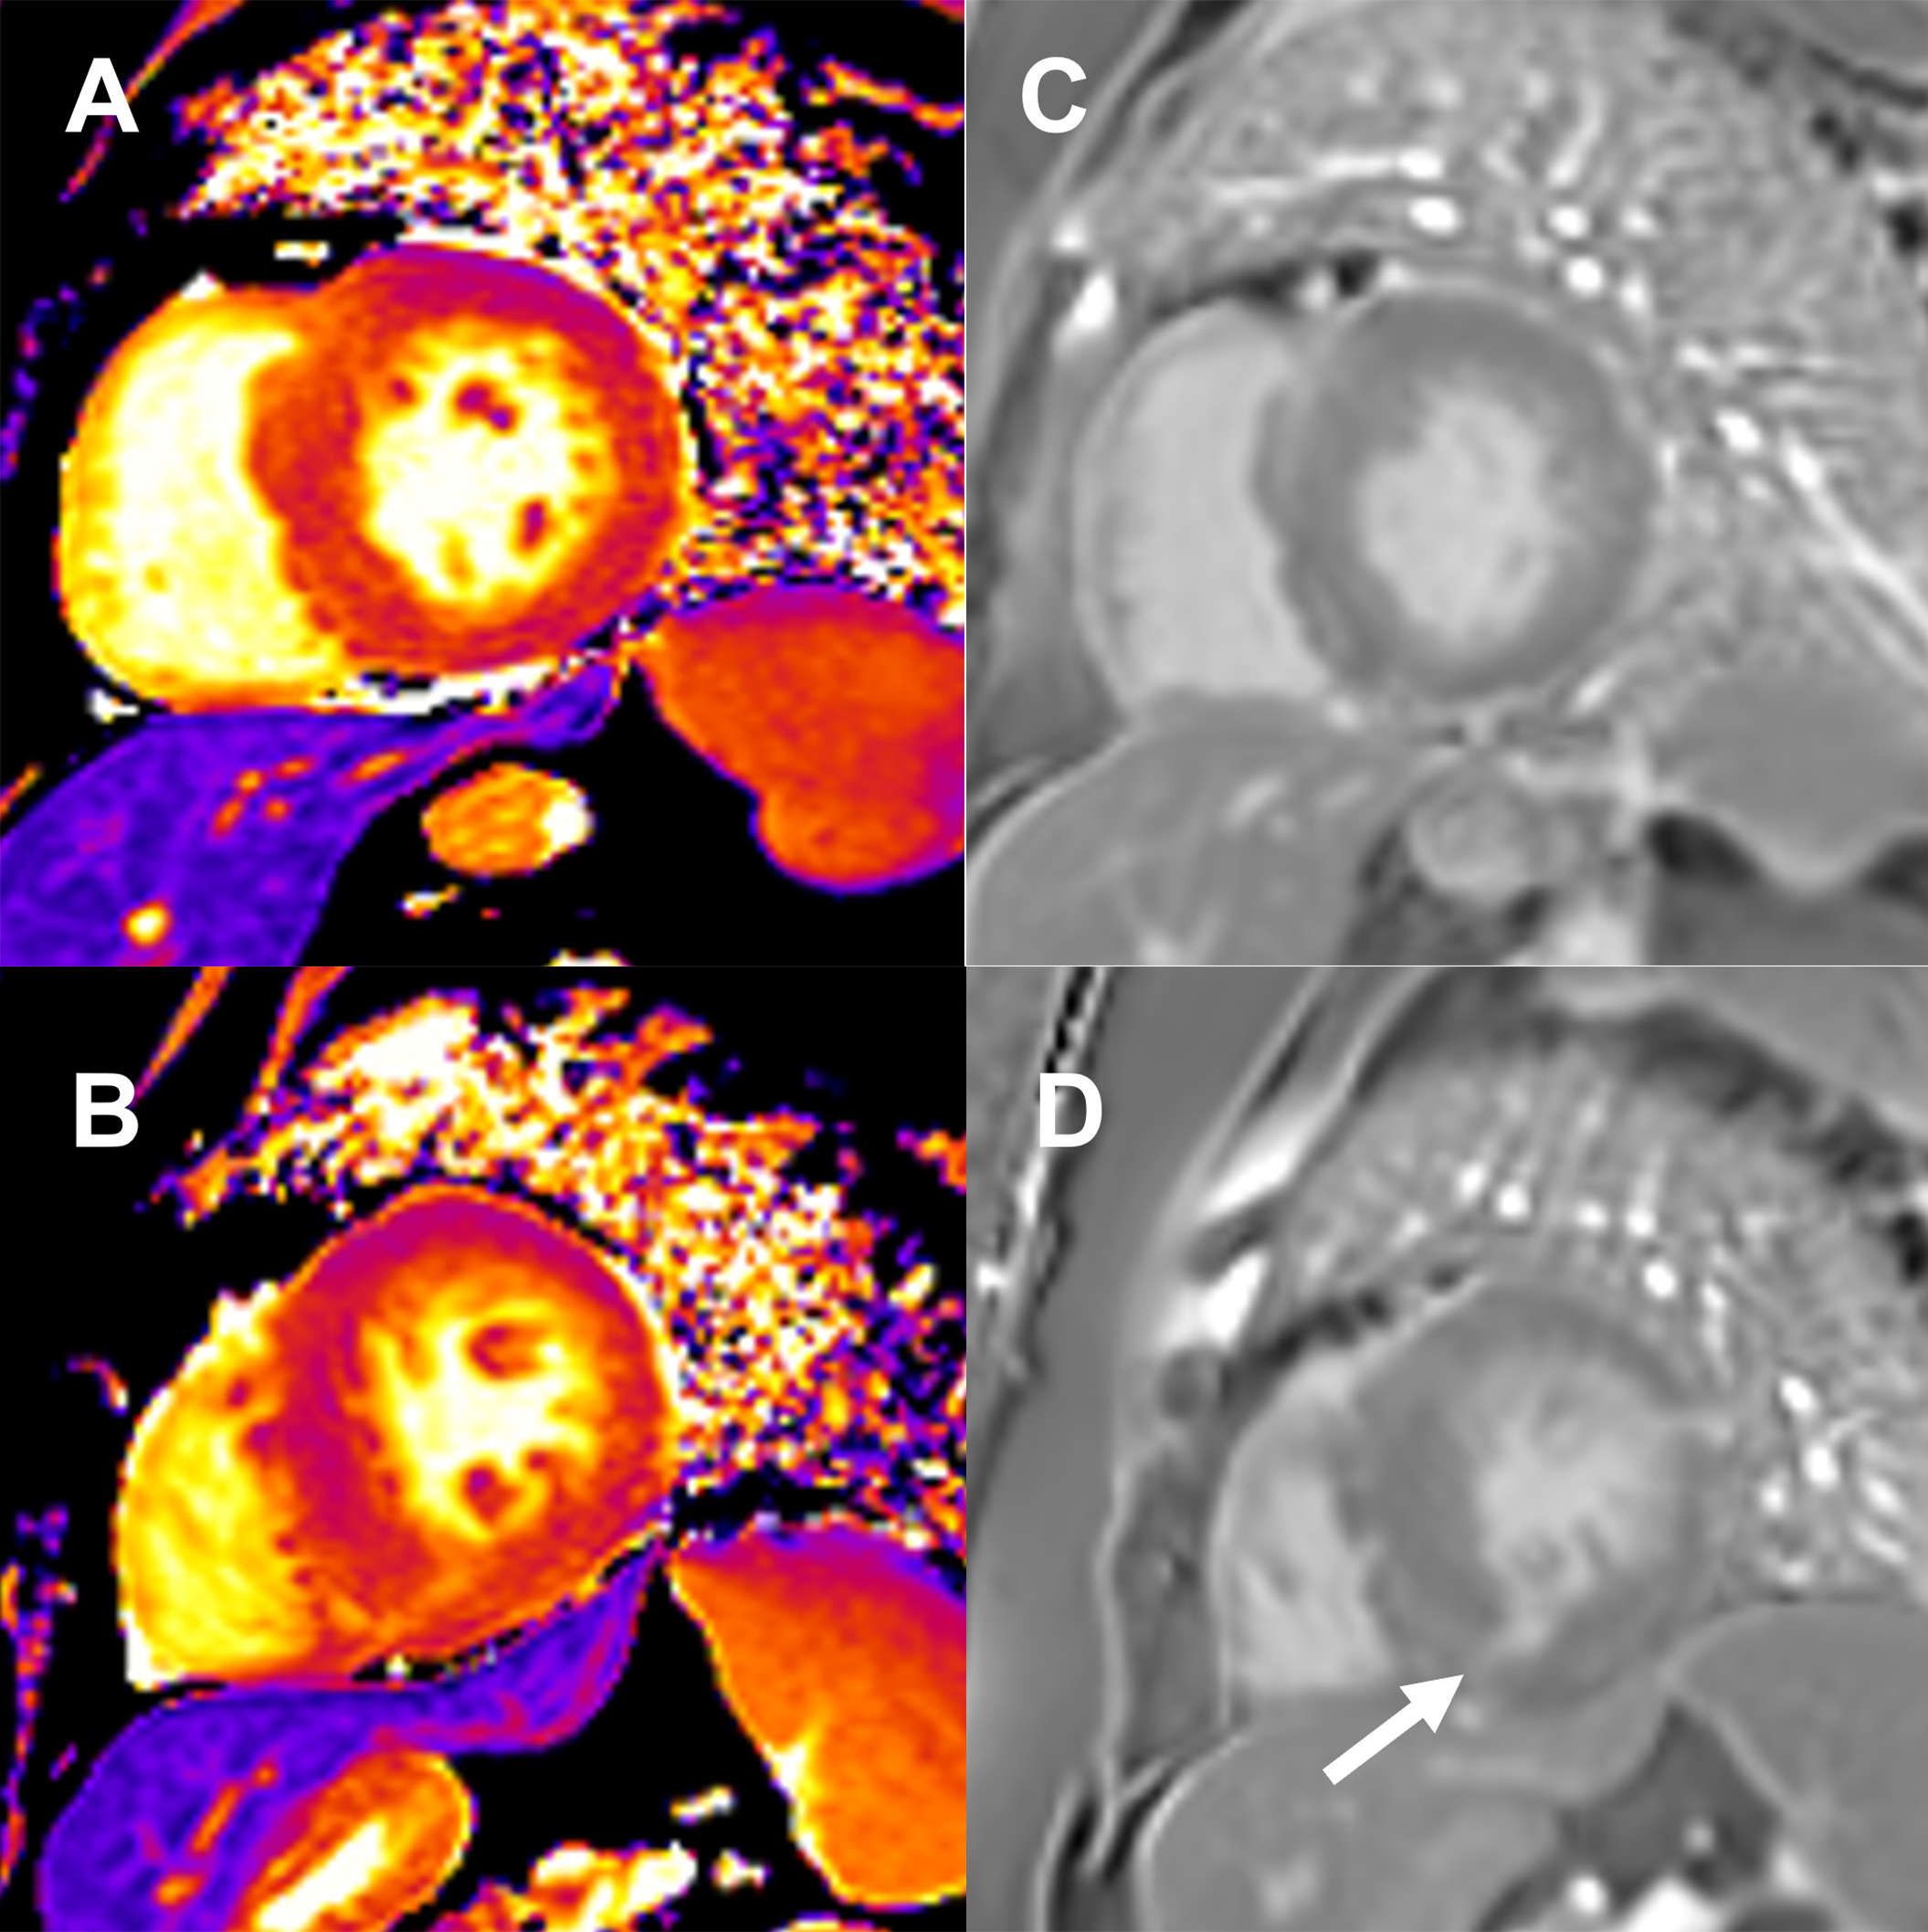 Fig. 5.
Native T1 mapping and late gadolinium enhancement (LGE) images in hypertrophic cardiomyopathy (HCM). Native T1 mapping with high signal at (A) mid-septal wall and (B) mid inferoseptal segment (white arrow). (C,D) Corresponding phase-sensitive inversion recovery (PSIR) imaging shows late gadolinium enhancement in the same regions.
Besides diagnosis, phenotypic characterization, and planning for septal
reduction procedures, CMR is also increasingly important for risk stratification
and prognosis in HCM. According to the 2020 American Heart Association
(AHA)/American College of Cardiology (ACC) guideline for the diagnosis and
treatment of patients with HCM [8], CMR plays a crucial role in the risk
stratification and subsequent decision to ICD placement. On the contrary, the ESC
guideline does not endorse LGE for risk stratification purposes and continues to
recommend the HCM Risk-SCD score, despite debate on the value of the latter
approach [28, 52, 53]. CMR allows assessment of maximum LV wall thickness, LV
ejection fraction, LV apical aneurysm, and extent of myocardial fibrosis with
LGE, all of which are used in ICD decision-making [8]. Massive LVH and systolic
dysfunction (ejection fraction
As stated above, the extent of scar, imaged by LGE is associated with increased
risk for potentially life-threatening ventricular arrhythmias and cardiac death
[46, 54, 55]. Based on this evidence, the AHA/ACC guideline recommends ICD
placement in the presence of extensive LGE (
Infiltrative cardiomyopathies refer to deposits of substances in the myocardial tissue resulting in a structural abnormality and/or alteration of cardiac function. They include CA, IOC, AFD, Danon disease, Friedreich’s Ataxia, and other rare conditions [56]. In this review we will focus on the most common infiltrative cardiomyopathies: CA, IOC, and AFD.
Systemic amyloidosis comprises a group of diseases caused by the deposition of insoluble amyloid fibrils in the extracellular space of tissues and organs. This deposition ultimately leads to progressive organ failure [57]. CA is an infiltrative cardiomyopathy characterized by increased biventricular wall thickening, restrictive LV filling, and, frequently, a non-dilated LV cavity with preserved or mildly depressed LV systolic function [58]. Previously thought to be rare, CA is now understood to be underdiagnosed [59].
Most cases of cardiac involvement occur in two types of amyloidosis: light chain
immunoglobulin (AL) and transthyretin amyloidosis (ATTR). ATTR is further
classified into the wild-type (
Echocardiography is often the first imaging modality performed in patients presenting with HF. CA’s echocardiographic features are frequently present in patients with advanced disease but absent earlier [61]. In recent years, the application of CMR in CA has increased, since it provides information regarding the presence, distribution, and location of hypertrophy, visualization of cardiac amyloid infiltration with LGE imaging, and measurement of cardiac amyloid burden with T1 mapping and ECV [62, 63, 64]. Additionally, CMR findings appear to have prognostic significance [65]. Technical development of new CMR sequences has contributed to CA awareness and recognition [1]. Furthermore, the emergence of new treatment strategies for CA, such as tafamidis, entails a need to establish the diagnosis during the earlier stages of the disease to prolong survival and improve outcomes.
Extracellular deposition of amyloid protein in CA produces an appearance of
hypertrophy with non-dilated or small ventricles [66]. The pattern of hypertrophy
can be asymmetric or symmetric, eccentric or concentric [66]. Among patients with
ATTR, the most common morphological phenotype is asymmetrical LVH (ratio between
the septal and posterior wall
Cardiac magnetic resonance can qualitative and quantitatively assess global and regional LV systolic function. Cardiac amyloid infiltration results in low end-diastolic volume, diastolic dysfunction, restrictive physiology with late depressed systolic function, arrhythmias, and HF [68]. The most recent 2021 ESC HF guidelines [4] state that CA should be suspected in any patient who presents with HF and preserved LV ejection fraction. The apical function is preserved until late, a typical pattern known as “apical sparing” [66]. Right ventricular and papillary muscle hypertrophy, biatrial dilation, thickening of the interatrial septum, valve leaflet thickening, and pericardial effusion are also frequently found [1].
In CA, there is an expansion of the extracellular space due to increased amyloid deposition, leading to high gadolinium concentrations in the myocardium and prolonged impermeability, resulting in LGE [70, 71]. LGE imaging provides highly characteristic findings with high diagnostic accuracy [72]. CA presents a distinctive pattern of LGE with global subendocardial or transmural distribution, associated with dark blood-pool due to abnormal gadolinium kinetics [73]. Three LGE patterns were identified in CA: none, subendocardial and transmural (Fig. 6). These patterns are a continuum and correlate with the extent of myocardial infiltration [74]. Transmural LGE is associated with the highest amyloid infiltration in advanced CA and has shown to carry the most adverse prognosis [74]. As opposed to myocardial infarction, LGE in CA is not limited to characteristic vascular territories nor is sharply defined [75]. RV LGE is also frequently present [67]. LGE is present in most cases of CA (100% LGE in LV and 96% in RV), being more common in ATTR (vs. AL-CA), but does not differentiate between CA subtypes [67].
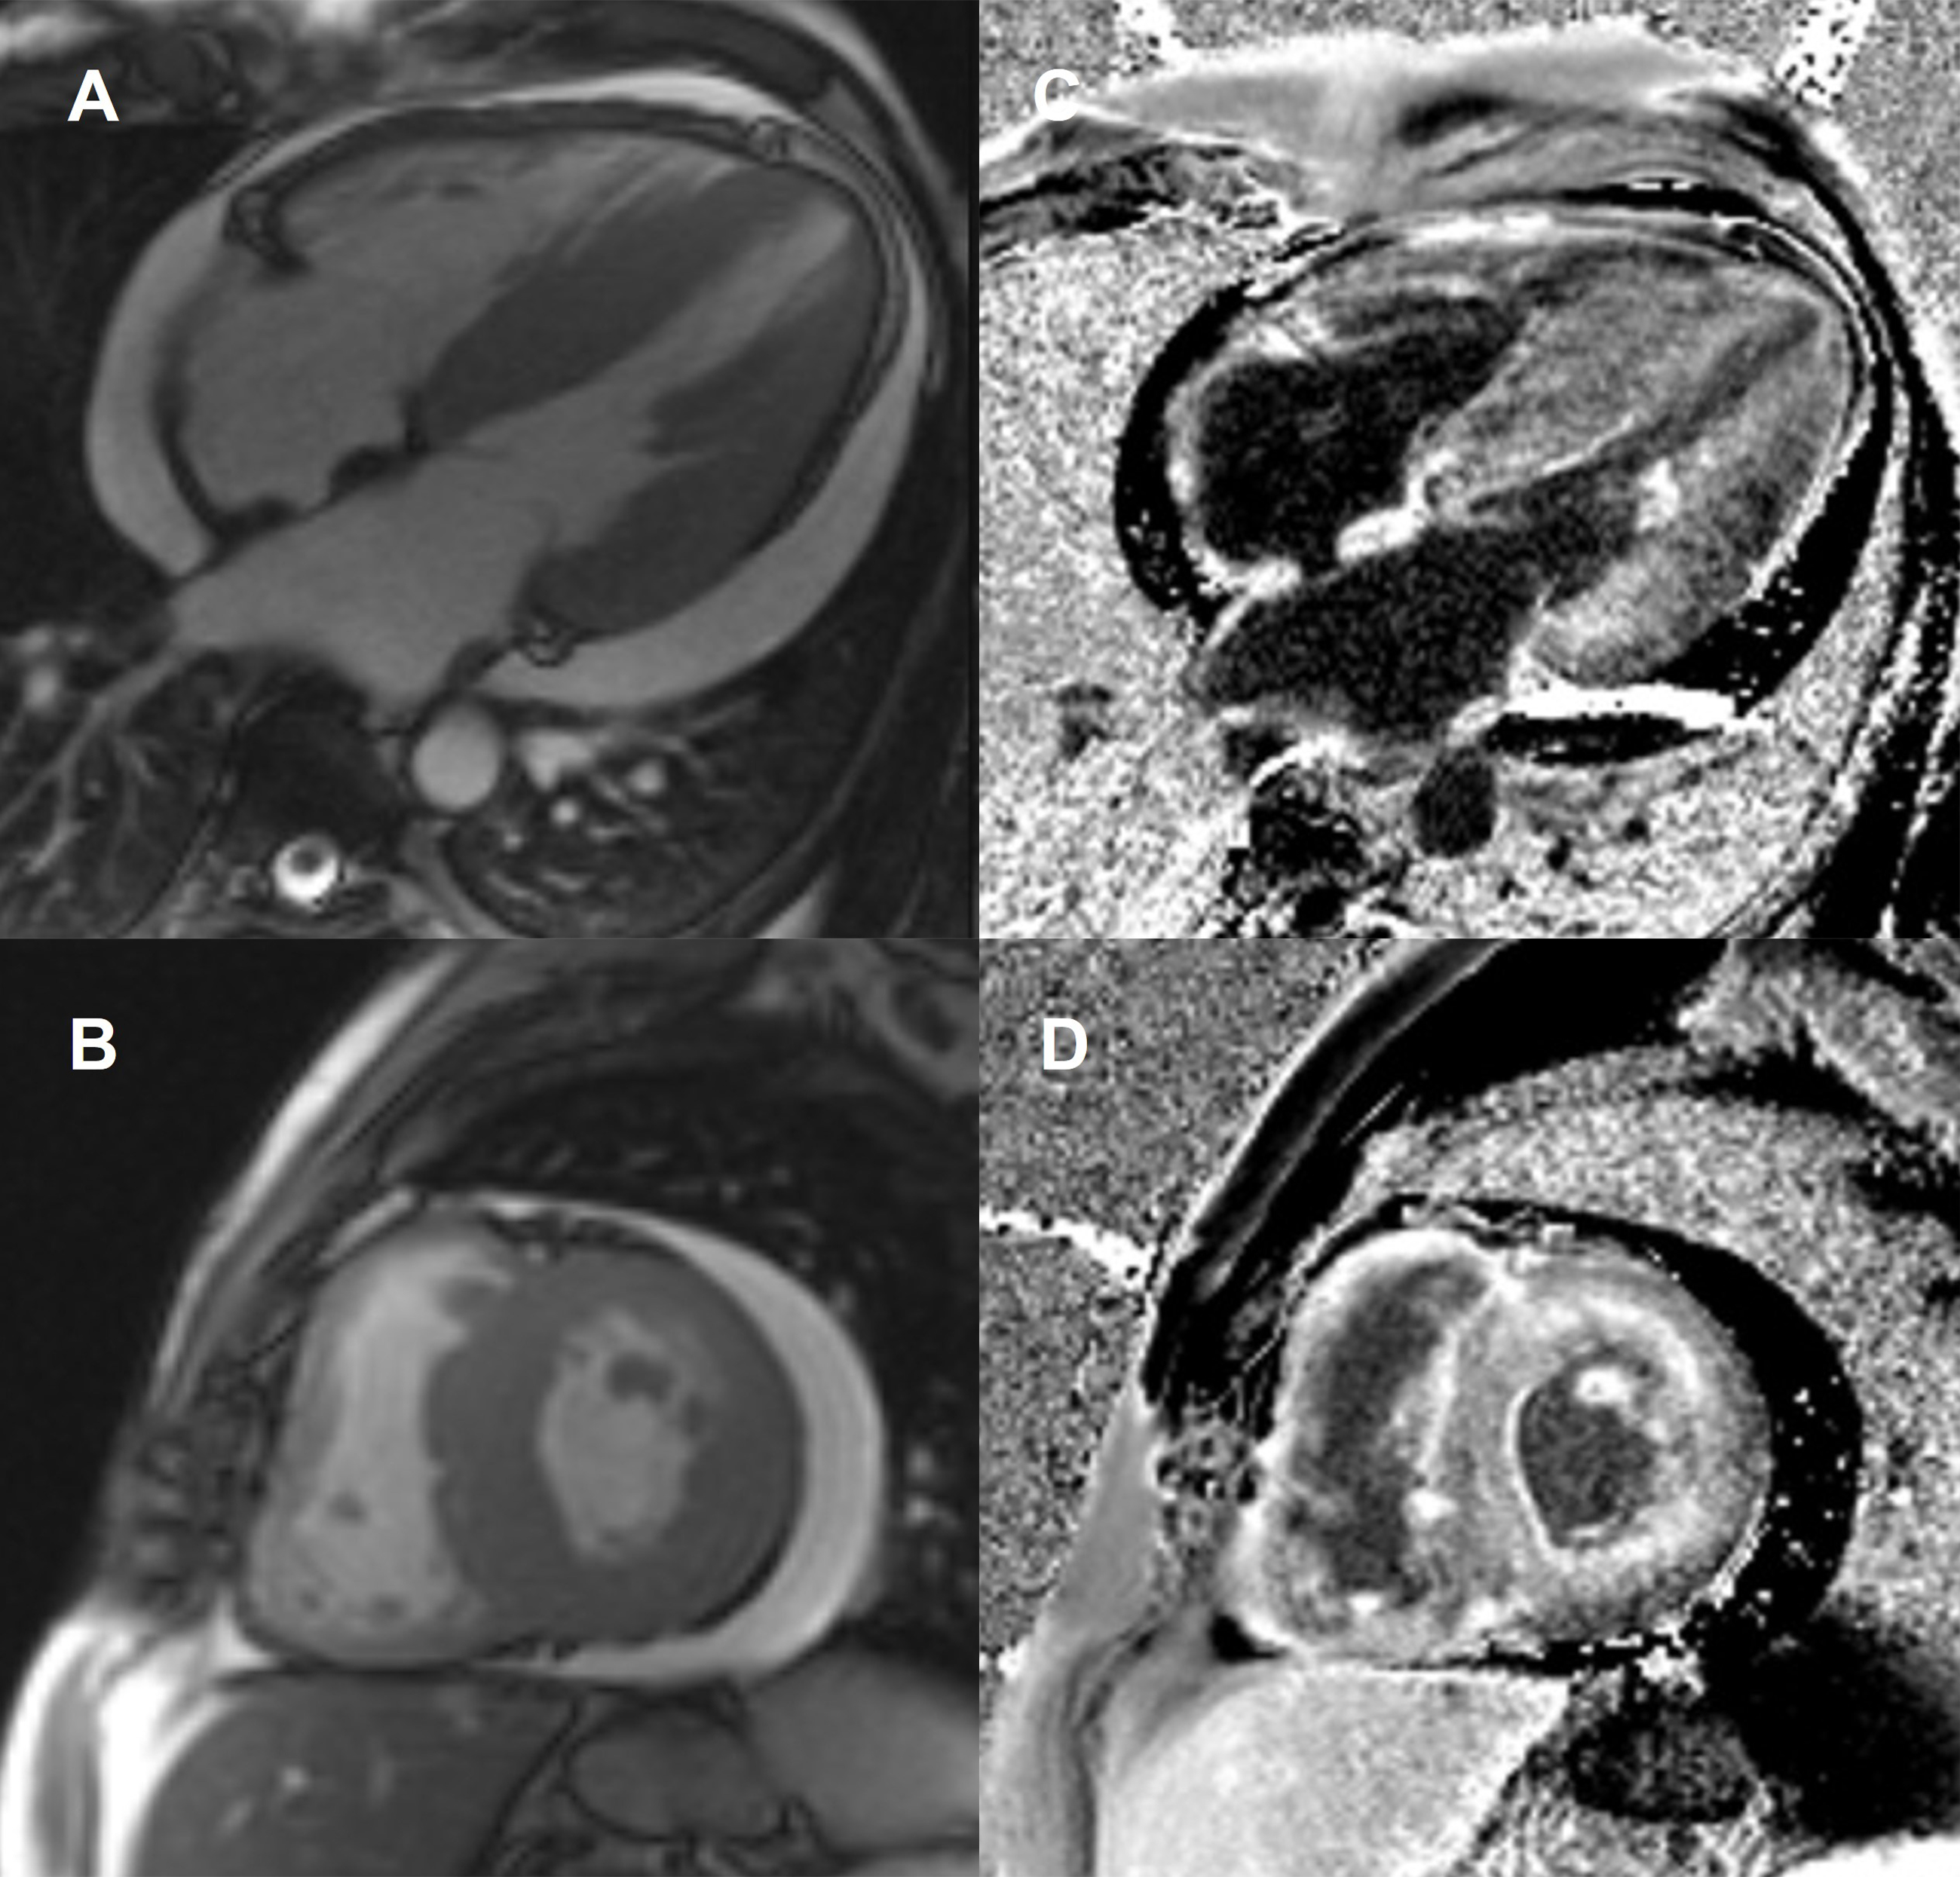 Fig. 6.
Cardiac amyloidosis. Steady-state free precession (SSFP) magnetic resonance images at (A) end-diastolic horizontal long-axis and (B) midventricular short-axis showing concentric thickening of left ventricular walls (septal wall measuring 26 mm), right ventricular thickening, biatrial dilatation, interatrial septal thickening (9 mm), and pericardial effusion. The corresponding late gadolinium enhancement (LGE) images (C and D) show extensive amyloid infiltration with generalized gadolinium uptake.
As previously stated, traditional LGE imaging is a comparison technique, based on differences between normal and abnormal myocardium. The null inversion time is chosen based on what the operator considers normal myocardium. By convention, the areas with the most contrast concentration should have a brighter display, and normal myocardium should be presented as black or “nulled” on LGE imaging. Nulling the normal myocardium in diffuse infiltrative diseases such as CA can be challenging given the lack of normal myocardium areas for comparison. The myocardial signal intensity may be globally “nulled,” thus looking like normal tissue [1, 67]. It is a clear indication of the presence of amyloidosis when achieving the usual contrasts in LGE imaging is a challenging task [75]. More recent techniques, such as phase-sensitive inversion recovery (PSIR), are less operator-dependent and more precise in defining the degree of cardiac involvement. A combination of LGE with T1 mapping is another alternative to address this issue [1, 72, 74].
Other limitations of LGE include the use of gadolinium which is relatively contraindicated in patients with severe renal dysfunction, common in patients with amyloid disease, and lack of quantitative results, limiting the ability to track changes over time. However, T1 mapping can overcome these limitations and potentially detect amyloid infiltration at an earlier stage of the disease than LGE [61, 76].
In CA, native myocardial T1 is significantly increased, and ECV expanded, with corresponding extensive LGE [77]. In a study of 868 patients with suspected CA, T1 mapping diagnosed CA with a sensitivity of 85% and specificity of 87% [78]. Importantly, native myocardial T1 elevation is also an early disease marker [64]. It increases with cardiac amyloid infiltration and correlates with markers of systolic and diastolic dysfunction [63]. T1 mapping can also measure the continuum of cardiac amyloid infiltration from early stages to diffuse transmural involvement [57]. Native T1 values over 1136 ms strongly suggest cardiac amyloid in patients with a clinical suspicion [78]. A CMR algorithm to minimize the use of contrast to evaluate patients with suspected amyloidosis has been proposed [78]. Native myocardial T1 mapping detects both ATTR and AL-CA with similar diagnostic accuracy, but ATTR presents lower maximal T1 elevation [64].
Native T1 mapping waives the use of gadolinium, playing an advantage to LGE [78]. However, native T1 measures myocardial signal from both the interstitium and cardiomyocytes, without distinguishing between the underlying processes (fibrosis, edema, amyloid, myocyte volume) [1]. A signal from the interstitium alone is somewhat diluted by the myocyte signal, so subtle differences are more difficult to detect. Moreover, capillary density, capillary vasodilatation, and “partial voluming” between blood pool and myocardium are also measured [79, 80]. The use of gadolinium and ECV measurements allow the isolation of the signal from the extracellular space [1]. Therefore, ECV is a more reliable marker of amyloid infiltration [57].
Post-contrast T1 is dominated by, and inversely proportional to, the gadolinium concentration in tissue. Measuring T1 after contrast provides a value linked to the interstitium. Post-contrast T1 value changes with gadolinium dose, post bolus time, and patient-specific factors, such as hematocrit, limiting its evaluation of the myocardium separately [66, 79]. If T1 is measured before and after contrast, adjusted for hematocrit, the extracellular space signal can be isolated with the measurement of the ECV [66]. The myocardial ECV represents the proportion of extracellular water, a proxy for the process of holding water, be it fibrosis, amyloid, or edema [79]. In CA, ECV values are markedly elevated and tend to be higher than in any other cardiomyopathy [63, 64, 65]. ECV allows a noninvasive quantification of the cardiac amyloid burden. Its elevation during cardiac infiltration may be detected early before developing LVH, LGE, or elevation in serum biomarkers, suggesting that ECV is a marker of early disease [62]. Furthermore, ECV predicts mortality in ATTR. Both native T1 and ECV predicted survival in ATTR; however, ECV is a more robust predictor [57, 67]. ECV appears to be greater in ATTR [57, 74] but does not seem to differentiate between the subtypes of CA [62].
T2-weighted CMR can detect myocardial edema, which is present in CA. There has not been as extensive evaluation of parametric sequences to measure myocardial T2 relaxation in CA when compared with native T1 values or ECV [61]. In a recent study, T2 was found to be higher in untreated AL-CA than treated AL-CA and ATTR, and predicts prognosis in AL-CA [81].
Iron overload is a systemic process characterized by an increased level of plasma iron and iron accumulation in parenchymal cells [82]. Its detection is imperative owing to multisystem manifestation such as myocardial disease, type 2 diabetes mellitus, or liver cirrhosis with increased risk of hepatocellular carcinoma [82]. IOC describes the different forms of cardiac dysfunction in the setting of increased gastrointestinal iron absorption (e.g., hereditary hemochromatosis) or as a result of transfusion-dependent anemias (e.g., thalassemia major and sickle cell disease) [83]. Early stages of IOC present as restrictive cardiomyopathy with diastolic LV dysfunction. If iron overload persists and no proper therapy is started, dilated cardiomyopathy with chamber dilatation and impaired systolic function may develop [84].
Cardiac magnetic resonance is the only non-invasive technique for quantifying
myocardial iron overload (MIO). It is considered the standard of care in
diagnosing and monitoring iron overload diseases [85, 86]. The presence of
myocardial iron deposits causes magnetic field inhomogeneity and accelerates the
relaxation times [87, 88]. As the myocardial iron concentration increases, the
signal intensity in T1-, T2- and T2*- weighted images decreases [89, 90]. CMR
gradient-echo T2* relaxation time is currently the mainstay of IOC diagnosis, and
the measure in a single slice of a full-thickness region of interest in the
mid-ventricular septum is highly representative of global myocardial iron
distribution [83, 91]. A multislice segmental approach is also validated and
allows the identification of different patterns of iron distribution (homogenous
MIO, heterogeneous MIO, and no MIO) that correlate with cardiac complications
[92, 93]. A cardiac T2* relaxation time of
Anderson-Fabry disease is an X-linked congenital error of the glycosphingolipid
metabolic pathway due to the absent or deficient activity of
Non-invasive detection and monitoring of cardiovascular manifestations of AFD have focused on LVH, the classical morphological abnormality of the disease, which can mimic the HCM. In fact, the prevalence of AFD gene mutations in patients with unexplained LVH is 0.5% [101]. LV concentric thickening is the most common morphological manifestation of AFD, but the spectrum also includes apical and asymmetric septal hypertrophy [102]. CMR imaging allows improved visualization of LV geometry and identification of hypertrophy, particularly in segments not well characterized by echocardiography, and quantification of LV mass index [103, 104]. Due to its higher precision, CMR has also been proposed for LVH follow-up and response monitoring of patients treated with enzyme replacement therapy [100, 104].
LGE is identified in up to 50% of AFD patients in the basal and/or mid inferolateral wall, with a mid-myocardial pattern [99, 105, 106]. The presence and extent of LGE are associated with a greater risk of adverse cardiac events, such as ventricular arrhythmias and SCD [102, 107]. Unfortunately, it is known that LGE imaging is less sensitive in the setting of a diffuse process, and the advanced renal dysfunction of some of these patients often precludes the use of contrast [40].
Tissue characterization using T1 mapping is a powerful tool in diagnosing cardiac involvement in AFD since the sphingolipid deposition in the myocardium provides a low native T1 value allowing distinction from other causes of LVH, which generally have an elevated T1 [108, 109]. It has been reported that in AFD without LVH or fibrosis, native T1 values may still be lower than normal, suggesting that it could be used as an early marker of cardiac involvement and a prompt the initiation of ERT to achieve long-term improvements [108, 110]. Furthermore, compared with healthy controls, these patients present normal myocardial ECV, suggesting no diffuse fibrosis [106, 109].
Arrhythmogenic cardiomyopathy (AC) is an inherited heart muscle disease characterized macroscopically by fibrofatty replacement of the RV myocardium, that may predispose to ventricular arrhythmias, unexplained syncope, and/or SCD. Therefore, an accurate and early diagnosis of AC is critical [111, 112]. The classic AC phenotype is characterized by isolated RV involvement, thus previously being designated arrhythmogenic right ventricular cardiomyopathy. More recently, genotype/phenotype studies have shown that biventricular and left-dominant disease variants are frequent and have led to the use of the term AC [4, 111].
Because the diagnosis of AC is challenging, an International Task Force (ITF) developed criteria, which were revised in 2010 [113]. ITF criteria for the diagnosis of AC are based on several parameters, including: global or regional dysfunction and structural alteration of the RV demonstrated on imaging; tissue characterization by endomyocardial biopsy; repolarization and depolarization electrocardiographic abnormalities; arrhythmias; and family history [113]. Therefore, AC diagnosis cannot be made based on imaging alone.
CMR examination is part of the criteria for the qualitative assessment of
regional RV wall motion abnormality on cine images (RV regional akinesia,
dyskinesia, dyssynchrony), combined with quantitative assessment of RV dilatation
or global RV systolic dysfunction. CMR major criteria require regional RV wall
motion abnormality (akinesis or dyskinesis or dyssynchronous RV contraction) and
either increased RV end-diastolic volume (
The revised ITF criteria did not include contrast-enhanced CMR, even being the only imaging modality able to identify fatty tissue on spin-echo sequences and fibrosis as LGE deposition [114]. Difficulty in the interpretation, limited experience, and low specificity of tissue characterization findings by CMR were among the reasons not to be included [113].
However, in recent years, CMR has emerged as the primary imaging modality in AC, since it allows for non-invasive multiplane morphologic and functional evaluation, and tissue characterization [114, 115]. CMR is the recommended modality for establishing a diagnosis of AC and adequate characterization of the disease phenotypic variant [111].
In AC, CMR may reveal global and regional ventricular dilation, global ventricular dysfunction, and regional wall motion abnormalities (Fig. 7). Regional wall motion abnormalities occur preferentially in the subtricuspid region. The “accordion sign”, that represents a focal “crinkling” of the myocardium, is an example of these abnormalities, which is caused by a small region with dyssynchronous contraction [112].
 Fig. 7.
Arrhythmogenic cardiomyopathy with isolated right ventricular involvement. Steady-state free precession (SSFP) magnetic resonance images at (A) end-diastolic and (B) end-systolic horizontal long-axis shows dilated right ventricle with mild-moderately depressed systolic function, akinesia/mild dyskinesia of the basal segment of the right ventricle free wall; and mild right atrial dilatation. Left ventricle morphology and systolic function are within the normal range.
Nearly all patients with AC (96% of patients) present an abnormal RV on CMR [116]. The most frequent RV abnormalities are basal inferior wall dyskinesia (in 94% of cases) and basal anterior wall dyskinesia (87% of cases). Although clinical studies have focused predominantly on RV abnormalities, LV involvement is more common than previously thought. LV involvement occurs in 52% of patients, which has led to the reconsideration of the initial dysplasia triangle (posterior lateral wall of the LV, subtricuspid, and anterior wall of the RV) [116]. Clinically demonstrable RV involvement in biventricular variants of AC is an important additional criterion to distinguish AC from dilated cardiomyopathy [111].
Cardiac magnetic resonance provides a rigorous quantitative analysis of RV volumes, but significant interobserver variability in the RV free wall segmental contraction analysis and interpretation of qualitative findings have been reported [117]. RV’s standardized and regional biventricular analysis using cine steady-state free precession (SSFP) imaging that includes all RV segments may help overcome these limitations [118].
Directly assessing tissue composition of thin RV wall also remains a technical challenge on MRI. Some technical advances may be an encouraging approach to decrease variability in assessing RV function, including semi-automated myocardial deformation quantification, particularly feature tracking [119].
The pathologic hallmark of AC is the fibrofatty replacement of the myocardial tissue. CMR allows tissue characterization (fibrosis, fatty infiltration, and fibrofatty scar), but LGE is not included in the 2010 ITF criteria [113]. The visualization of fat and LGE by CMR as a diagnostic hallmark faces several problems which withheld their use: intramyocardial fat occurs in normal hearts and is not specific for AC without associated functional abnormalities [120]; detection of fibrosis in the RV is nonspecific and frequently difficulted by the thin RV wall, which in AC may be even more pronounced, making the LGE technique less dependable than for the LV [121]; distinguishing fat from fibrosis by LGE sequences is challenging; and finally, LV LGE is nonspecific and has a broad range of differential diagnosis (AC, sarcoidosis, myocarditis, CA, HCM, and dilated cardiomyopathy). The absence of RV myocardial fat in CMR does not exclude the diagnosis of AC, as seen in pediatric patients [117]. The presence of fat should not be interpreted alone [118]. Given the limitations of CMR at evaluation of fat and fibrosis, AC diagnosis is mainly based on establishing the consequence of intramyocardial fibrofatty replacement, such as static morphological abnormalities and regional RV wall motion abnormalities [118].
While these limitations exist, LGE may still be useful in AC evaluation. Diagnostic accuracy for AC was best (98%) when pre-/post-contrast signal abnormalities (including LV fat infiltration and LGE) were considered together with wall motion alterations [122]. LGE may also increase the sensitivity in the diagnosis of biventricular AC by demonstrating segmental subepicardial LGE in the LV wall, which in LV-dominant phenotypic variants of AC may be the only imaging feature [111].
In patients with suspected AC, a normal CMR had a negative predictive value of 99% for major clinical events in a 4.3-year follow-up, potentially becoming a “rule-out” test for AC [111, 123]. Furthermore, no events were observed among patients with a normal CMR during a 6-year follow-up [116]. On the other hand, an abnormal CMR was an independent predictor of events with a cumulative effect of several anomalies (including morphology, wall motion abnormalities, and fat/fibrosis) [123].
CMR has also been useful in the risk stratification for arrhythmic events. In a study with AC mutation carriers, sustained arrhythmias during follow-up were associated with structural abnormalities on CMR [116]. Another study showed that CMR was an independent predictor of ventricular arrhythmias [123]. In patients with AC and ventricular arrhythmias, regional wall-strain assessed on cine-CMR reliably predicts arrhythmogenic ventricular tachycardia-substrate. This technique permits safe and improved diagnostic accuracy in AC, preventing the need for invasive procedures, and facilitates the planning of ventricular tachycardia ablation procedures [124].
Table 1 summarizes the main CMR findings and markers of prognosis in non-ischemic cardiomyopathies.
| Condition | Main CMR findings | Markers of worse prognosis in CMR |
| HCM | Asymmetric septal wall thickening |
LGE |
| Diffuse, mid-cavity, and apical variants | ||
| Elongated leaflets of mitral valve and abnormal papillary muscles | ||
| LV wall thickness | ||
| Patchy mid-myocardial LGE in hypertrophied areas | ||
| Mildly elevated T1 and ECV | ||
| CA | Biventricular wall thickening with non-dilated ventricles; biatrial dilation; pericardial effusion | LGE |
| LGE pattern (diffuse, subendocardial, or transmural) | Higher ECV fraction | |
| Markedly elevated native T1 and ECV | ||
| Abnormal gadolinium kinetics | ||
| IOC | Cardiac T2* |
Cardiac T2* |
| AFD | LV concentric thickening | LGE |
| Patchy mid-myocardial LGE in basal and/or mid inferolateral wall | ||
| Low native T1 and normal ECV | ||
| AC | Global and regional RV dilation and dysfunction | Any CMR abnormality |
| Intramyocardial fat | ||
| LGE | ||
| Focal wall thinning | ||
| AC, arrhythmogenic cardiomyopathy; AFD, Anderson-Fabry disease; CA, cardiac amyloidosis; CMR, cardiac magnetic resonance; ECV, extracellular volume; HCM, hypertrophic cardiomyopathy; IOC, iron overload cardiomyopathy; LGE, late gadolinium enhancement; LV, left ventricular; RV, right ventricular. | ||
Cardiac magnetic resonance imaging with late gadolinium enhancement, T1 mapping, T2 mapping, T2*-imaging, and extracellular volume, has proved to be a valuable tool in investigating the etiology of heart failure. Cardiomyopathies rarely recognized in the past, are now understood to be underdiagnosed, and patients are receiving appropriate treatment thanks to the unparallel capacity of tissue characterization of cardiac magnetic resonance.
Cardiac magnetic resonance findings are proving to be crucial risk markers for prediction of clinical outcomes and can influence clinical management and decision-making in these patients. Therefore, cardiac magnetic resonance is an indispensable imaging modality in determining the diagnosis of nonischemic cardiomyopathies and assessing its prognosis.
PCA and VL performed the research, analyzed the data, and wrote the original draft. LAF, NM and CMM conceptualized the study, reviewed, and edited the original draft. NM and PD provided scientific support and knowledge. LG and PD provided supervision and critical review of the manuscript. All authors contributed to editorial changes in the manuscript. All authors read and approved the final manuscript.
Not applicable.
We acknowledge our hospital colleagues for their help and discussion.
This research received no external funding.
The authors declare no conflict of interest.