


 , Svetlana Uzbekova 3, Fedor Severin 4, Claude Prigent 5,6, Yannick Arlot-Bonnemains 7
1 Laboratoire Biologie Cellulaire et Microscopie Electronique, Faculté Médecine, University François Rabelais, 37032 Tours, France
2 Faculty of Bioengineering and Bioinformatics, Moscow State University, 119991 Moscow, Russia
3 Physiology of Reproduction and Behavior (PRC) mixed Research Unit of National Research Institute for Agriculture, Food and the Environment (INRAE), National Center for Scientific Research (CNRS), French Institute of Horses and Riding (IFCE), University of Tours, 37380 Nouzilly, France
4 A.N. Belozersky Institute of Physico-chemical Biology, Moscow State University, 119991 Moscow, Russia
5 University of Montpellier, Centre National de la Recherche Scientifique (CNRS), 34000 Montpellier, France
6 Centre de Recherche en Biologie Cellulaire de Montpellier (CRBM), Centre National de la Recherche Scientifique, 34293 Montpellier, France
7 Mixed Research Unit 6290, National Center for Scientific Research (CNRS), Institute of Genetics and Development of Rennes, University of Rennes 1, 35043 Rennes, France
Abstract
The centrosome is one of the principal cell hubs, where numerous proteins important for intracellular regulatory processes are concentrated. One of them, serine-threonine kinase 6, alias Aurora A, is involved in centrosome duplication and mitotic spindle formation and maintenance.
Long-term vital observations of cells, immunofluorescence analysis of protein localization, synchronization of cells at different phases of the cell cycle, Western blot analysis of protein content were used in the work.
In this study, we investigated the dynamics of Aurora A protein accumulation and degradation in the XL2 Xenopus cell line during its 28-hour cell cycle. Using Western blot and immunofluorescence analyses, we demonstrated that Aurora A disappeared from the centrosome within one hour following mitosis and was not redistributed to other cell compartments. Using double Aurora A/Bromodeoxyuridine immunofluorescence labeling of the cells with precisely determined cell cycle stages, we observed that Aurora A reappeared in the centrosome during the S-phase, which was earlier than reported for all other known proteins with mitosis-specific centrosomal localization. Moreover, Aurora A accumulation in the centrosomal region and centrosome separation were asynchronous in the sister cells.
The reported data allowed us to hypothesize that Aurora A is one of the primary links in coordinating centrosome separation and constructing the mitotic spindle.
Keywords
- centrosome
- cell cycle
- Aurora A kinase
- mitosis
- centrosome separation
The centrosome is a unique place in the cell where the proteins involved in the regulation of many intracellular processes, including cell cycle progression, are concentrated [1, 2]. The integrity of the morphology and biochemical composition of centrosomes is important for cell cycle progression. The removal of the centrosome by microsurgery or its inactivation by ultraviolet microirradiation blocks cell proliferation [3, 4].
The centrosome structure and biochemical composition during mitosis differ from those during interphase. The functional capability of mitotic centrosomes is higher in comparison with their interphase counterparts. The ability of mitotic centrosomes to initiate microtubule (MT) polymerization is four to seven times higher compared to that of interphase centrosomes [5, 6]. A significant increase in the MT nucleation ability of the centrosome is related to the activity of a set of proteins, which includes Aurora A [7].
Centrosomal serine/threonine protein kinase 6, alias Aurora A, is a member of the Aurora kinase family and one of the major enzymes of cell cycle regulation, Aurora kinases regulate mitosis and meiosis in all eukaryotic organisms [8, 9]. Aurora A activity is required for the recruitment of the Cyclin-dependent kinase 1 (Cdk1)-cyclin B1 complex to the centrosome prior to its activation and commitment of the cell for mitosis. Aurora A protein kinase is one of the cell-cycle-dependent centrosomal proteins. In most interphase XL2 cells, Aurora A was not detected in the centrosome [10]. In XL2 cells, the maximal level of this protein was observed in mitosis [11]. Biochemical analyses of synchronized cells have confirmed the degradation of this protein during G1-phase and its accumulation in the cells prior to mitosis [12, 13].
The activity of Aurora A is important for mitosis progression: inhibition of its synthesis by interferential RNA leads to the blockage of entry into mitosis possibly due to impaired accumulation of cyclin B in the centrosome [14]. Also, inhibition of Aurora A synthesis causes a 40% decrease in the number of centrosome-associated microtubules (MT) and the blockage of mitotic accumulation of gamma-tubulin as well as two other pericentriolar proteins, Zyg-9 and CeGrip [15]. Injection of antibodies against Aurora A only delays (but does not prevent) entry into mitosis, thus suggesting that even the minimal amount of remaining Aurora A is sufficient for cell cycle progression [16].
In our previous studies, we showed that Xenopus laevis Aurora A, in contrast to many other important proteins involved in the formation and functioning of the mitotic spindle, was present at the centrosome in a fraction of interphase cells [10, 11, 17].
In the present study, we aimed to analyze the spatio-temporal pattern of Aurora A localization in XL2 proliferating cells during the cell cycle, which takes approximately 28 hours [18, 19, 20, 21]. We showed that Aurora A accumulates at the centrosomes earlier than the other mitosis-specific centrosomal proteins, indicating that this kinase plays a key regulatory role in cell cycle-dependent centrosomal changes.
All reagents were purchased from Sigma (Saint-Quentin Fallavier, France) unless otherwise stated. N-acetyl-leucyl-leucyl-norleucinal (ALLN) and Mowiol were from Calbiochem (Molsheim, France). Texas-red-conjugated goat anti-mouse antibodies and fluorescein isothiocyanate (FITC)-conjugated goat anti-rabbit immunoglobulin G (IgG) were obtained from Interchim (Montluçon, France). Leibovitz-15 (L-15) cell culture medium and antibiotic-antimycotic solution (penicillin-streptomycin-amphotericin) were from Gibco/Bethesda Research Laboratories, Inc. (BRL) Life Technologies (Saint Aubin, France). Fetal calf serum was obtained from BioTime (Alameda, CA, USA). All other chemical reagents used were of analytical grade.
The XL2 cell line [22, 23] was a gift from Prof. J. Tata (Mill Hill - NIMR
Laboratory, London, UK). Cells were grown at 25 °C in L-15 medium
(Gibco/BRL Life Technologies, Saint Aubin, France, cat. No 11415-049)
supplemented with 10% fetal calf serum (Sera-Tech Zellbiologische producte GmbH,
St. Salvator, Austria, cat. No 940910) and antibiotic-antimycotic solution
(Gibco/BRL Life Technologies, Saint Aubin, France, cat. No 15240-062). Cells were
not contaminated by mycoplasma. For live observation, coverslips with cells were
mounted in a special chamber for long living observations [24] and photographed
using an inverted microscope (Leica DMIRBE, Vienna, Austria) with a 40
XL2 cells were synchronized as described [18, 19, 20]. Briefly, after serum starvation for 24 h, the cells were incubated for 30 h in a complete L-15 medium supplemented with 2 µg/mL aphidicolin (Sigma-Aldrich, Saint-Louis, MO, USA, cat. No A-0781) and then released from the block by five washes with fresh complete L-15 medium. Cell fractions enriched in phases “S” and “G2” were collected 2 h and 10 h after washing, respectively. For mitotic “M” phase enrichment, the cells were incubated for 8 h after washing out the aphidicolin in complete L-15 medium with 0.5 µg/mL nocodazole (Sigma-Aldrich, St. Louis, MO, USA, cat. No 19,429-8) for 3 h. The cells were also incubated for 4 h in complete medium containing 0.5 µg/mL nocodazole and 40 µg/mL calpain inhibitor I ALLN (Calbiochem-Novabiochem Corp., La Jolla, CA, USA, cat. No 208719). Mitotic cells were collected 20 min after washing off the nocodazole and ALLN with fresh medium. The “G1” fraction was collected 11 h after removal of the nocodazole/ALLN mixture. The “G0” fraction was obtained by growing cells for 7 days in complete medium at 9 °C and then 24 h in serum-free medium at 25 °C.
Calculations of the percentages of cells in particular cell cycle stages were performed as described earlier [18, 21].
Synchronized cells were washed with phosphate saline buffer (PBS): 120 mM NaCl, 2.7 mM KCl, 10 mM phosphate-buffer, pH 7.2) and lysed in Laemmli sample buffer [25]. Lysates were boiled for 10 min at 100 °C, and equal amounts of proteins were subjected to 17% polyacrylamide gel electrophoresis. Then, the gels were transferred onto Hybond C nitrocellulose membranes and blocked in Tris-buffered saline with Tween-20 (TBST: Tris 20 mM buffer, 500 mM NaCl, 0.05% Tween-20, pH 7.5) containing 5% skimmed milk for 2 hours at room temperature. Blots were incubated for 3 h with monoclonal mouse anti-Xl Aurora A (dilution 1:250, clone 1C1, produced in our laboratory [11]) or monoclonal mouse anti-beta-tubulin (dilution 1:500, Sigma Chemicals, St. Louis, MO, USA, clone TUB2.1) primary antibodies diluted in TBST supplemented with 2.5% skimmed milk. Membranes were then washed for 1 h in TBST supplemented with 2.5% skimmed milk and incubated in TBST/2.5% skimmed milk and secondary horseradish peroxidase-conjugated antibodies (dilution 1:1000, Sigma Chemicals, St. Louis, MO, USA). Blots were developed using a Super Signal kit (Pierce, Rockford, IL, USA). Quantitative analysis of Aurora A protein content in cell extracts from synchronized cell populations was performed as previously described [18, 21]. Aurora A protein content values were normalized to beta-tubulin signal. Experiments were repeated three times.
Xenopus laevis XL2 cells after live observation experiments were washed with warm (+37 °C) PBS and fixed in cold methanol (–20 °C) for 6 min. Cells in other experiments were grown on coverslips in 12-well plates (Corning Inc., Corning, NY, USA) for 48 h before the same fixation. Following washes in PBS, the cells were treated with PBS containing 3% Bovine Serum Albumin (BSA Cohn Fraction V, Research Organic Inc. St, Cleveland, OH, USA, cat. No 1328A) for 30 min and then incubated with both mouse anti-Aurora A monoclonal antibody (dilution 1:100, clone 1C1, produced in our laboratory [11]) and rabbit anti-gamma tubulin polyclonal antibody (dilution 1:100, clone R2, produced in our laboratory [26]) for 60 min. After washes, the antigens were visualized by fluorescein isothiocyanate (FITC)-conjugated goat anti-rabbit IgG (dilution 1:100, Sigma Immuno Chemicals, St. Louis, MO, USA, cat. No F 12-62) and Texas red-conjugated goat anti-mouse IgG (dilution 1:70, Jackson Immuno Research laboratories Inc. Cambridge, UK, cat. No 115-076-003) in PBS containing 1% BSA at room temperature for 60 min. After immunolabeling, cells on coverslips were rinsed in PBS, mounted in Mowiol (Calbiochem-Novabiochem Corp. La Jolla, CA, USA, cat. No 475904), and observed under an Axiovert 35 Zeiss fluorescence microscope. Experiments were repeated five times.
Cells grown on glass coverslips were incubated in complete medium with 40
µM Bromodeoxyuridine (5-bromo-2′-deoxyuridine, BrdU, Sigma Immuno
Chemicals, St. Louis, MO, USA, cat. No B 5002) for 30 min before fixation. Then,
cells were briefly washed with PBS and fixed in cold (–20 °C) methanol
for 6 min. After they had been washed in PBS, the cells were treated for Aurora A
labeling as described above. After immunolabeling, cells on coverslips were
rinsed in PBS and mounted in glycerol. Samples were observed using a Zeiss
Axiolab microscope (Zeiss, Marly-le-Roi, France) equipped with phase contrast and
epifluorescence, using 40
After Aurora A immunofluorescence labeling of the cells (five experiments, n = 312), the nuclear areas in the cells were measured from the images obtained by the phase-contrast method using special software (NIS Elements D5.02, Nikon, Japan). For each cell, it was documented whether Aurora A staining was present in the centrosome. The results of all measurements were pooled by group, and statistical analysis was carried out using ANOVA followed by Tukey’s post hoc test.
Western blot analysis of XL2 cells at different cell cycle stages showed that
Aurora A protein was either undetectable or faintly present in the G0-phase.
However, in the G1-phase, a small amount of Aurora A was detected, and its level
was increased in the S-phase, reaching its maximum in the M-phase (Fig. 1A),
followed by a sharp decrease until 80 min after mitosis (Fig. 1D,E). These data
are in close agreement with our previous data [13, 18, 20, 21]. It should be noted
that some variability in the Aurora A kinase expression level between experiments
strongly depends on the purity of the obtained synchronized cell samples. For
cycling proteins such as Aurora A, it is especially important to minimize the
contamination of the samples of synchronized cells in the G1 and S phases by the
cells in the G2 and mitosis phases. To exclude this influence, we have previously
developed a method based on an accurate study of the proportion of cells in each
phase, for mathematical analysis of the expression of various proteins during the
cell cycle to calculate “hypothetical pure fractions” containing cells of only
one phase of the cell cycle [21]. In particular, for Aurora A kinase, the
calculated ratios of Aurora A to beta-tubulin in such “pure fractions” were G1
= 1/S = 2.79/G2 = 24.66/mitosis = 40.08 times. For comparison, in the present
work, in real cell populations, in which the basal phase ranged from 71% to
92%, the average ratios of Aurora to beta-tubulin were G1 = 1/S = 1.8
 Fig. 1.
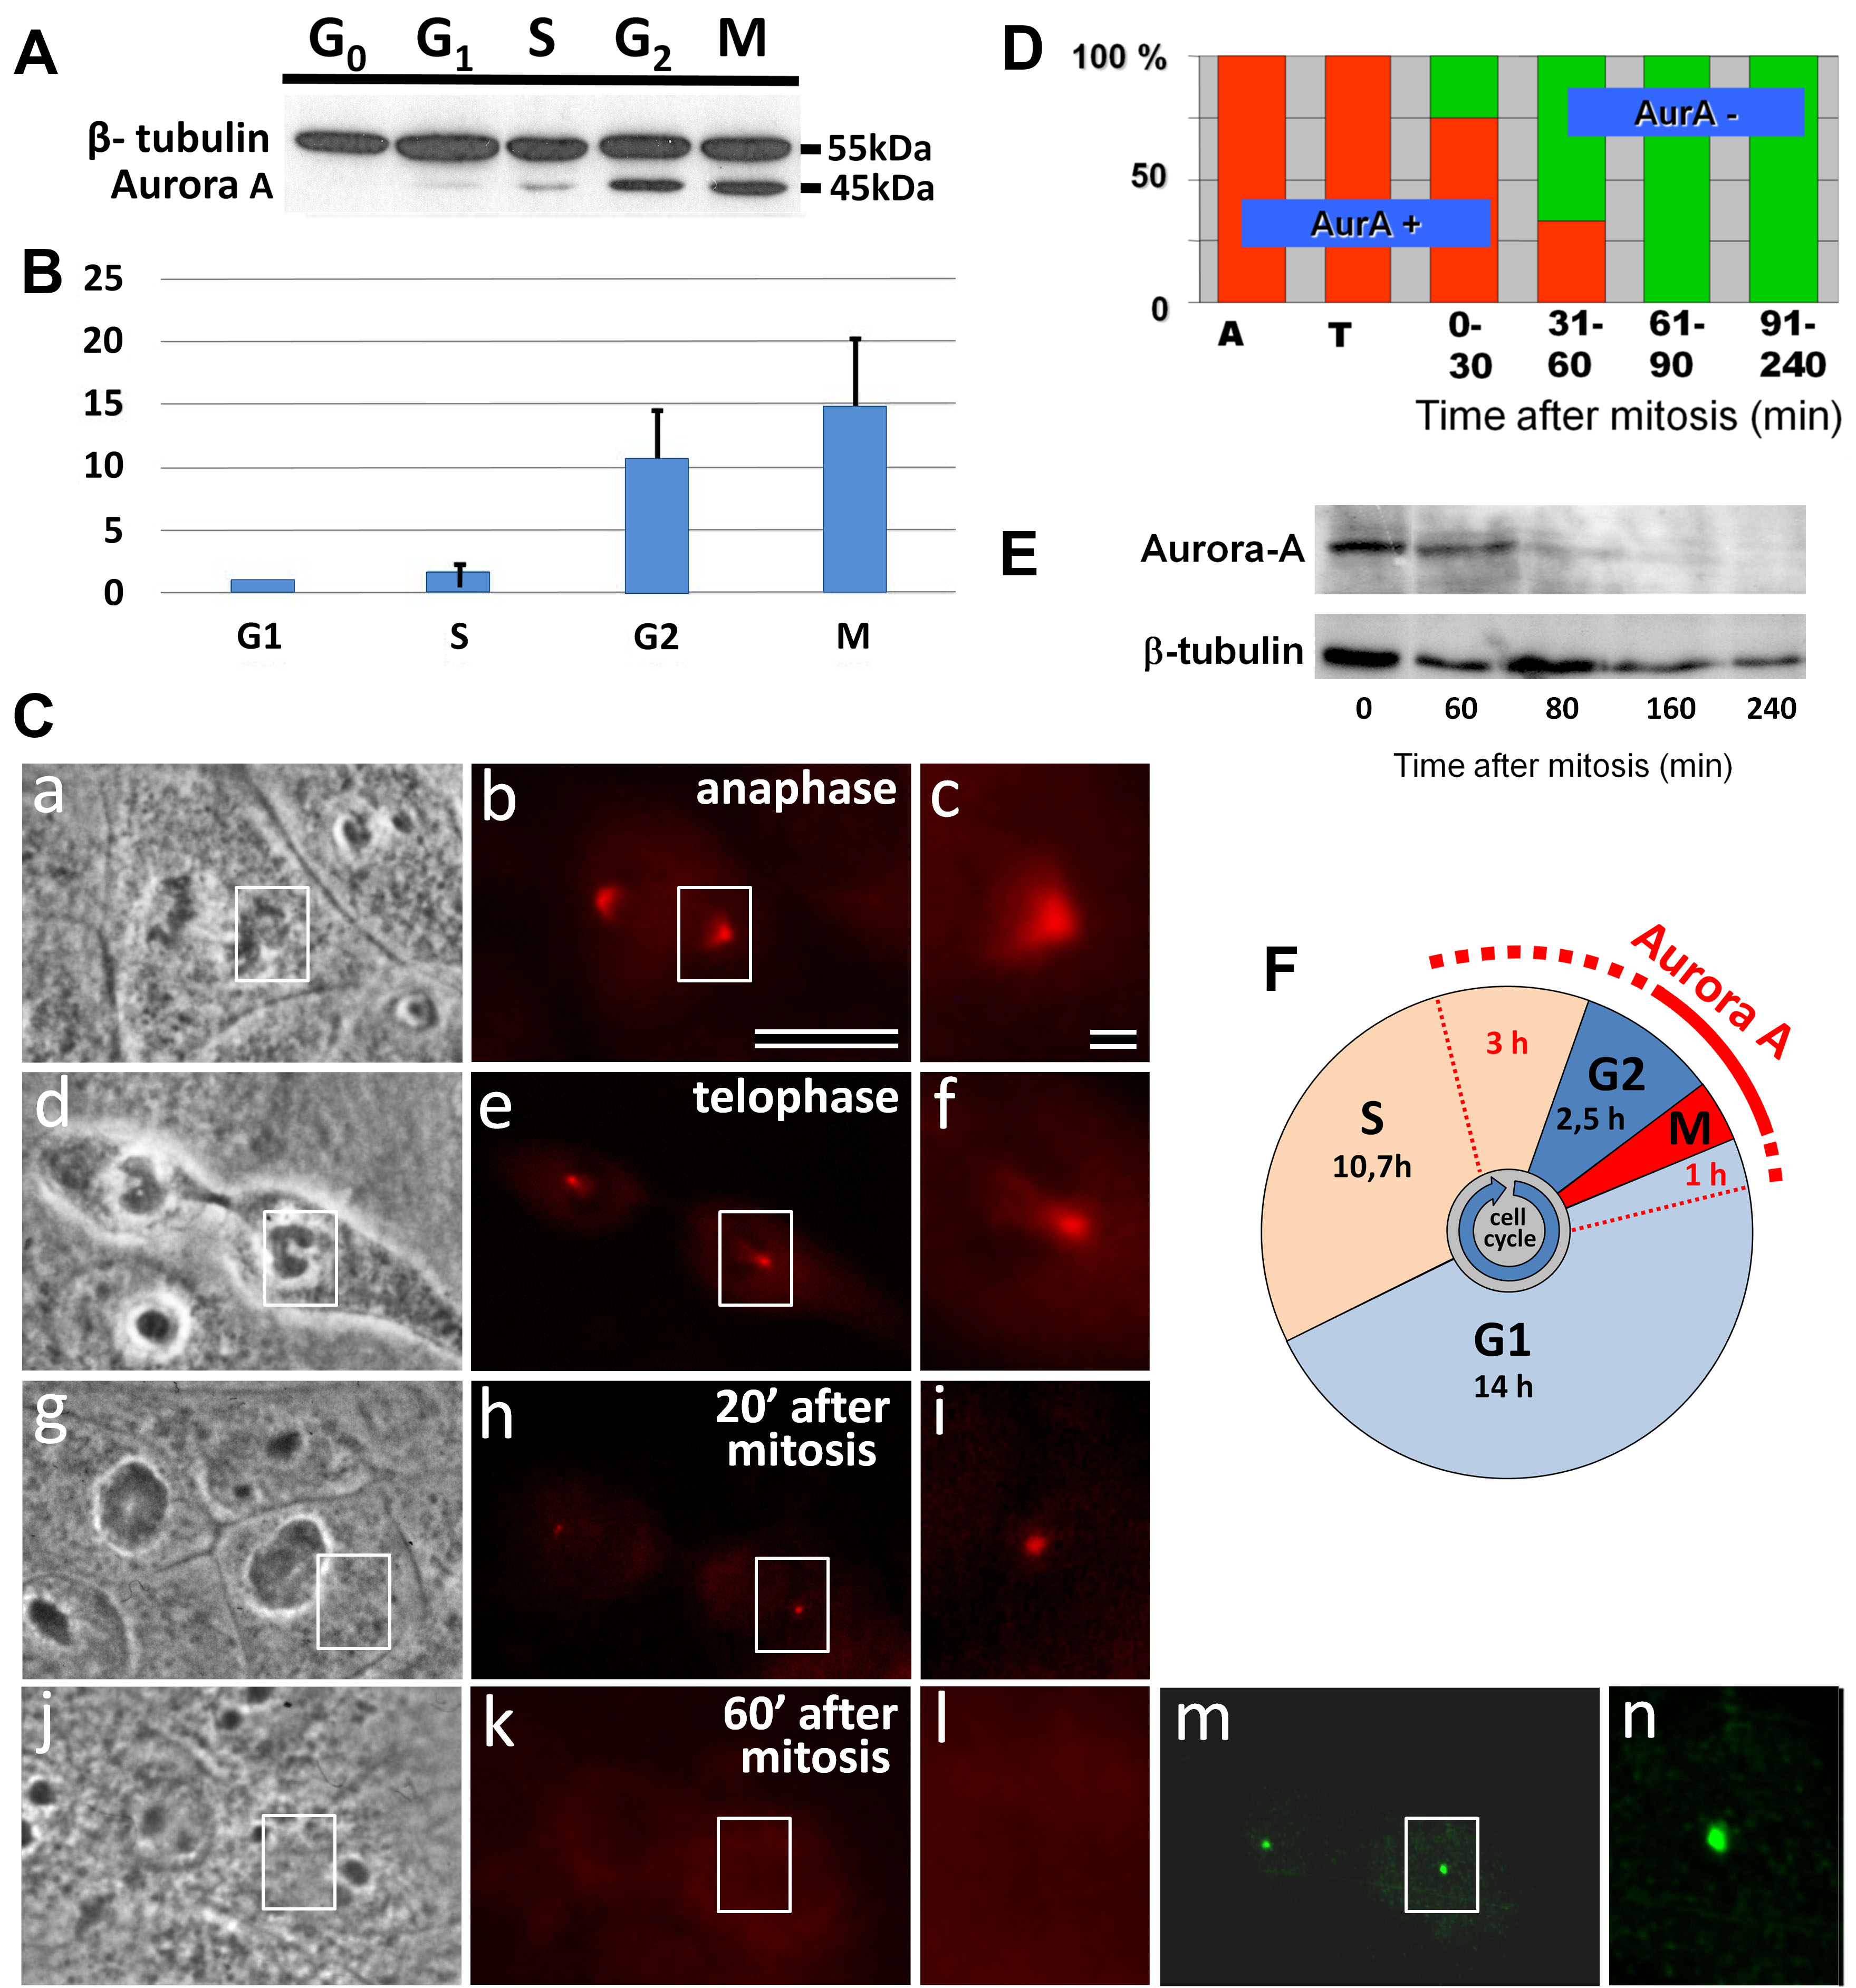
Disappearance of Aurora A from the centrosome region in XL2 cells. (A) Analysis of relative Aurora A quantity in different phases of the cell cycle. Western blot analysis of cell fractions enriched by G0, G1, S, G2-phases, and mitosis (M). (B) Comparative quantitative analysis of Aurora A in different cell cycle phases from Western blot (ratio Aurora A to beta-tubulin in G1 was considered as 1). (C) Phase contract (a,d,g,j) and Aurora A (red) immunofluorescent labeling (b,c,e,f,h,i,k,l), or gamma-tubulin (green) immunofluorescent labeling (m,n). Images c, f, i, l, and n show the enlarged centrosome region from images b, e, h, k and m, respectively. Bars: 10 µm (a,b,d,e,g,h,j,k,m) and 1 µm (c,f,i,l,n). (D) Diagram of the ratio Aurora A-positive and Aurora A-negative centrosomes from immunofluorescent data of XL2 cells in A—anaphase, T—telophase of mitosis, and post-mitotic cells. (E) Analysis of Aurora A degradation after mitosis. Cells were synchronized in mitosis, and the level of Aurora A was estimated during 1–4 h of the cell cycle. (F) Cell cycle phases of XL2 cells and the presence of Aurora A.
By analysis of Aurora A immunofluorescence coupled with phase-contrast determination of the cell cycle stage, the maximal level of Aurora A in the centrosomes was found in metaphase and anaphase mitotic cells (Fig. 1C,a–c). During telophase progression and in the early G1-phase, the intensity of Aurora A labeling in the centrosomes strongly decreased (Fig. 1C,d–n).
Analysis of the centrosomal region in early G1-phase cells showed that the time of disappearance of centrosomal Aurora A labeling was variable between the cells. The first Aurora A-negative centrosomes were detected less than 30 min after the end of mitosis. The last Aurora A positive centrosomes were observed as late as 50 min after the beginning of the G1-phase. At the same time, Aurora A disappeared simultaneously from the centrosomes of the daughter cells. From 60 to 240 min after mitosis, the centrosomes were negative for Aurora A staining in all of the analyzed cells (n = 16) (Fig. 1D,E). Fig. 1F shows the dependence of the localization of Aurora A in the centrosome from the phase of the cell cycle.
We observed a correlation between Aurora A labeling and nuclear size. This might reflect the cell cycle-dependent regulation of Aurora A synthesis and/or its centrosomal accumulation.
Nuclear growth and accumulation of Aurora A kinase to the centrosome are
unidirectional processes, since both of them prepare the cell for mitosis.
Morphological analysis of the nuclear area in Aurora A immunofluorescence-labeled
cells was performed to determine how these processes are coordinated (Fig. 2).
The mean nuclear area was 70.5
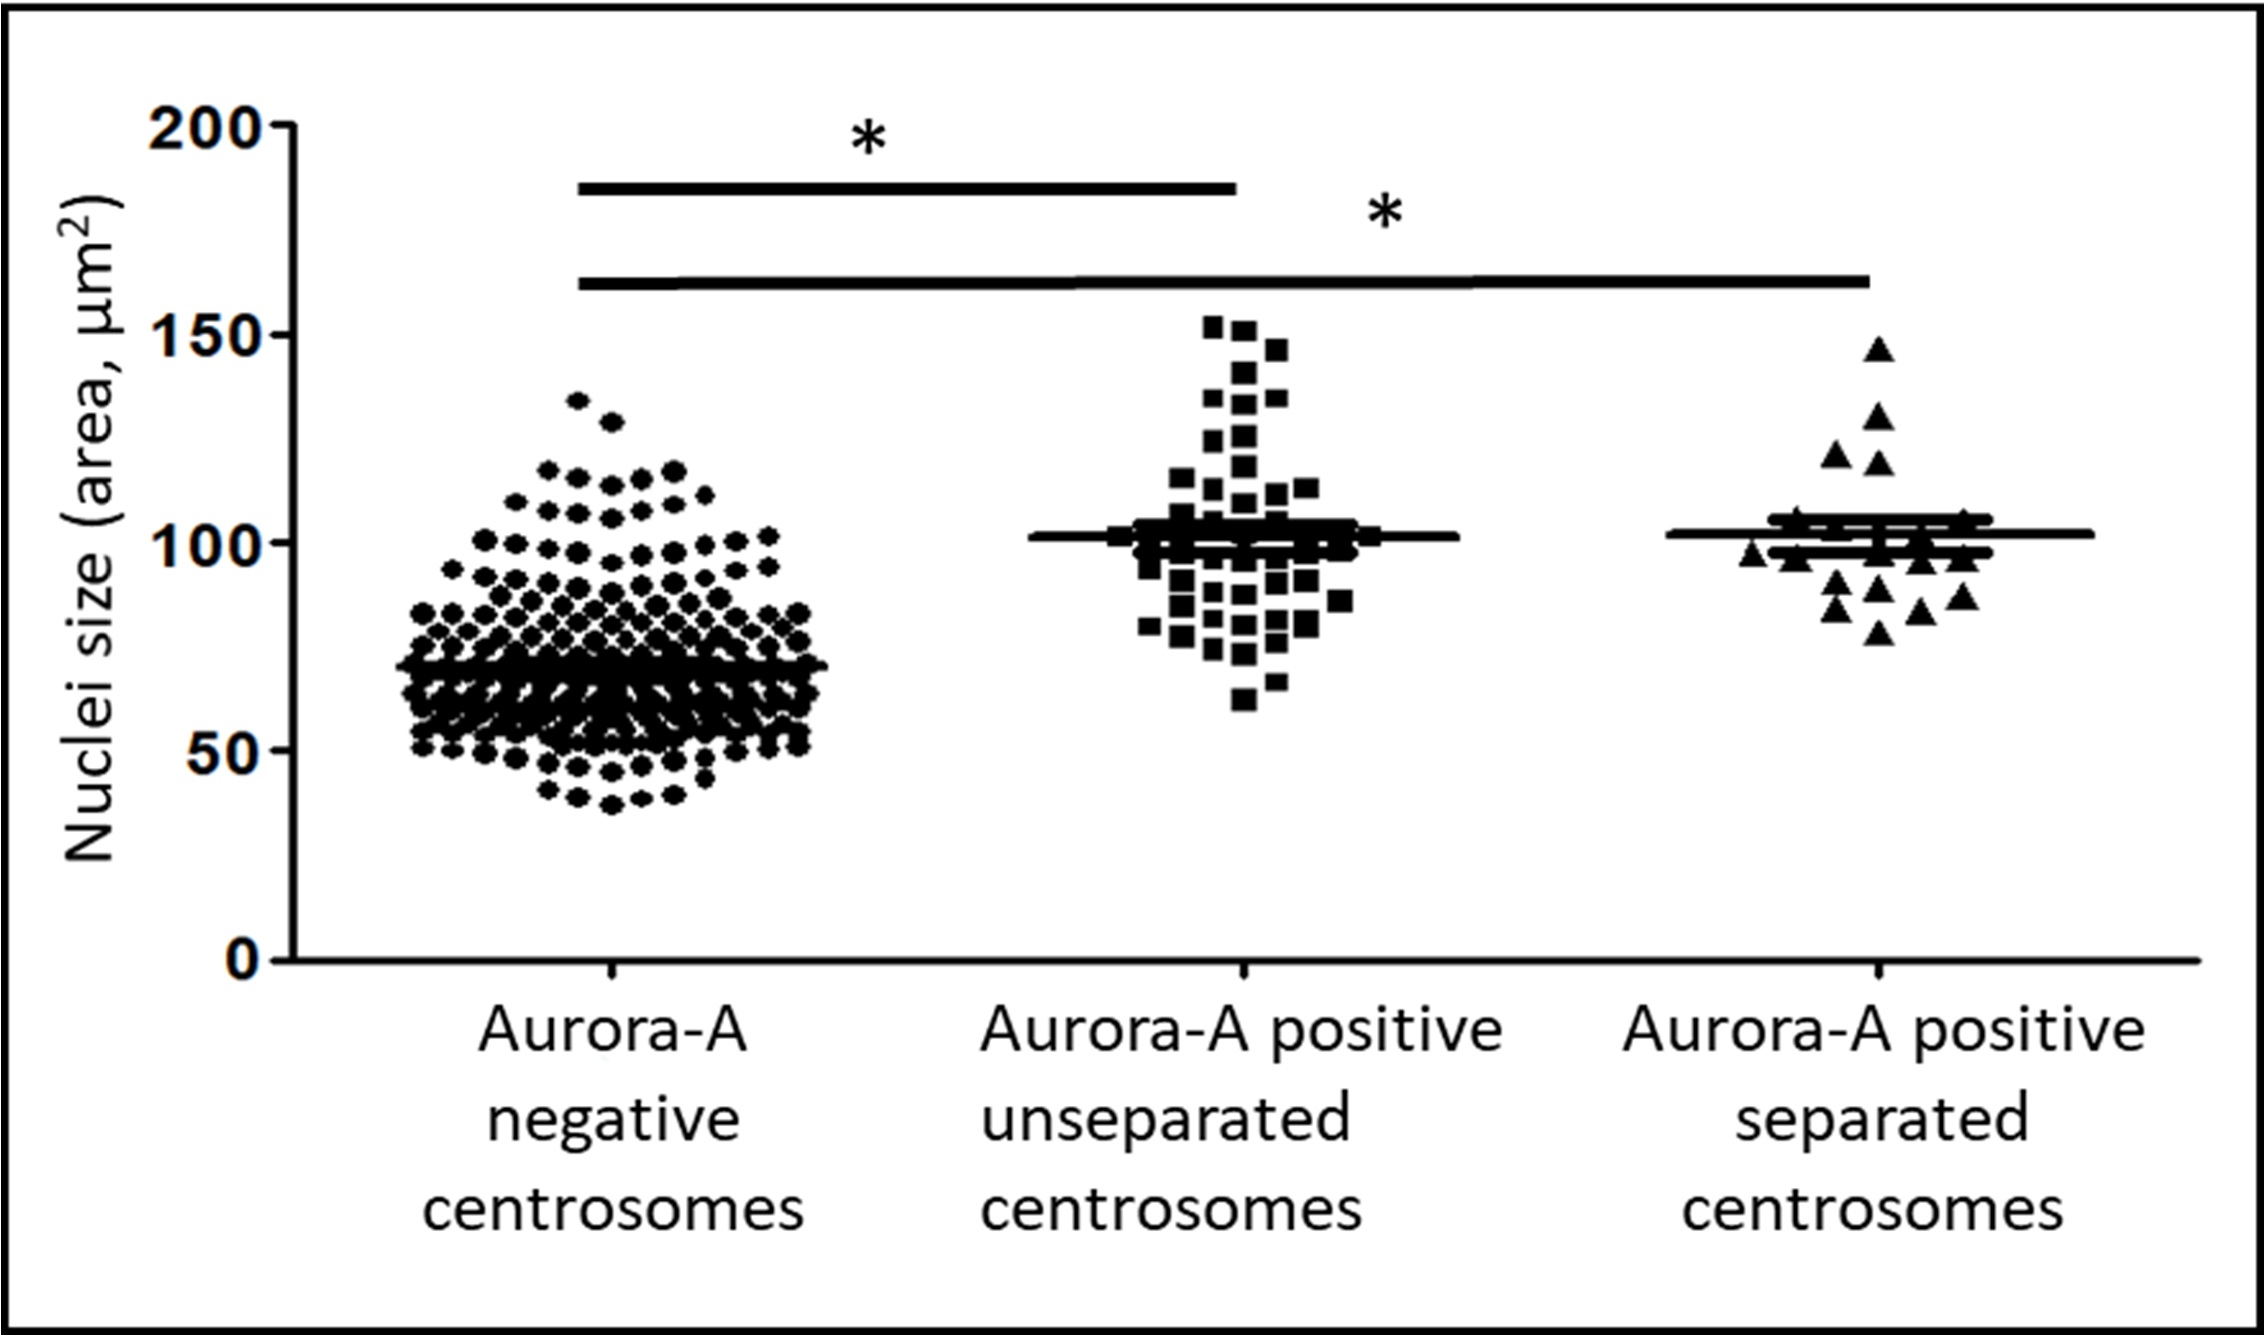 Fig. 2.
Dependence of the presence of Aurora A kinase in the centrosome
region and centrosome separation from the size of nuclei in the XL2 cell line.
The area of the nucleus in cells with Aurora A-negative centrosomes (n = 226),
Aurora A-positive non-separated centrosomes (n = 67), and Aurora A-positive
separated centrosomes (n = 19). * marks statistically significant
differences between the groups (p
By immunofluorescence on unsynchronous cells (n = 1000), we determined that 18.6% of the cells with a comparatively large nucleus showed a positive signal for Aurora A in the centrosome. In addition, 0.9% of the cells in the early G1-phase with a visible midbody also showed Aurora A centrosome staining (Supplementary Fig. 2). These data demonstrated that the part of the cells where Aurora A was detected in the centrosome was significantly higher than the proportion of G2-phase cells in unsynchronized XL2 that is less than 10% [18].
To confirm Aurora A accumulation in the centrosome during the S-phase, we
performed simultaneous detection of Bromodeoxyuridine (BrdU) and Aurora A protein
in log-phase asynchronous cells after 30 min of incubation with BrdU
(Fig. 3). At that time point, 133 out of 460 cells have incorporated
BrdU, and centrosomes in 28 of them (21.05 %) were Aurora A-positive (Fig. 3).
This indicated that the Aurora A appeared in the centrosome on average 2.25 h
before the end of S-phase (21.05% of the S-phase duration). The calculation
based on the S-phase to G2-phase duration ratio (10.67 hours and 2.51 hours,
respectively, according to [18]), predicted that the number of Aurora A-positive
cells in the G2-phase should be 31 cells (133/10.67
 Fig. 3.
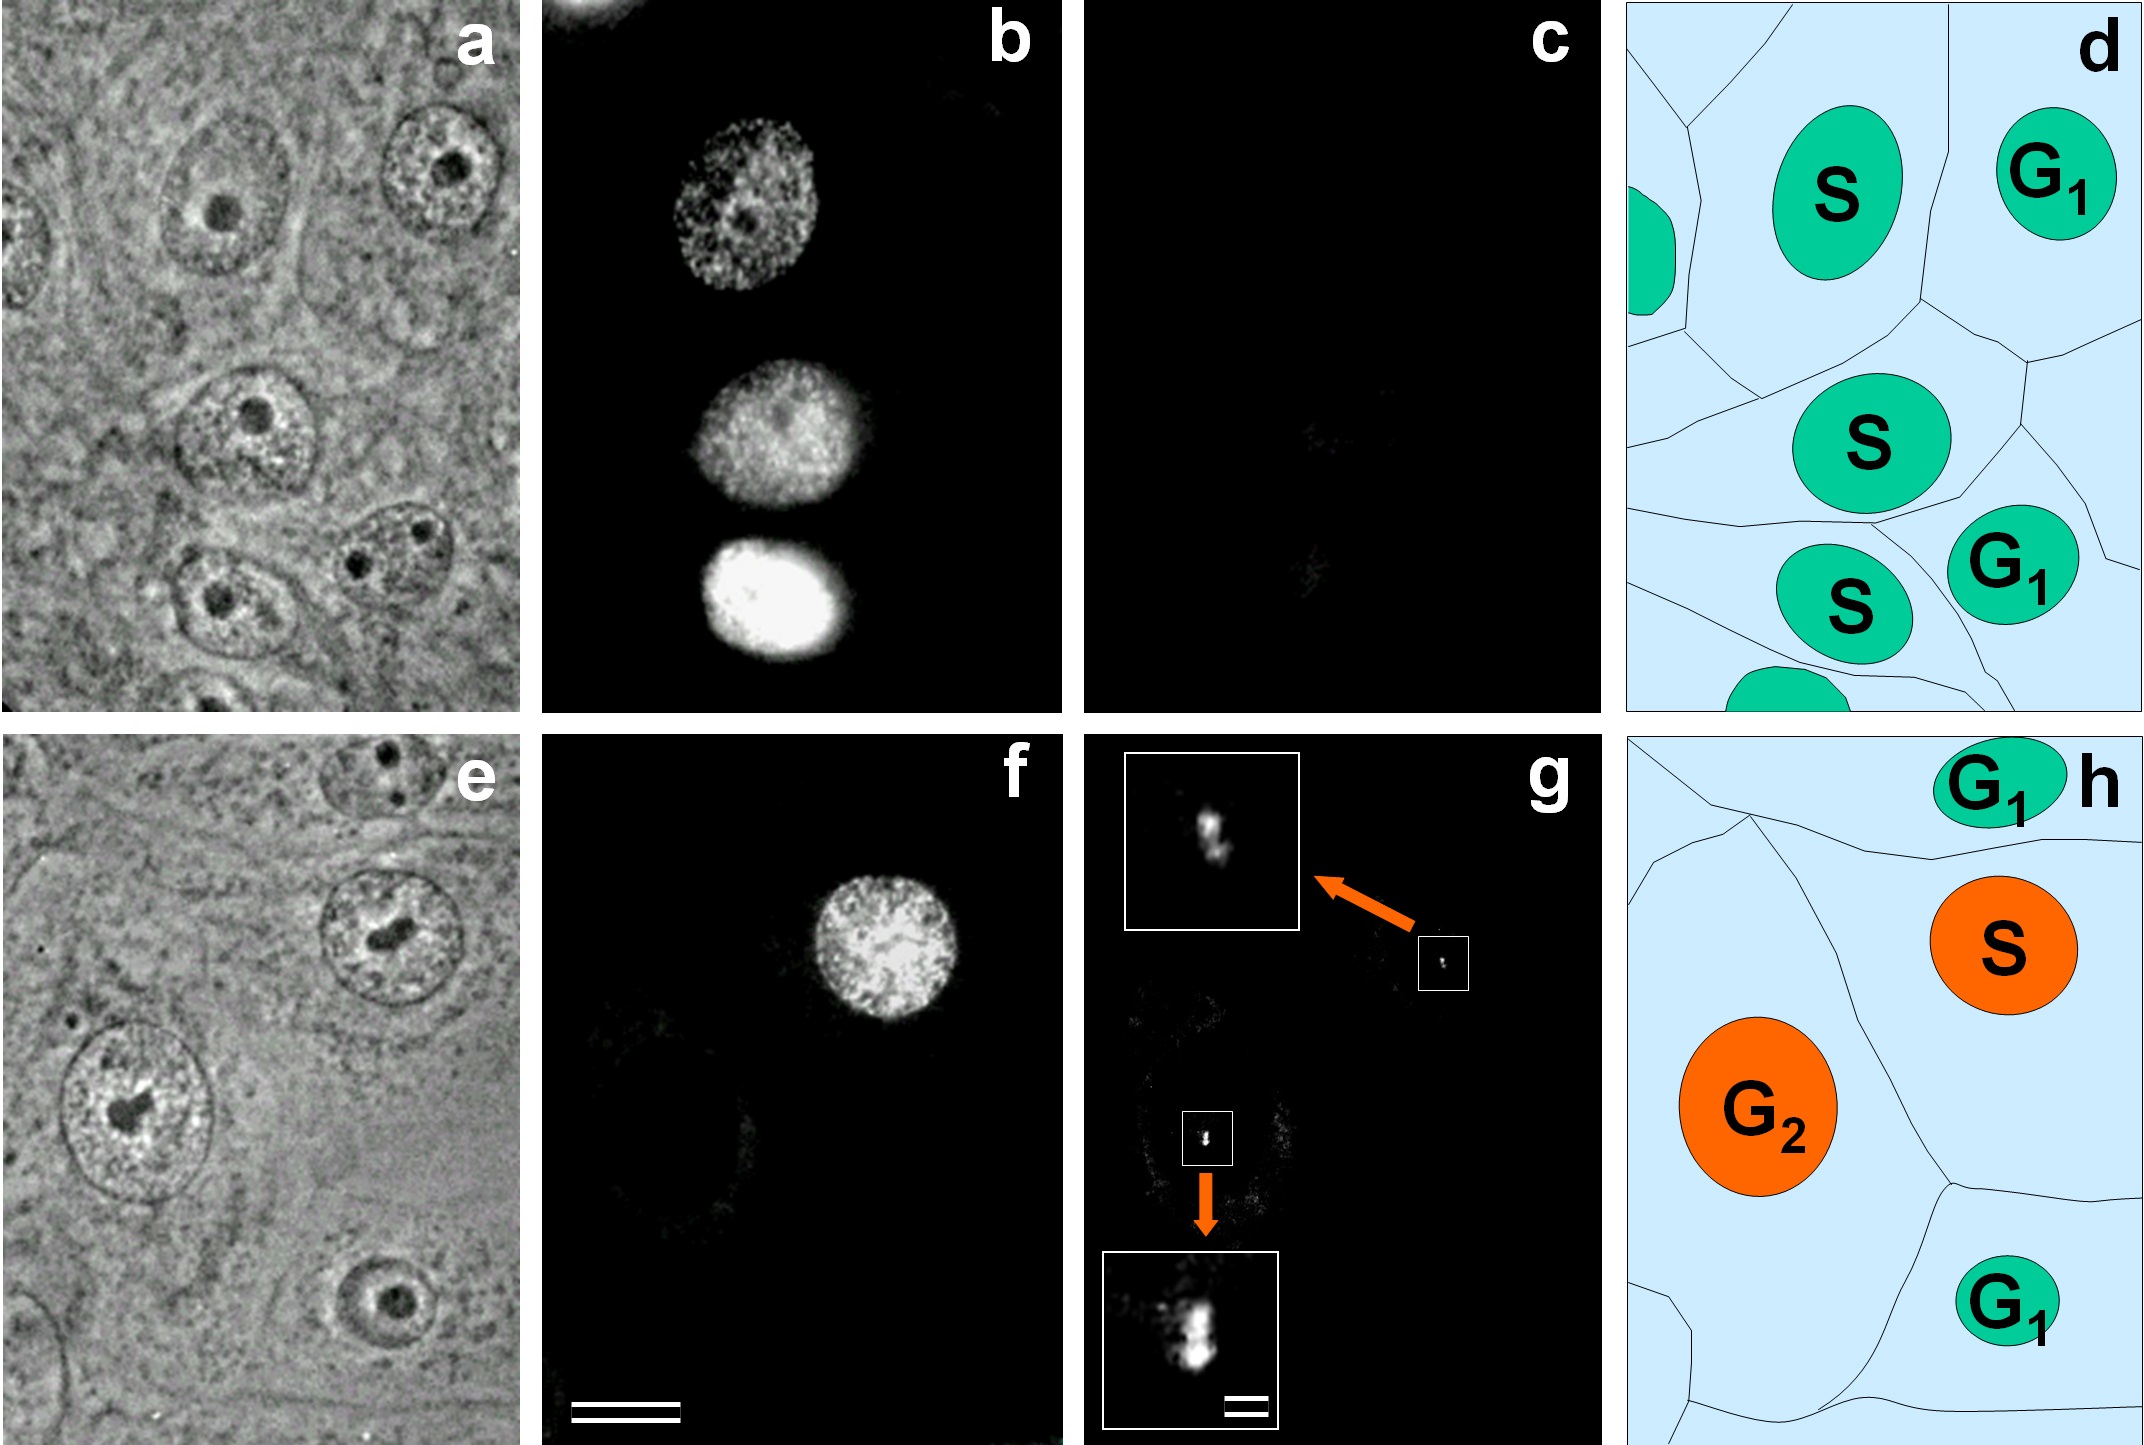
Recovery of Aurora A in the centrosome region in S-phase. Phase contrast (a,e) and immunofluorescent labeling with antibodies against Bromodeoxyuridine (BrdU) (b,f) or antibodies against Aurora A (c,g, and inserts). Inserts (in g) present enlarged centrosomal regions of Aurora A-positive cells. On schemes (d,h), nuclei of Aurora A-negative cells are shown in green, and nuclei of Aurora A-positive cells are shown in orange. Bar: 10 µm (a–h) and 1 µm (inserts in g).
According to these analyses, we concluded that (i) Aurora A can accumulate in the centrosome as early as the S-phase of the cell cycle, and (ii) 67.7% of G2-phase cells had Aurora A in the centrosome.
Together with the previous observations, our data indicated that the appearance of Aurora A in centrosomes triggers the onset of consequent centrosomal changes. This predicts that the centrosomal localization of Aurora A will precede centrosome separation. At the same time, it is known that cell cycles in sister cells are asynchronous as the G1-phase duration varies significantly in such cells. Therefore, the dynamics of Aurora A in sister centrosomes may be predicted to be asynchronous as well. Another possibility is that Aurora A accumulation in sister centrosomes follows the pace set by the previous cell cycle and thus is synchronous.
In fact, there are several examples of synchronous events in the newly emerged sister cells: cell flattening and spreading and the formation of nuclear envelopes and nucleoli [4]. Thus, we decided to estimate the relative timing of Aurora A localization to centrosomes and centrosome separation and the degree of synchronization between the centrosomal dynamics of Aurora A in sister cells.
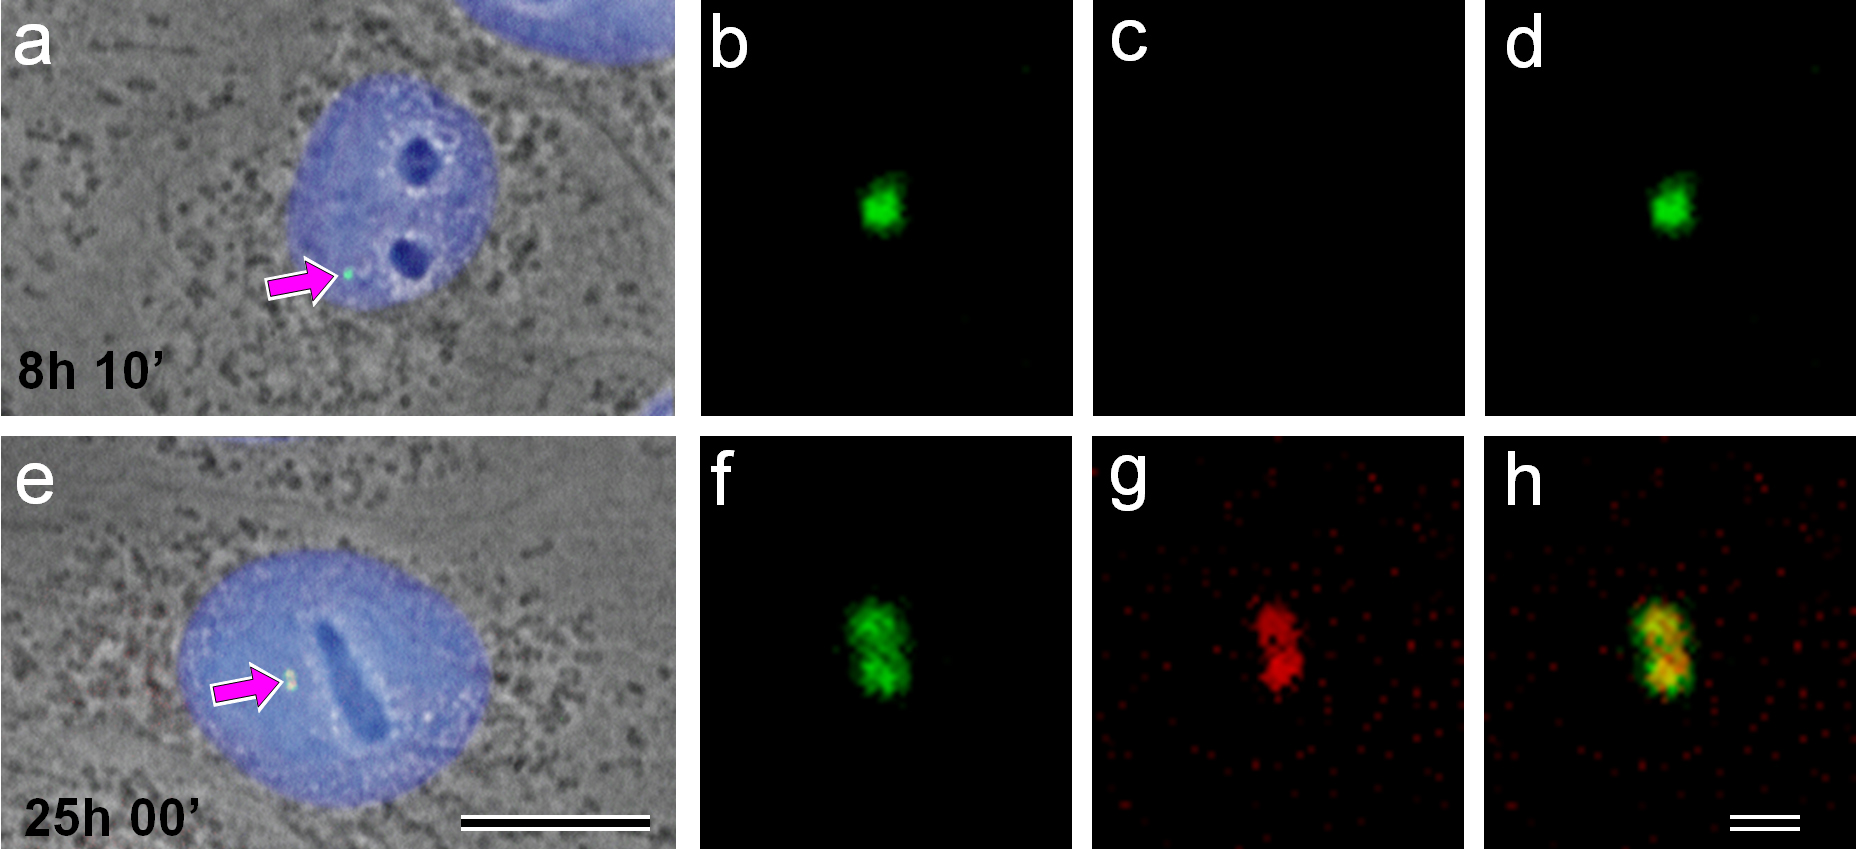
We monitored 176 cells from 5 min to 26 h 50 min after mitosis in two independent experiments. Double immunofluorescence using Aurora A and gamma-tubulin antibodies showed that Aurora A disappeared from the centrosome region approximately 1 h after mitosis and was not detected for the first half of the cell cycle (Fig. 4a–d). The centrosomes in “early” interphase cells, in G1-phase (Fig. 4a–d), were unduplicated and unseparated, and Aurora A was absent in the centrosome region of these cells. By contrast, in “late” interphase cells, in G2-phase, Aurora A was present on both parts of the duplicated centrosomes (Fig. 4e–h).
 Fig. 4.
Cells were monitored after mitosis to define exact cell cycle timing. Cells in the middle of the G1-phase (8 h 10 min after mitosis—(a–d)) and G2-phase (25 h after mitosis—(e–h)) are presented. (a,e) combined phase-contrast images/4′,6-Diamidino-2-Phenylindole (DAPI) labeling of DNA for nuclear localization/double immunofluorescent labeling using polyclonal antibodies against gamma-tubulin and monoclonal antibodies against Aurora A are presented; (b,f) enlarged centrosome regions of these two cells after anti-gamma-tubulin labeling; (c,g) after anti-Aurora A labeling and (d,h) overlapping gamma-tubulin and Aurora A are shown. Centrosome position in whole-cell images marked by arrows (a,e). Bar 10 µm (a,e) and 1 µm (b–d, f–h).
The analysis of Aurora A accumulation in the centrosome region of XL2 cells
during cell cycle progression is shown in Table 1. As was shown previously, the
duration of the cell cycle in XL2 cells was nearly 28 hours; however, its
calculation by different methods reported small fluctuations in the duration of
cell cycle phases [18, 19, 20, 21]. On average, the G1, S, and G2-phases lasted for 14
hours, 10.7 hours, and 2.5 hours, respectively, and mitosis took 0.9 hours. In
the G1-phase, all centrosomes were unseparated. Centrosomes with a detectable
amount of Aurora A were found in one-half of the cells within one hour after the
completion of mitosis. In agreement with the aforementioned experiments (Fig. 1,
Fig. 3c,g), later in G1, the centrosomes became Aurora A negative, 29.5% of
cells from cell cycle age from 14.0 h to 24.67 h after mitosis (this period
corresponded to S-phase cells) had Aurora A-positive centrosomes, and this value
is similar to the average data from two previous experiments (10.67 h
| Cell cycle phase, N = number of analyzed cells | Unseparated | Unseparated | Separated | Separated |
| Aurora A negative centrosomes, % (cells) | Aurora A positive centrosomes, % (cells) | Aurora A negative centrosomes, % (cells) | Aurora A positive centrosomes, % (cells) | |
| Early G1 ( |
50 (8) | 50 (8) | 0 (0) | 0 (0) |
| G1 (1–14 h after mitosis) N = 78 | 98.7 (77) | 1.3 (1) | 0 (0) | 0 (0) |
| S (14–24, 67 h after mitosis) N = 44 | 70.5 (31) | 18.2 (8) | 0 (0) | 11.4 (5) |
| G2 ( |
23.7 (9) | 47.4 (18) | 0 (0) | 28.9 (11) |
| Prophase of mitosis* N = 100 | 0 (0) | 6 (6) | 0 (0) | 94 (94) |
| Prometaphase of mitosis* N = 100 | 0 (0) | 1 (1) | 0 (0) | 99 (99) |
| Metaphase of mitosis* N =100 | 0 (0) | 0 (0) | 0 (0) | 100 (100) |
*Data from Uzbekov et al. [10], 2002.
We also compared Aurora A dynamics between sister cells. Aurora A accumulation in the centrosomes was asynchronous (Table 2). S-phase cells were only observed in 2 out of 11 pairs, and Aurora A was detected in the centrosomes of both sister cells. In 9 other pairs, only one sister cell had an Aurora A-positive centrosome.
| Cell cycle phase | Number of Aurora A positive cells | Sister Aurora A positive cells (%) | Sister cells Aurora A negative cells (%) |
|---|---|---|---|
| G1 (1–14 h after mitosis) | 1 | 0 (0) | 1 (100) |
| S (14–24, 67 h after mitosis) | 11 | 2 (18.2) | 9 (81.8) |
| G2 ( |
6 | 2 (33.3) | 4 (66.6) |
Many regulatory proteins are concentrated in the centrosome [27]. Several centrosome proteins are involved in cell cycle regulation, particularly in regulating the cell’s transition from interphase to mitosis by interacting with Aurora A kinase [8].
In particular, Cdc25B is localized to the centrosome during mitosis only after Ser353 phosphorylation by Aurora A [28]. After that, Cdc25 binds to and dephosphorylates centrosomal kinases Plk1 and Plk3 [29, 30, 31, 32].
Activation of the cyclin B1-Cdk1 complex in the centrosome also depends on the activity of Aurora A [8]. Another mitotic protein, Auba, which is also involved in activating Aurora A, accumulates in the centrosome in the G2-phase of the cell cycle [14]. The kinesin-related motor protein Eg5 accumulates in the centrosome region only after Aurora A kinase accumulates in the centrosome [17]. At the same time, the accumulation and association of Eg5 with MT depends on its phosphorylation by the cyclin B1-Cdk1 complex [33], the accumulation of which, as already noted, depends on Aurora A [8]. The appearance in the centrosome of Aurora A kinase cofactors as part of the regulatory complex with Plk1, such as Bora, Cep192, and Tpx2 [34, 35, 36], which are involved in the regulation of mitosis and spindle assembly, was also shown in mitotic cells only.
Thus, to date, no centrosome proteins associated with the regulation of G2/mitosis transition were detected; their appearance in the S-phase of the cell cycle should precede the accumulation of Aurora A in the centrosome. According to the present data, we hypothesized that Aurora A is currently the earliest centrosomal marker of the interphase/mitosis transition.
The cyclicity of the Aurora A protein level in the cell and its localization to the centrosome were shown in our previous studies [11, 13]. The activity of this kinase was already demonstrated in the G2-phase [14]. In this work, we analyzed the time of degradation of Aurora A kinase after mitosis and the time of its reappearance in the centrosome in more detail.
Our data clearly demonstrated that Aurora A had disappeared from the centrosome region during the first hour after mitosis. This was not due to the re-localization of Aurora A to other cell compartments but was mainly a result of the degradation of this protein [12, 13, 24]. The putative mechanism of this degradation was previously described [12].
According to our immunofluorescence data, the proportion of Aurora A-positive cells in S-phase increased more than 20 times compared to that of G1-phase cells, while the amount of Aurora A protein in fractions of synchronized cells increased approximately three times from G1 to S [18]. This indicates that the newly synthesized Aurora A migrates rapidly to the centrosome. This is not so for the major centrosomal proteins such as gamma-tubulin [37] or centrin [38]. At the same, some G2-phase cells had no Aurora A labeling in the centrosome. Thus, although it was obvious that during the transition from S-phase to G2-phase or from G2-phase to mitosis, the percentage of cells with Aurora A-positive centrosomes had increased, the accumulation of this kinase and thus a progression of all the processes related to mitosis preparation could occur in the cells over a wide range of cell cycle age.
Comparative analysis of the nuclear size, which is a parameter directly dependent on the process of DNA replication, and the accumulation of Aurora A kinase to the centrosome showed no strict correlation between these events. Thus, the process of separation of centrosomes before mitosis, regulated by Aurora A kinase, is not directly associated with the transition of the cell from the S-phase of the cell cycle to the G2-phase.
This observation was directly confirmed by experiments observing living cells with a defined cell cycle age. In some cells in the G2-phase, there was no accumulation of Aurora A kinase in the centrosome, whereas some S-phase cells had already accumulated Aurora A kinase in their centrosome.
A comparison of nuclei sizes in cells with Aurora A-positive centrosomes showed that cells with uncleaved centrosomes and cells in which centrosomes had already begun to separate did not show significant differences in the sizes of the nuclei.
All these showed that in contrast to the accumulation of Aurora A in the centrosome, which can start in the S-phase, the process of centrosome separation begins after the end of nuclear growth, which occurs after the end of DNA replication in the G2-phase of the cell cycle.
Aurora A kinase can accumulate in the centrosome region before the end of DNA replication and significantly later at the end of this process in the nucleus. Thus, precise coordination of centrosomal Aurora A accumulation and nuclear events during the S and G2 phases was not observed. This was in contrast to the strict correlation between Aurora A accumulation and the following centrosomal dynamics.
Indeed, one of the functions of Aurora A is the regulation of centrosome separation [9, 17]. Our work showed that the centrosome separation process starts after the appearance of Aurora A in the centrosome with a considerable delay, which can last for several hours.
Interestingly, in our observations, we have never found Aurora A-positive cells before centrosome duplication, which starts from the beginning of procentriole formation during the second half of the G1-phase [39, 40]. Thus, centriole duplication is a crucial starting point for Aurora A accumulation in the centrosome. This observation allowed speculation that the Aurora dependence of centrosome separation ensures that mitotic spindle construction does not occur before centriole duplication.
Apparently, the general regulation of the cell cycle also controls the centrosomal cycle. Is there reverse regulation? In cell culture, each division produces two genetically identical sister cells. However, the centrosomes in the two daughter cells are not identical. The mother centriole in one of them is at least one cell cycle “older” than the mother centriole in the second sister cell. Thus, despite the identity of genetic material obtained as a result of mitosis, there could be a centrosome-based reason for differences in cell cycle progression between two sister cells. In other words, it can be expected that cells with centrosomes of “different ages” would have different rates of cell cycle progression.
Dissimilarity in the functional activity of two centrosomes in sister cells was also shown for the timing of primary cilia formation: in the sister cell with a more mature mother centriole, the primary cilium formed earlier than in the other sister cell [41].
In agreement with this, we have demonstrated that the accumulation of Aurora A in the centrosome was not synchronous in the sister cells. As already noted, the process of centrosome separation before mitosis is tightly correlated with the presence of Aurora A. The question arises as to whether the process of centrosome separation in sister cells is also asynchronous. Our data showed that when one of the sister cells had already accumulated Aurora A in the centrosome and had started centrosome separation, another one was often still Aurora A negative, and the centrosomes were still unseparated. Therefore, the centrosome separation process was also asynchronous in two sister cells.
Various cell lines differ significantly in the proportion of separated interphase centrosomes [42, 43]. The XL2 cell line is in the intermediate group according to this parameter. In contrast to this cell line, in HeLa cells, the proportion of separated centrosomes in interphase cells is only 4%, while in primary rat fibroblasts, it reaches 45% [42, 43]. In further studies, it would be interesting to determine the time at which Aurora A kinase accumulates in cell lines with a high proportion of separated centrosomes. It should be taken into account that along with the separation of newly formed centrosomes before mitosis, there is also separation, and in some cases, migration for a considerable distance, of the centrioles in the G1-phase of the cell cycle before their duplication begins [44]. As shown here, in the XL2 cell line, such centriole divergence is an extremely rare event (as Aurora A-negative cells with separated centrioles/centrosomes). However, in other cell lines, the rate of such “premature” centriole separation may be more pronounced, and thus the accumulation of Aurora A in the second half of the cell cycle occurs in already separated centrosomes. The centrosome localization of partner proteins that appear later in the cell cycle has already been shown. Likely, future studies will identify new partners of Aurora A, the appearance of which will precede that of Aurora A and probably contribute to the accumulation of this fundamental regulator of cell and centriolar cycles in the centrosome. The identification of new signaling pathways involving centrosomal proteins allows us to state that there is a “command center of cellular regulation” in the centrosome [45] or, in other words, the centrosome is an “intracellular processor” [46], and Aurora A kinase is one of its key elements.
In summary, in XL2 cells Aurora A kinase disappears from the centrosome during the first hour after mitosis and reappears in the S-phase of the cell cycle—earlier than was reported for all other proteins involved in the regulation of mitotic events. Aurora A disappeared from the centrosome simultaneously in both sister cells; however, its appearance was asynchronous. The centrosome separation was observed almost exclusively in Aurora A- positive cells, but this separation did not begin immediately after the appearance of this protein in the centrosome but much later. The appearance of Aurora A in some cells in the S-phase before DNA replication completion and the beginning of centrosome separation in these cells directly indicate that the processes of DNA replication and centrosome separation, preparing the cell for the formation of two poles of the mitotic spindle, are not uniquely interdependent and occur in parallel, varying over a fairly broad period. Also, the appearance of Aurora A in the centrosome and centrosome separation occur asynchronously in sister cells, which may indicate that the cell cycle duration in a sister cell with a more mature mother centriole differs from that of another sister cell. The reported data confirmed the participation of Aurora A in the regulation of centrosome separation and mitotic spindle construction and placed this protein as one of the primary links between these processes.
All data points generated or analyzed during this study are included in this article and there are no further underlying data necessary to reproduce the results. The original data used and/or analyzed during the current study are available from the corresponding author on reasonable request.
RU, CP, YAB—conception and work management; RU, SU, YAB—conducting experiments; RU, SU, FS, CP, YAB—discussion of the results of the study; RU, SU, FS, CP, YAB—writing the text; RU, SU, FS, CP, YAB—editing the text of the article. All authors read and approved the final manuscript. All authors have participated sufficiently in the work to take public responsibility for appropriate portions of the content and agreed to be accountable for all aspects of the work in ensuring that questions related to its accuracy or integrity.
Not applicable.
We would like to thank IBiSA Electron Microscopy Facility of University of Tours and University Hospital of Tours.
This research received no external funding.
The authors declare no conflict of interest. Given his role as guest editor, Rustem Uzbekov was not involved in the review of this article and do not have access to information relevant to its review. Full responsibility for the editorial process of this article has been delegated to Dorota Włoga.
Supplementary material associated with this article can be found, in the online version, at https://doi.org/10.31083/j.fbl2909317.
References
Publisher’s Note: IMR Press stays neutral with regard to jurisdictional claims in published maps and institutional affiliations.