


 , Nguyen Thi Xuan 3,*
1 Oncology Center, 103 Military Hospital, Vietnam Military Medical University, Ha Dong, 151530 Hanoi, Vietnam
2 Radiology Center, 103 Military Hospital, Vietnam Military Medical University, Ha Dong, 151530 Hanoi, Vietnam
3 Institute of Genome Research, Vietnam Academy of Science and Technology, Cau Giay, 122300 Hanoi, Vietnam
4 Institute of Biotechnology, Vietnam Academy of Science and Technology, Cau Giay, 122300 Hanoi, Vietnam
5 Department of Pathophysiology, Vietnam Military Medical University, Ha Dong, 151530 Hanoi, Vietnam
†These authors contributed equally.
Abstract
Background: Prostate cancer (PCa) is one of the most common malignant
tumors of the male urinary system, and its incidence and mortality rates have
been increasing worldwide. Benign prostatic hyperplasia (BPH) represents stromal
and epithelial cell proliferation in the prostate in elderly males. Abnormal
activation of inflammation-related signalling molecules, such as toll-like
receptor 4 (TLR4) and Janus kinase/signal transducers and activators of
transcription (JAK/STAT) has been linked to the initiation and progression of
various human diseases including PCa and BPH. Cylindromatosis (CYLD)
gene alterations are associated with PCa progression. In this study, the
contribution of CYLD, JAK2, and TLR4 gene variants to
PCa and BPH risks and their associations with prostate-specific antigen (PSA)
levels, immunophenotype, and clinical features in Vietnamese men were determined.
Methods: A total of 102 patients with PCa, 65 with BPH, and 114 healthy
controls were enrolled. The immunophenotype was analyzed by flow cytometry,
cytokine secretion by enzyme-linked
immunosorbent assay (ELISA), and gene variants by DNA sequencing.
Results: Lower levels of transforming growth factor
Keywords
- benign prostatic hyperplasia
- CYLD
- JAK2
- TLR4
- prostate cancer
Prostate cancer (PCa) is one of the most common malignant tumors of the male urinary system, and its incidence and mortality rates have increased considerably in recent years [1]. The etiology and pathogenesis of PCa remain unclear, although several factors such as age, family history, ethnicity, and dietary and genetic mutations are known to be related to PCa risk [2]. Classifications based on clinicopathological features, such as prostate cancer-specific antigen, Gleason score, and tumor, node and metastasis (TNM) system, are considered as the accepted practice standards for determining tumor stage for PCa [3]. Unlike PCa, benign prostatic hyperplasia (BPH) is characterized by stromal and epithelial cell proliferation in the prostate in elderly males. Prostate inflammation is responsible for the development of BPH [4] and linked to the pathogenesis with PCa pathogenesis [5]. The inflammatory response in these patients is characterized by the accumulation of immune cells, mainly T and B cells, and macrophages into the prostate tissue, and their activation results in the release of inflammatory cytokines [4, 5, 6]. Prostate-specific antigen (PSA), a glucoproteinase produced by both normal and malignant cells of the prostate gland, is a useful serum biomarker for diagnosing and controlling PCa [2]. Increased PSA levels can indicate reliable sign of prostate cancer aggressivity [7]. In addition, the inflammatory cytokine interleukin 6 (IL-6) secreted by immune cells is known to promote the release of PSA in PCa patients [6].
Prostate cancer patients have elevated numbers of peripheral circulation regulatory (Treg) T [8] and myeloid-derived cells, which are linked to poor outcome in PCa [9]. Among myeloid-related markers, CD13 and C-kit receptor (CD117) play key roles in normal hematopoiesis and are detectable in neoplastic human tissues and at sites of prostate [10, 11, 12]. The CD13/Aminopeptidase N membrane metallopeptidase participates in negatively regulating several signalling molecules, such as the toll-like receptor (TLR) 4 and Janus kinase/signal transducers and activators of transcription (JAK/STAT) [13].
Moreover, immunological investigations have indicated that abnormal expression
of TLR4 and JAK/STAT pathways is linked to tumor development, cell migration,
immune invasion, and progression of various human diseases, including PCa and BPH
[14, 15]. TLR4 activation is triggered by bacterial lipopolysaccharide to elicit
an inflammatory response in immune cells [16], and its levels are upregulated in
PCa [14]. TLR4 deficient mice fail to respond to viral and bacterial
infection [17]. Several investigations have indicated that polymorphisms within
the TLR4 gene are associated with PCa [14, 16]. The TLR4 c.1063
A
The association between CYLD variants and the risk of PCa and BPH is not well known, although its expression levels regulate PCa progression [20]. CYLD is a deubiquitinating enzyme that functions as a negative regulator of immune reactions and tumor cell proliferation in PCa [21]. CYLD is known to inhibit the survival, glucose uptake, and growth of prostate tumors [22]. Mutations in CYLD lead to cyclindroma disease and myeloma [23].
In this study, we determined the contribution of CYLD, JAK2, and TLR4 gene variants to PCa and BPH risk and their associations with PSA levels, immunophenotype, and clinicopathological features in Vietnamese men.
Fresh peripheral blood samples were collected from untreated 102 prostate cancer patients and 65 prostatic hyperplasia patients at the National Institute of Hematology and Blood Transfusion, 103 and K Hospitals, Ha Noi, Vietnam. None of the patients had received prior hormonal therapy or radiotherapy. Prostate tumors were staged using the American Joint Committee on Cancer (AJCC) tumor-node-metastasis (TNM) staging system and graded using the Gleason score [3]. The control group consisted of 114 healthy individuals. No individuals in the control population took any medication or suffered from any known acute or chronic diseases. All patients and volunteers gave written consent to participate in the study. Person care and experimental procedures were performed according to the Vietnamese law for the welfare of humans and were approved by the Research Ethics Committee, Military Hospital 103, no. 86/CNChT-HDDD.
Genomic DNA was isolated from peripheral blood samples using a DNeasy Blood and
Tissue Kit (Qiagen, Hilden, Germany). To determine polymorphisms of the
CYLD, JAK2, and TLR4 genes, polymerase chain reaction (PCR) and
DNA sequencing were performed as previously described [24]. GenBank accession
numbers NM_001270508.2, NM_004972.4, and NM_138554.5 were used for DNA
sequence analysis of CYLD, JAK2, and TLR4 genes, respectively,
using the following primers: CYLD -F: 5
Whole blood samples from PCa and BPH patients and healthy donors were collected by venipuncture and transferred to sterile tubes containing Ethylenediaminetetraacetic acid (EDTA) as an anticoagulant. Peripheral blood mononuclear cells (PBMCs) were isolated by Ficoll density gradient centrifugation (Ficoll-Paque Plus, GE Healthcare, Chicago, IL, USA). The cells were then counted in a Neubauer chamber, washed with PBS, and analyzed for further experiments.
Cytokine quantification (transforming growth factor beta (TGF-
All flow cytometry data acquisition was conducted using the instrument software FACSAria Fusion (BD Biosciences, San Jose, CA, USA) as previously described [25]. Immunostaining was performed using antibodies against CD45, CD3, CD4, CD13, CD25, CD40, CD56, CD117, and FoxP3 (all from eBioscience, Waltham, MA, USA) at a concentration of 10 µg/mL. After incubation with the antibodies for 60 min at 4 °C, the cells were determined by flow cytometry (BD FACSLyric, BD Biosciences, San Jose, CA, USA).
CYLD, JAK2, and TLR4 gene variants were named based on the nucleotide reference sequence (https://www.ncbi.nlm.nih.gov/snp/). BioEdit software (version 7.2.5, MA, USA, https://bioedit.software.informer.com/7.2/) was used for initial sequence analysis.
The genotype frequencies among PCa and BPH patients and the control group were
calculated using Fisher’s exact test. Statistical analyses were performed using
SPSS (version 24, IBM Corp, Armonk, NY, USA) and GraphPad Prism (Version 8.4.2,
GraphPad Software, LLC, Boston, MA, USA). Statistical significance of the
differences was determined using the Mann–Whitney U test. For all statistical
analyses, the level of significance was set at p
A total of 102 patients with PCa and 65 patients with BPH were enrolled, and the
clinical characteristics of the study subjects are summarized in Table 1. The
mean ages of patients with PCa and BPH were 69.11 and 69.87 years, respectively.
A comprehensive correlation analysis showed that both patient groups had higher
glucose levels than normal values. Moreover, urea levels were higher, whereas
hemoglobin levels were lower in PCa patients than in BPH patients. Importantly,
TGF-
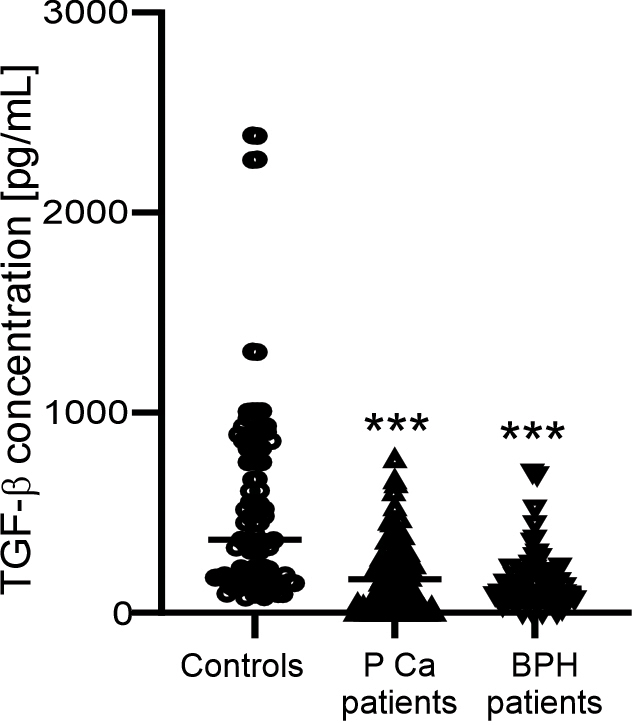 Fig. 1.
TGF-
| Characteristics | Normal range | Cases | |||
| Prostate cancer (n = 102) | BPH (n = 65) | p-value | |||
| Age (years) | 69.11 (42–85) | 69.87 (55–99) | 0.57 | ||
| Urea (mmol/L) | 3.3–6.6 | 6.64 |
6.01 |
0.04 | |
| Glucose (mmol/L) | 3.9–5.6 | 5.99 |
6.37 |
0.125 | |
| Creatinine (µmol/L) | 50–110 | 93.86 |
94.13 |
0.92 | |
| AST (GOT) (U/L) | 5–40 | 29.78 |
29.99 |
0.946 | |
| ALT (GPT) (U/L) | 7–55 | 28.25 |
27.52 |
0.818 | |
| Erythrocytes (10 |
3.8–5.9 | 4.53 |
4.64 |
0.275 | |
| Hemoglobin (g/L) | 130–180 | 131.1 |
140.88 |
0.0003 | |
| WBC (10 |
3.5–10.5 | 8.14 |
7.97 |
0.673 | |
| Plalete (10 |
150–450 | 279.6 |
261.6 |
0.239 | |
| TGF- |
559.52 | 183.14 |
157.62 |
0.31 | |
| PSA value at diagnosis, ng/mL, n (%) | |||||
| 0 (0%) | 20 (30.77%) | ||||
| 4–20 | 6 (5.88%) | 28 (43.08%) | |||
| 34 (33.33%) | 17 (26.15%) | ||||
| 62 (60.79%) | 0 (0%) | ||||
| Gleason score, n (%) | |||||
| 7 | 18 (17.65%) | ||||
| 8 | 31 (30.39%) | ||||
| 53 (51.96%) | |||||
| Clinical stage, n (%) | |||||
| Distant metastasis stage | |||||
| No distant metastasis (M0) | 30 (29.41%) | ||||
| Distant metastasis (M1) | 72 (70.59%) | ||||
| Nodal stage | |||||
| No lymph node metastasis (N0) | 28 (27.45%) | ||||
| Lymph node metastasis (N1) | 71 (69.61%) | ||||
| Unknown | 3 (2.94%) | ||||
| Tumor stage, n (%) | |||||
| Localized (T1+T2) | 10 (9.8%) | ||||
| Locally advanced ( |
58 (56.86%) | ||||
| Advanced ( |
30 (29.42%) | ||||
| Unknown | 4 (3.92%) | ||||
ALT, alanine aminotransferase; AST, aspartate transaminase; PSA, prostate
specific antigen; TGF, transforming growth factor; WBC, white blood cell; BPH,
benign prostatic hyperplasia. p
The frequencies of all important clinical parameters, including PSA level at the
time of diagnosis, Gleason score, and TNM staging, are detailed in Table 1. All
patients with PCa (100%) presented with PSA values
Next, changes in the expression of CD4 T, regulatory T (Treg), NK, and
CD13
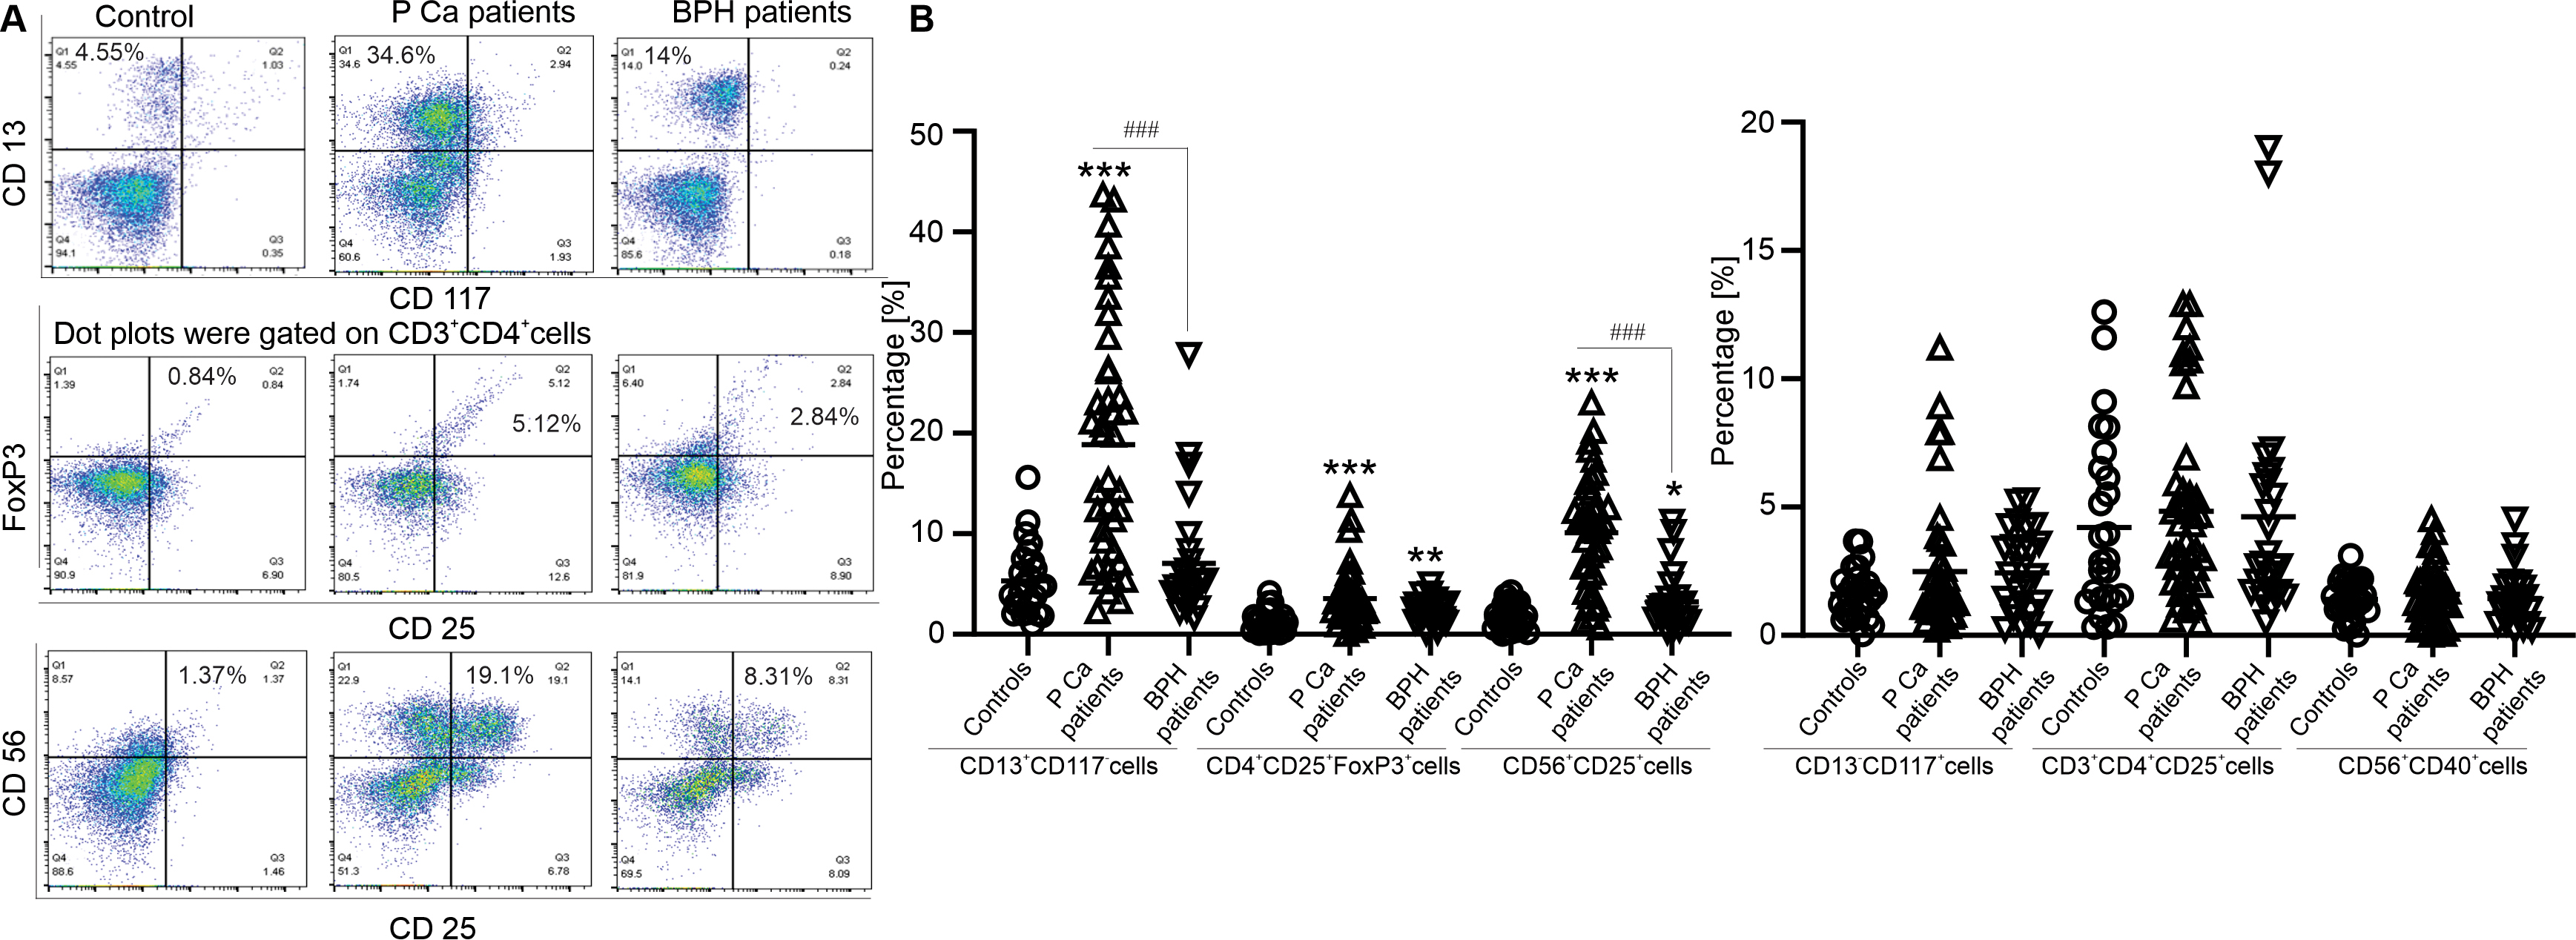 Fig. 2.
Immunophenotyping of prostate cancer and hyperplasia patients.
(A) Representative dot plots of CD13
Sequencing of the CYLD gene identified a p.Q732R (c.2436 A
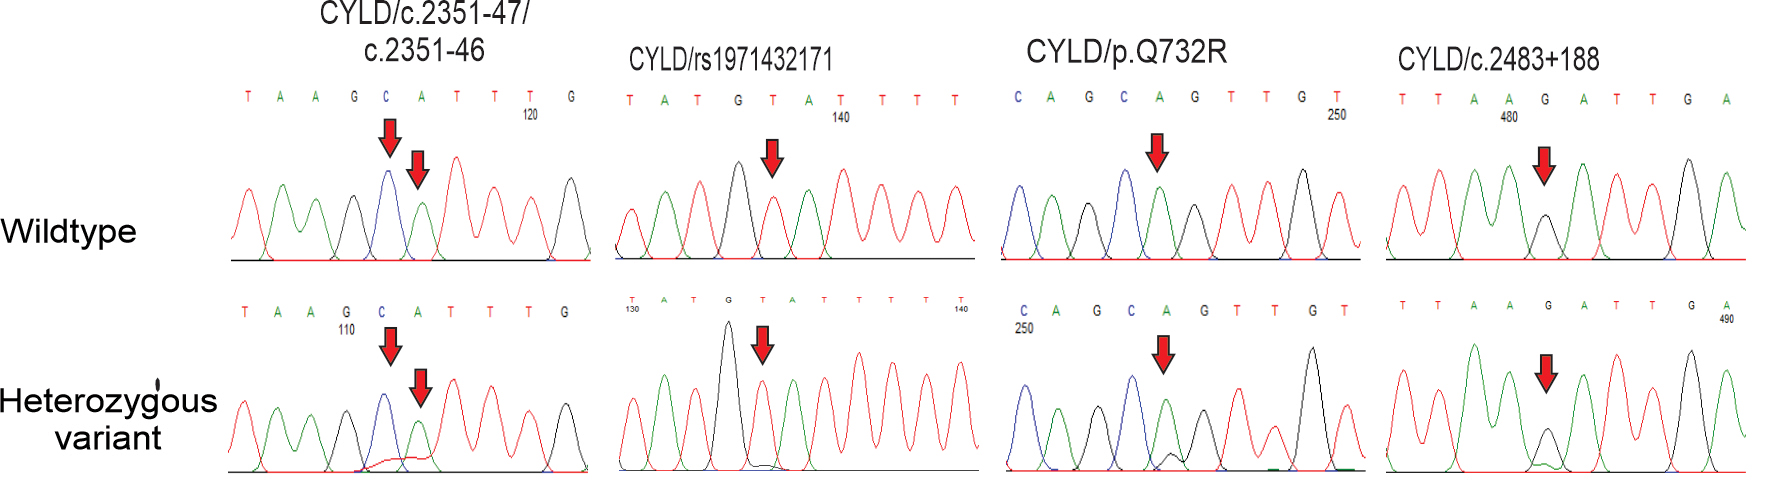 Fig. 3.
Variants of CYLD gene in prostate cancer and hyperplasia patients. DNA sequencing chromatograms of CYLD gene from wildtype (1st panels) and variant (2nd panels) genotypes of c.2351-47, c.2351-46, rs1971432171, p.Q732R and c.2483+188 polymorphisms are indicated. Arrows indicate the location of the base changes.
| SNPs | Gene | Test model | Controls (n = 114) | Prostatic cancer | Prostatic hyperplasia | |||
| Cases (n = 102) | p-value to controls | Cases (n = 65) | p-value to controls | p-value to prostatic cancer patients | ||||
| c.2351-47 | CYLD | CC | 114 (100%) | 85 (83.33%) | 61 (93.85%) | |||
| CT | 0 (0%) | 17 (16.67%) | 4 (6.15%) | 0.029 | 0.025 | |||
| c.2351-46 | CYLD | AA | 114 (100%) | 96 (94.12%) | 65 (100%) | |||
| AT | 0 (0%) | 6 (5.88%) | 0.029 | 0 (0%) | NC | 0.029 | ||
| rs1971432171 | CYLD | TT | 114 (100%) | 94 (92.16%) | 65 (100%) | |||
| TG | 0 (0%) | 8 (7.84%) | 0.007 | 0 (0%) | NC | 0.007 | ||
| p.Q732R | CYLD | AA | 114 (100%) | 99 (97.06%) | 65 (100%) | |||
| AG | 0 (0%) | 3 (2.94%) | 0.246 | 0 (0%) | NC | 0.246 | ||
| c.2483+188 | CYLD | GG | 64 (56.14%) | 84 (82.35%) | 62 (95.39%) | |||
| GC | 50 (43.86%) | 18 (17.65%) | 3 (4.61%) | 0.007 | ||||
| rs994555780 | JAK2 | TT | 113 (99.12%) | 101 (99.02%) | 65 (100%) | |||
| TC | 1 (0.88%) | 1 (0.99%) | 1 | 0 (0%) | 1 | NC | ||
| rs4495487 | JAK2 | TT | 51 (44.74%) | 49 (43.13%) | 30 (46.15%) | |||
| TC | 47 (41.22%) | 44 (43.14%) | 0.879 | 27 (41.54%) | 1 | 0.88 | ||
| CC | 16 (14.04%) | 9 (8.82%) | 0.485 | 8 (12.31%) | 0.825 | 0.809 | ||
| rs10974947 | JAK2 | GG | 69 (60.53%) | 65 (63.73%) | 43 (66.15%) | |||
| GA | 42 (36.84%) | 27 (26.47%) | 0.218 | 19 (29.23%) | 0.363 | 0.873 | ||
| AA | 3 (2.63%) | 10 (9.8%) | 0.088 | 3 (4.62%) | 0.721 | 0.277 | ||
| TLR4/rs2149356 | TLR4 | TT | 39 (34.2%) | 15 (14.71%) | 9 (13.85%) | |||
| TG | 30 (26.3%) | 44 (43.13%) | 0.001 | 25 (38.46%) | 0.002 | 1 | ||
| GG | 45 (39.5%) | 43 (43.16%) | 0.019 | 31 (47.69%) | 0.007 | 0.831 | ||
| TG+GG | 75 (65.8%) | 87 (85.29%) | 0.003 | 56 (86.15%) | 0.001 | 1 | ||
| TLR4/c.331-337 | TLR4 | AA | 111 (97.37%) | 94 (92.16%) | 59 (90.77%) | |||
| AG | 3 (2.63%) | 8 (7.84%) | 0.213 | 6 (9.23%) | 0.134 | 1 | ||
| TLR4/rs911685299 | TLR4 | AA | 112 (98.25%) | 96 (94.12%) | 64 (98.46%) | |||
| AG | 2 (1.75%) | 6 (5.88%) | 0.279 | 1 (1.54%) | 1 | 0.279 | ||
| TLR4/c.331-206 | TLR4 | AA | 107 (94.02%) | 102 (100%) | 62 (95.38%) | |||
| AG | 7 (5.98%) | 0 (0%) | 0.029 | 3 (4.62%) | 1 | 0.059 | ||
| TLR4/c.331-180 | TLR4 | TT | 114 (100%) | 100 (98.04%) | 64 (98.46%) | |||
| TA | 0 (0%) | 2 (1.96%) | 0.497 | 1 (1.54%) | 0.497 | 1 | ||
Statistically significant results were represented in bold style. NC, not calculated for sparse data. SNPs, single nucleotide polymorphisms; TLR, Toll-like receptor.
| Gene/SNP | Type of Variant | Allele | MAF | HWE (p-value) | |||||
| Controls | Prostate cancer | Prostatic hyperplasia | Controls | Prostate cancer | Prostatic hyperplasia | All population | |||
| CYLD/c.2351-47 | Intron | C |
0.0000 | 0.0147 | 0.0308 | N/A | 0.6561 | 0.9678 | 0.8092 |
| CYLD/c.2351-46 | Intron | A |
0.0000 | 0.0294 | 0.0000 | N/A | 0.9542 | N/A | 0.9838 |
| CYLD/rs1971432171 | Intron | T |
0.0000 | 0.0392 | 0.0000 | N/A | 0.9186 | N/A | 0.9711 |
| CYLD/p.Q732R | Missense | A |
0.0000 | 0.0147 | 0.0000 | N/A | 0.9887 | N/A | 0.9960 |
| CYLD/c.2483+188 | Intron | G |
0.2193 | 0.0882 | 0.0231 | 0.0111 | 0.6202 | 0.9820 | 0.0530 |
| JAK2/rs994555780 | Intron | T |
0.0088 | 0.0049 | 0.0000 | 0.9989 | 0.0025 | N/A | 0.9960 |
| JAK2/rs4495487 | Intron | T |
0.3465 | 0.3039 | 0.3308 | 0.6326 | 0.9807 | 0.8835 | 0.7378 |
| JAK2/rs10974947 | Intron | G |
0.2105 | 0.2304 | 0.1923 | 0.5122 | 0.0377 | 0.8929 | 0.5265 |
| TLR4/rs2149356 | Intron | T |
0.5263 | 0.6806 | 0.6692 | 0.0000 | 0.7957 | 0.9833 | 0.0000 |
| TLR4/c.331-337 | Intron | A |
0.0132 | 0.0392 | 0.0462 | 0.9899 | 0.9899 | 0.1522 | 0.8722 |
| TLR4/rs911685299 | Intron | A |
0.0088 | 0.0294 | 0.0077 | 0.9956 | 0.9542 | 0.9981 | 0.9635 |
| TLR4/c.331-206 | Intron | A |
0.0307 | 0.0000 | 0.0231 | 0.9444 | 0.0000 | 0.9820 | 0.9549 |
| TLR4/c.331-180 | Intron | T |
0.0000 | 0.0099 | 0.0077 | N/A | 0.9950 | 0.9981 | 0.9960 |
Position refers to the GRCh38.p10 assembly; MAF, Minor allele frequency; HWE, Hardy-Weinberg equilibrium was checked by Chi-squared test; N/A, Not available.
Next, sequencing of JAK2 identified three nucleotide changes, including
rs994555780 T
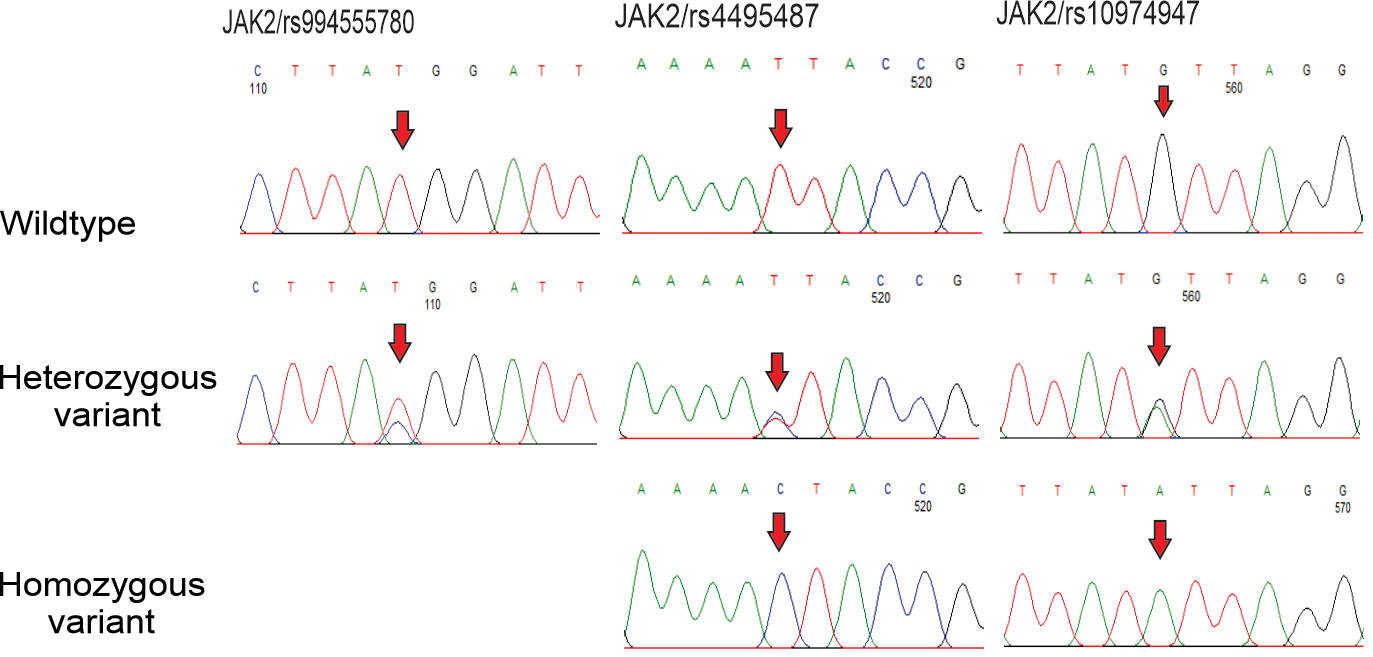 Fig. 4.
Polymorphisms of JAK2 gene in prostate cancer and hyperplasia patients. DNA sequencing chromatograms of JAK2 gene from wildtype (1st panels) and variant (2nd and 3rd panels) genotypes of rs994555780, rs4495487 and rs10974947 SNPs are shown. Arrows indicate the location of the base changes.
Sequencing of TLR4 identified five nucleotide changes, including
rs2149356 T
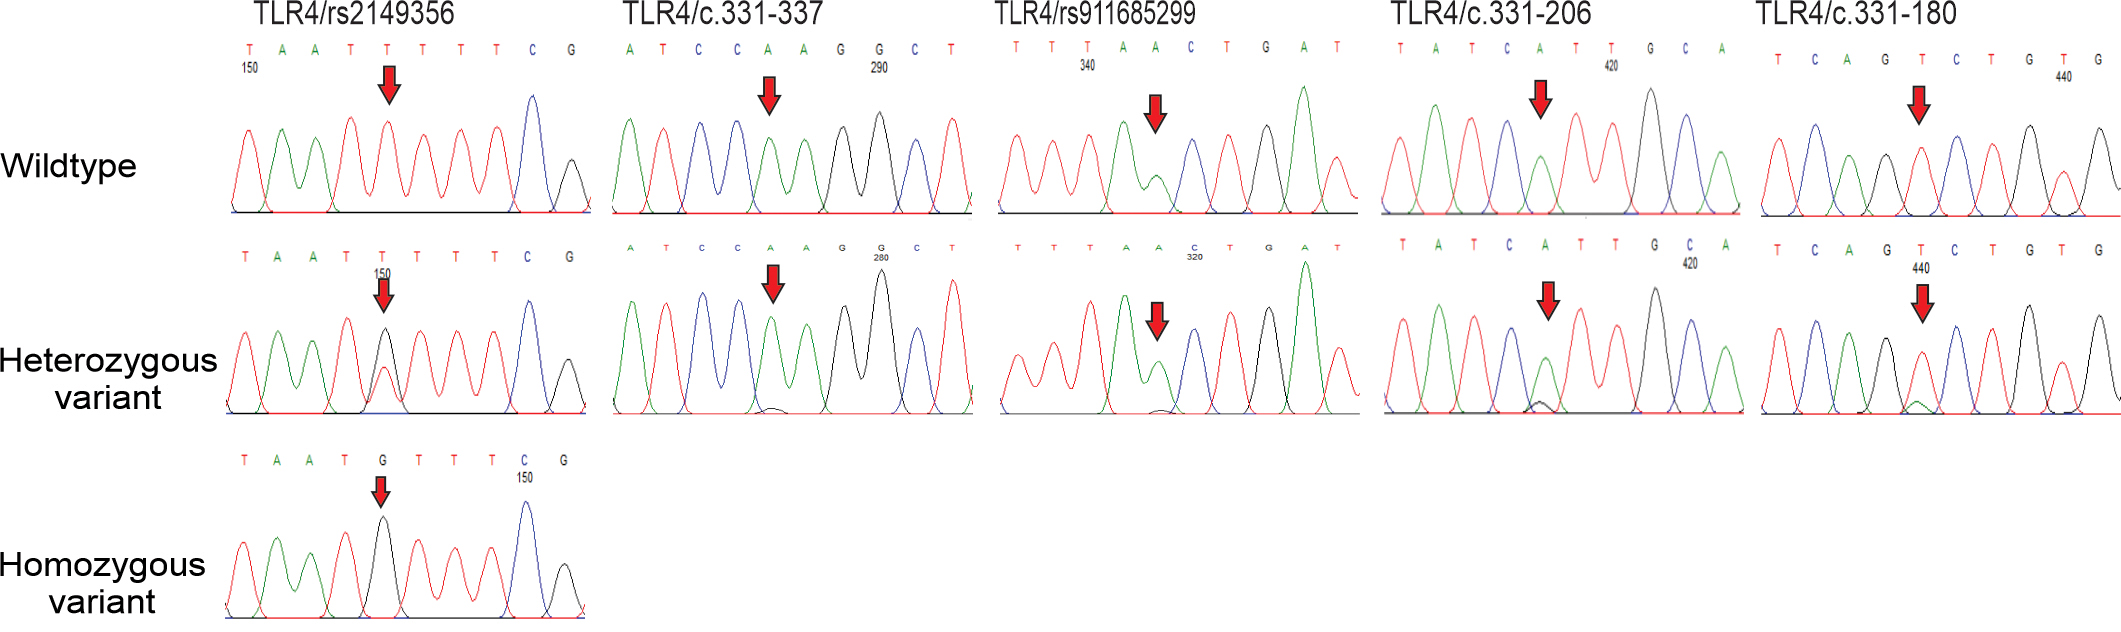 Fig. 5.
Polymorphisms of TLR4 gene in prostate cancer and hyperplasia patients. Partial sequence chromatograms of TLR4 gene from wildtype (1st panels) and variant (2nd and 3rd panels) genotypes of rs2149356, c.331-337, rs911685299, c.331-206 and c.331-180 polymorphisms are shown. Arrows indicate the location of the base changes.
Association analysis of the CYLD, JAK2, and TLR4
genes with immunophenotype indicated that the numbers of activated NK
(CD56
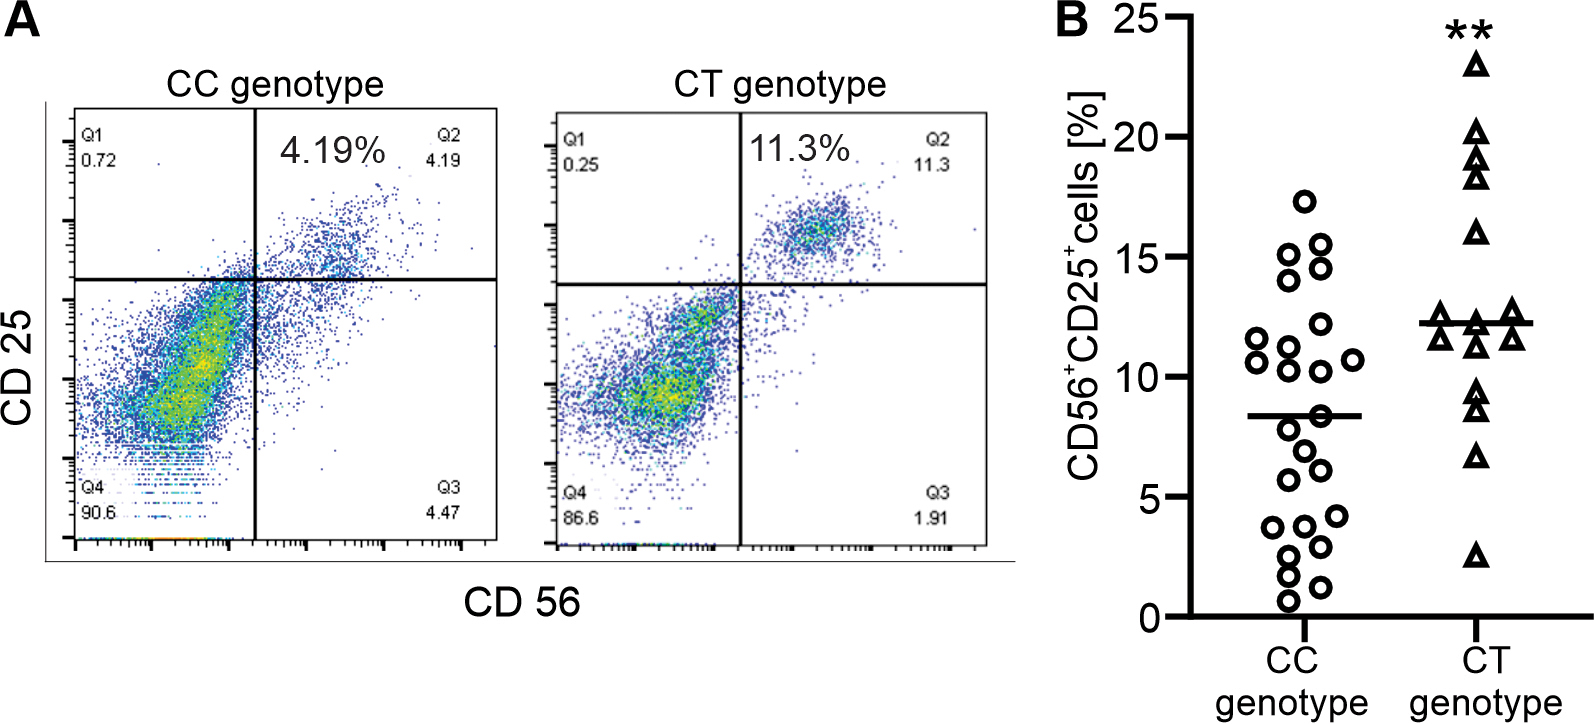 Fig. 6.
Association of the CYLD c.2351-47 variant with immunophenotype
in prostate cancer and hyperplasia patients. (A) Representative dot plots of
CD56
Next, PSA is used as a prostate disease marker to sufficiently predict prostate
enlargement to serve as a therapeutic and reliable indicator of cancer
aggressivity. As expected, the number of PCa patients with higher PSA levels of
12 ng/mL was 102 (100%), while the number of BPH patients with PSA levels above
the clinical cutoff of 4 ng/mL. In addition, percentage of PCa patients had
higher PSA levels (100 ng/mL), was 62/102 (60.8%) (Table 4). Importantly, PCa
carriers of the CT genotype of CYLD c.2351-47 and the CC genotype of
JAK2 rs4495487 were associated with elevated levels of PSA
| SNPs | Gene | Test model | Prostate cancer | Prostatic hyperplasia | ||||
| 10 |
PSA |
p-value | PSA |
PSA |
p-value | |||
| c.2351-47 | CYLD | CC | 38 (95%) | 47 (75.81%) | 19 (95%) | 42 (93.33%) | ||
| CT | 2 (5%) | 15 (24.19%) | 1 (5%) | 3 (6.67%) | 0.767 | |||
| c.2351-46 | CYLD | AA | 37 (92.5%) | 59 (95.16%) | 20 (100%) | 45 (100%) | ||
| AT | 3 (7.5%) | 3 (4.84%) | 0.568 | 0 (0%) | 0 (0%) | NC | ||
| rs1971432171 | CYLD | TT | 38 (95%) | 56 (90.32%) | 20 (100%) | 45 (100%) | ||
| TG | 2 (5%) | 6 (9.68%) | 0.283 | 0 (0%) | 0 (0%) | NC | ||
| p.Q732R | CYLD | AA | 39 (97.5%) | 60 (96.77%) | 20 (100%) | 45 (100%) | ||
| AG | 1 (2.5%) | 2 (3.23%) | 1 | 0 (0%) | 0 (0%) | NC | ||
| c.2483+188 | CYLD | GG | 33 (82.5%) | 51 (82.26%) | 20 (100%) | 40 (88.89%) | ||
| GC | 7 (17.5%) | 11 (17.74%) | 1 | 0 (0%) | 5 (11.11%) | 0.001 | ||
| rs994555780 | JAK2 | TT | 39 (97.5%) | 62 (100%) | 20 (100%) | 45 (100%) | ||
| TC | 1 (2.5%) | 0 (0%) | 0.246 | 0 (0%) | 0 (0%) | NC | ||
| rs4495487 | JAK2 | TT | 22 (55%) | 29 (46.78%) | 8 (40%) | 22 (48.89%) | ||
| TC | 17 (42.5%) | 25 (40.32%) | 0.882 | 9 (45%) | 18 (40%) | 0.363 | ||
| CC | 1 (2.5%) | 8 (12.9%) | 0.014 | 3 (15%) | 5 (11.11%) | 0.273 | ||
| rs10974947 | JAK2 | GG | 26 (65%) | 41 (66.13%) | 11 (55%) | 32 (71.11%) | ||
| GA | 12 (30%) | 14 (20.58%) | 0.322 | 8 (40%) | 11 (24.44%) | 0.021 | ||
| AA | 2 (5%) | 7 (11.29%) | 0.193 | 1 (5%) | 2 (4.44%) | 0.731 | ||
| GA+AA | 14 (35%) | 21 (31.87%) | 0.765 | 9 (45%) | 13 (28.89%) | 0.028 | ||
| TLR4/rs2149356 | TLR4 | TT | 7 (17.5%) | 9 (14.52%) | 0 (0%) | 9 (20%) | ||
| TG | 16 (40%) | 28 (45.16%) | 0.54 | 7 (35%) | 18 (40%) | |||
| GG | 17 (42.5%) | 25 (40.32%) | 0.839 | 13 (65%) | 18 (40%) | |||
| TG+GG | 33 (82.5%) | 53 (85.48%) | 0.704 | 20 (100%) | 36 (80%) | |||
| TLR4/c.331-337 | TLR4 | AA | 37 (92.5%) | 57 (91.94%) | 18 (90%) | 41 (91.11%) | ||
| AG | 3 (7.5%) | 5 (8.06%) | 1 | 2 (10%) | 4 (8.89%) | 1 | ||
| TLR4/rs911685299 | TLR4 | AA | 36 (90%) | 60 (96.77%) | 20 (100%) | 44 (97.78%) | ||
| AG | 4 (10%) | 2 (3.23%) | 0.082 | 0 (0%) | 1 (2.22%) | 0.497 | ||
| TLR4/c.331-206 | TLR4 | AA | 40 (100%) | 62 (100%) | 19 (95%) | 43 (95.56%) | ||
| AG | 0 (0%) | 0 (0%) | NC | 1 (5%) | 2 (4.44%) | 1 | ||
| TLR4/c.331-180 | TLR4 | TT | 40 (100%) | 60 (96.77%) | 20 (100%) | 44 (97.78%) | ||
| TA | 0 (0%) | 2 (3.23%) | 0.246 | 0 (0%) | 1 (2.22%) | 0.497 | ||
Statistically significant results were represented in bold style. NC, not calculated for sparse data.
Our study provides evidence for the association of CYLD sequence variants (c.2351-47, c.2351-46, and rs1971432171) with PCa risk in the Vietnamese study population. In this study, PCa-sensitive SNPs were identified for the first time. Mutations in the CYLD gene are known to be linked to abnormal cellular function in mice [26] and humans [23, 25] and the development of cyclindroma disease and myeloma [23]. Downregulated expression of CYLD is also associated with PCa progression [20]. In contrast, a rs12324931 SNP in CYLD is associated with the risk of inflammatory bowel disease [27]. In our recent study, p.W736G in the CYLD gene was indicated as the pathogenic variant in patients with polycythemia vera [28]; however, it was not found in all cases in this study as well as in patients with leukemia, including 352 patients with myeloid leukemia, and 145 patients with lymphocytic leukemia (unpublished data).
Moreover, PCa cases carrying the CT genotype of CYLD c.2351-47 had an expanded number of activated NK cells and an increased risk of PSA levels of more than 100 ng/mL (Fig. 6 and Table 4). High pretreatment serum PSA levels are associated with worse PCa outcome [29]. CYLD functions as a negative regulator of the immune response, including the activation of NK cells [26], and its expression is inhibited by high glucose [30]. Moreover, CYLD inhibits cancer cell proliferation, glucose uptake, and growth of prostate tumor cells [22]. A recent study indicated that the release of cytokines and chemokines by activated NK cells induces the recruitment of accessory immune cells such as T cells [31]. In addition, high PSA levels are linked to inflammatory responses [6]. Evidence suggests that activation of NK cells in CYLD-sensitive PCa patients is associated with the release of serum PSA.
Functional studies of the CYLD gene revealed that it is a negative regulator of proinflammatory gene expression through TLR4 signalling [32]. Unlike CYLD, carriers of TLR4 rs2149356 were associated with significantly elevated risks of both PCa and BPH compared with healthy controls. In contrast, the c.331-206 SNP in this gene was associated with a reduced risk of prostatic cancer. Changes in TLR4 expression are linked to prostate cancer risk and tumorigenesis by inducing inflammation [5]. Consistently, the rs2149356 SNP was found in Caucasian and South Asian patients with prostate cancer [33]. In contrast, the TLR4 rs11536889 SNP in the 3’ UTR is associated with the risk of prostate cancer in Korea [16] and Sweden [34], but not in other populations [35].
The effects of JAK2 expression on prostate cancer cell function have been revealed in a recent study [36]. Unlike this study, a known rs10429491 SNP in JAK2 is associated with PCa risk [19]. Importantly, carriers of the CC genotype of JAK2 rs4495487 were associated with higher levels of PSA in PCa patients, but not in BPH patients (Table 4).
Growing evidence indicates that chronic inflammation, which results from the
infiltration of immune cells into prostate tissue and blood circulation,
increases the risk of high-grade PCa development [8, 37]. Similarly, PCa patients
have an elevated number of circulating and tumor-infiltrating Tregs [8].
Recently, NK cells isolated from the peripheral blood of patients with PCa
displayed increased expression of the surface antigens CD56, CD9, and CD49a [38].
In contrast, we observed that the number of CD56
Lastly, CD13
Prostate cancer carriers of the CYLD c.2351-47 variant were associated with the recruitment of activated NK cells into the blood circulation and had serum PSA more than 100 ng/mL. Therefore, the CYLD c.2351-47 variant may be a significant risk factor for prostatitis in PCa patients.
The datasets used and/or analyzed during the current study are available from the corresponding author upon reasonable request.
LVD, PTH, CVM, and NTX conceived and designed the study. LVD, PTH, NTN, DTT, TTPT and NTMC conducted the experiments; LVD, PTH, NHH, NTT, CVM, and NTX analyzed the data. CVM wrote section ‘1’; NTN wrote section ‘2’; and NTX wrote sections (‘3’-‘5’). All the authors contributed to the revision, read and approved the final version of the manuscript. All authors have participated sufficiently in the work and agreed to be accountable for all aspects of the work.
All patients and volunteers provided written informed consent to participate in this study. Person care and experimental procedures were performed according to the Vietnamese law for the welfare of humans and were approved by the Research Ethics Committee, Military Hospital 103, no. 86/CNChT-HDDD.
We thank all patients for their participation.
This research is funded by the Vietnam Academy of Science and Technology (VAST) under grant number NCXS.01.03/23-25.
The authors declare no conflict of interest.
References
Publisher’s Note: IMR Press stays neutral with regard to jurisdictional claims in published maps and institutional affiliations.