


 , Min Wen 2,3,4,*
1 Department of Pediatrics, Wuhan Third Hospital (Tongren Hospital of Wuhan University), 430064 Wuhan, Hubei, China
2 State Key Laboratory of Functions and Applications of Medicinal Plants, Guizhou Medical University, 550004 Guiyang, Guizhou, China
3 College of Pharmacy, Guizhou Medical University, 550004 Guiyang, Guizhou, China
4 College of Basic Medical, Guizhou Medical University, 550004 Guiyang, Guizhou, China
Abstract
To explore the therapeutic role of arginine vasopressin (AVP) and its possible mechanisms in autism.
Mid-trimester pregnant rats treated with valproate on embryonic day 12.5 and their offspring were selected as autism model. The autism rats were randomly assigned to autism group and AVP treatment group that given AVP by inhalation per day from postnatal days 21 to 42. The changes in social behavior and the hippocampus transcriptome were compared, and the hub genes were confirmed by quantitative real-time polymerase chain reaction (qPCR) and Mendelian randomization (MR).
403 genes were found to be differentially expressed in the autism model, with the majority of these genes being involved in oligodendrocyte development and myelination. Only 11 genes associated with myelination exhibited statistically significant alterations following AVP treatment when compared to the autism group. Gene set enrichment, expression patterns, and weighted gene co-expression network analysis (WGCNA) analysis consistently indicated that the biological processes of oligodendrocyte development and myelination were markedly enriched in the autism group and exhibited improvement following treatment. The variation trend of various nerve cells demonstrated a notable increase in the proportion of oligodendrocytes and oligodendrocyte precursor cells in the autism group, which subsequently exhibited a significant decline following treatment. Five hub genes (MBP, PLIP, CNP, GFAP, and TAOK1) were verified by qPCR. Finally, MR studies have confirmed a causal relationship between hippocampal myelination-related gene expression and the risk of autism.
AVP could markedly enhance social interaction abilities in the autism rat model, possibly due to the significantly improved hippocampus oligodendrocytes development and myelination.
Keywords
- arginine vasopressin
- autism spectrum disorder
- hippocampus
- myelination
- transcriptome
Autism spectrum disorder (ASD) is a complex and highly heterogeneous neurodevelopmental disorder characterized by social interaction difficulties and the presence of repetitive behaviors or restricted interests. According to available data, ASD affects approximately 1%–2% of the population worldwide [1, 2]. Although remarkable progress has been made in the management of ASD in the last few years, the precise molecular mechanism remains unclear, and there is still no clinically available cure.
The hippocampus is one of the major components of the limbic system, with a crucial function in regulating emotion and forming memory [3]. The symptoms of ASD typically manifest between the ages of 12 and 24 months, a developmental period that coincides with critical stages of hippocampal maturation [4]. The available evidence indicates that alterations in the structure and function of the hippocampus may have a detrimental effect on social interactions, and that these effects may subsequently contribute to the development of an ASD phenotype [3, 5, 6, 7]. Consequently, uncovering the pathological mechanisms and neurobiological changes in the hippocampus of autism patients could facilitate the identification of new targets and lead to innovative therapeutic methods.
Arginine vasopressin (AVP), also known as antidiuretic hormone, is a neuropeptide hormone synthesized in the hypothalamus and has a critical role in social behavior [8, 9, 10, 11, 12]. Numerous studies have found that the concentration of AVP in the cerebrospinal fluid (CSF) of autism children is significantly lower than that of typically developing children, and the lower AVP levels has been associated with an increased severity of social symptoms in children with autism [13, 14, 15]. Intranasal inhalation of AVP can markedly enhance social functioning in children with autism [16]. Additionally, animal studies have also demonstrated that AVP markedly enhances social functioning by influencing the development of synaptic and oligodendrocyte cells in the prefrontal cortex and amygdala [17, 18, 19]. AVP as a candidate drug for improving social deficits in autism has entered phase II clinical studies (NCT01962870, NCT03204786). Numerous animal and human studies have demonstrated that intranasal inhalation of AVP significantly improves social behavior, but the exact central mechanism is still unclear [16, 19, 44].
RNA sequencing (RNA-seq) technology is widely utilized for the investigation of human diseases at the molecular level and brain pathologies of neuropsychiatric disorders [20]. To further explore the effects of AVP on the hippocampal and its possible mechanisms at the molecular level, the changes in the hippocampal transcriptome were compared pre- and post- AVP treatment in autism rat model by combining multiple bioinformatics techniques and were subsequently confirmed by quantitative real-time polymerase chain reaction (qPCR) and mendelian randomization (MR).
Valproic acid sodium salt (VPA, P4543-10g, Sigma-Aldrich Co, St. Louis, MO, USA) was dissolved in physiological saline at a concentration of 250 mg/mL. AVP (HY-p0049, MedChemExpress LLC, Monmouth Junction, NJ, USA) was dissolved in physiological saline at a concentration of 2.5 mg/mL.
Wistar rats (270–290 g, half male and female) were obtained
from Guizhou Medical University. All rats were housed
individually with free access to water and food in an air-conditioned room with a
temperature 23
As Schneider’s described [21], the male and female wistar rats were mated in a 1:1 ratio overnight. The morning when spermatozoa were detected was designated as the first day of embryonic development (E0.5). Pregnant rats were given a single intraperitoneal injection of 600 mg/kg VPA on the E12.5, while control pregnant rats were injected with physiological saline. The male offspring of VPA-treated females were randomly assigned to either autism group (n = 10) or AVP treatment group (n = 10); The male offspring of the saline-treated group were marked as the control (n = 10). The AVP treatment group was received an intranasal inhalation of 400 µg/kg AVP per day from postnatal day 21 (PND21) to PND42. The control and autism groups were given the same amount of saline.
Three-Chamber Test is a protocol for measuring social deficits in rat models of autism [22]. In the period of adaptation of the experiment, the rat was permitted to explore the entirety of the apparatus freely for 10 minutes. Following the adaptation period, the rat was initially confined to the central compartment and an unfamiliar same-sex rat (designated as “stranger 1”) was introduced into one of the cups (with alternating sides for each rat). The rat was then permitted to explore the entire apparatus for a period of 10 minutes (social preference test). Subsequently, the test rat was once more restricted to the central compartment, while another unfamiliar same sex rat (designated as “stranger 2”) was placed under another cup. The test rat was then permitted to explore the apparatus at will for a further 10 minutes (Social Novelty Test). The sniffing time spent at each wire cage was manually recorded. Before each rat began testing, the apparatus was meticulously cleaned with 70% ethanol to minimize the impact of residual rat odors. All rats were tested at P42.
Rats (n = 15, each group contained 5 rats) were decapitated following deep anesthesia (xylazine (30 mg/kg) and ketamine (200 mg/kg)) on P42, and
their bilateral hippocampus was rapidly dissected and
snap-frozen in liquid nitrogen for 2 h, after which it was
stored at –80 °C until RNA extraction. Total
RNA was extracted and purified using TRIzol reagent (15596026CN, Invitrogen,
Carlsbad, CA, USA) in accordance with the manufacturer’s instructions.
The concentration and purity of RNA in each sample (mixed bilateral hippocampus
samples) were quantified using ND-1000 (NanoDrop, Wilmington, DE, USA). All
RNA samples with an A260/A280 absorbance ratio
An RNA-seq library was constructed for each
sample (mixed bilateral hippocampus samples) and the 2
The clean reads were aligned to the reference genome
(Rattus_norvegicus.Rnor_6.0, v101, https://asia.ensembl.org/info/data/ftp/index.html, mapping efficiencies
(
To overcome the effect of the gene filtering thresholds (fold changes and
p-adjust) on the results of the analysis, we conducted a Gene Set
Enrichment Analysis by GSEA V4.3.2 (https://www.gsea-msigdb.org/gsea/index.jsp)
[28, 29]. The GO biological process (c5.go.bp.v2023.1) and KEGG pathway
(c2.cp.kegg.v2023.1) were analyzed by Molecular Signatures Database v2023.1
(https://www.gsea-msigdb.org/gsea/msigdb/index.jsp) [30, 31]. Using a criterion of
In order to analyze the dynamic change trend of genes, soft clustering analysis of the most variable gene (top 3000 genes were included) using the Mfuzz package v2.64.0 (https://bioconductor.org/packages/release/bioc/html/Mfuzz.html) [32]. The genes in the clusters of interest were further analyzed using a web server g:Profiler (https://biit.cs.ut.ee/gprofiler/gost) [33].
We are using the weighted gene co-expression network analysis (WGCNA) package v1.73 (https://cran.r-project.org/web/packages/WGCNA/index.html) to construct a weighted gene correlation networks and to find genes that are strongly associated with the autism phenotype [34, 35]. Hierarchical clustering analysis was used to construct the clustered tree and to stratify a set of variant genes into different modules. Next, the correlations between the modules and the autism group were assessed by Pearson’s correlation analysis. The genes with significant association modules were subsequently performed functional enrichment analysis using clusterProfiler. Hub genes in these modules were further screened by Cytohubba-MCC v0.1 (https://apps.cytoscape.org/apps/cytohubba).
To analyse trends in the number of different cell types (oligodendrocyte, astrocyte, neuron, oligodendrocyte precursor cell, microglia, and endothelial cell) in the hippocampus, we used the brain cell type specific gene expression analysis (BRETIGEA v1.03, https://cran.r-project.org/web/packages/BRETIGEA/index.html) [36] package to calculate the first singular vector of a variable number of cell type-specific genes to estimate the relative proportions of various cell types in each sample.
Total RNA from the hippocampus was extracted and reverse-transcribed to cDNA. The relative mRNA expression levels of the target gene were calculated using the 2-ΔΔCT method [37]. Table 1 lists all primer sequences used.
| Gene | Primer | Sequence (5 |
Polymerase chain reaction (PCR) Products |
|---|---|---|---|
| Rat GAPDH | Forward | ACAGCAACAGGGTGGTGGAC | 252 bp |
| Reverse | TTTGAGGGTGCAGCGAACTT | ||
| Rat MBP | Forward | ATGTGTTTGGGGAGGCAGAT | 233 bp |
| Reverse | TTGGATGGTCTGAAGCTCGT | ||
| Reverse | GAGAAGCAGGGTGCAGTTTC | ||
| Rat PLP1 | Forward | TCTTTGGAGCGGGTGTGTCATTG | 99 bp |
| Reverse | CACCAGGAGCCATACAACAGTCAG | ||
| Rat GFAP | Forward | GCGAAGAAAACCGCATCACC | 96 bp |
| Reverse | GGTGGCCTTCTGACACAGAT | ||
| Rat Taok1 | Forward | AAGAGCATCAGCTCCACAGT | 239 bp |
| Reverse | GCCGATGTTCGTCCATTTCT | ||
| Reverse | TCATCGAGCACAAGAACCCTGA | ||
| Rat Cnp | Forward | AGCTGCAGTTCCCTTTCCTTCA | 274 bp |
| Reverse | TCATCGAGCACAAGAACCCTGA |
All experimental data are shown as the mean
To further analyze the causal association of myelination, phosphoinositide
3-kinase (PI3K) pathway-related gene expression in the
hippocampus with autism, we performed a MR analysis [38, 39].
Single nucleotide polymorphisms (SNPs) were instruments, hippocampus myelination,
PI3K pathway-related gene expressions were exposure, and ASD was the outcome
[40]. The following steps were used to select instrumental variables (IVs): (1)
The cis-expression quantitative trait locus (cis-eQTL) data associated with
myelination [41] and PI3K signaling pathway (msigdb:
WP_PI3K_AKT_SIGNALING_PATHWAY.v2023.2.Hs) in hippocampus were download from
Genotype-Tissue Expression Project (GTEx) (https://www.gtexportal.org/home/), and
the filter threshold set at p
In this study, the inverse-variance weighted (IVW) method was
used as the primary indicator for assessing the causal effect. If only a single
instrumental variable was obtained, the Wald Ratio method was used for
assessment. All statistical analyses were performed in
“TwoSampleMR” (v0.6.8, https://github.com/MRCIEU/TwoSampleMR)
[42], and “Mendelian Randomization Pleiotropy RESidual Sum and
Outlier (MR-PRESSO)” packages (v1.0, https://github.com/rondolab/MR-PRESSO)
[43]. p value of FDR
The entire experimental procedure is described in Fig. 1.
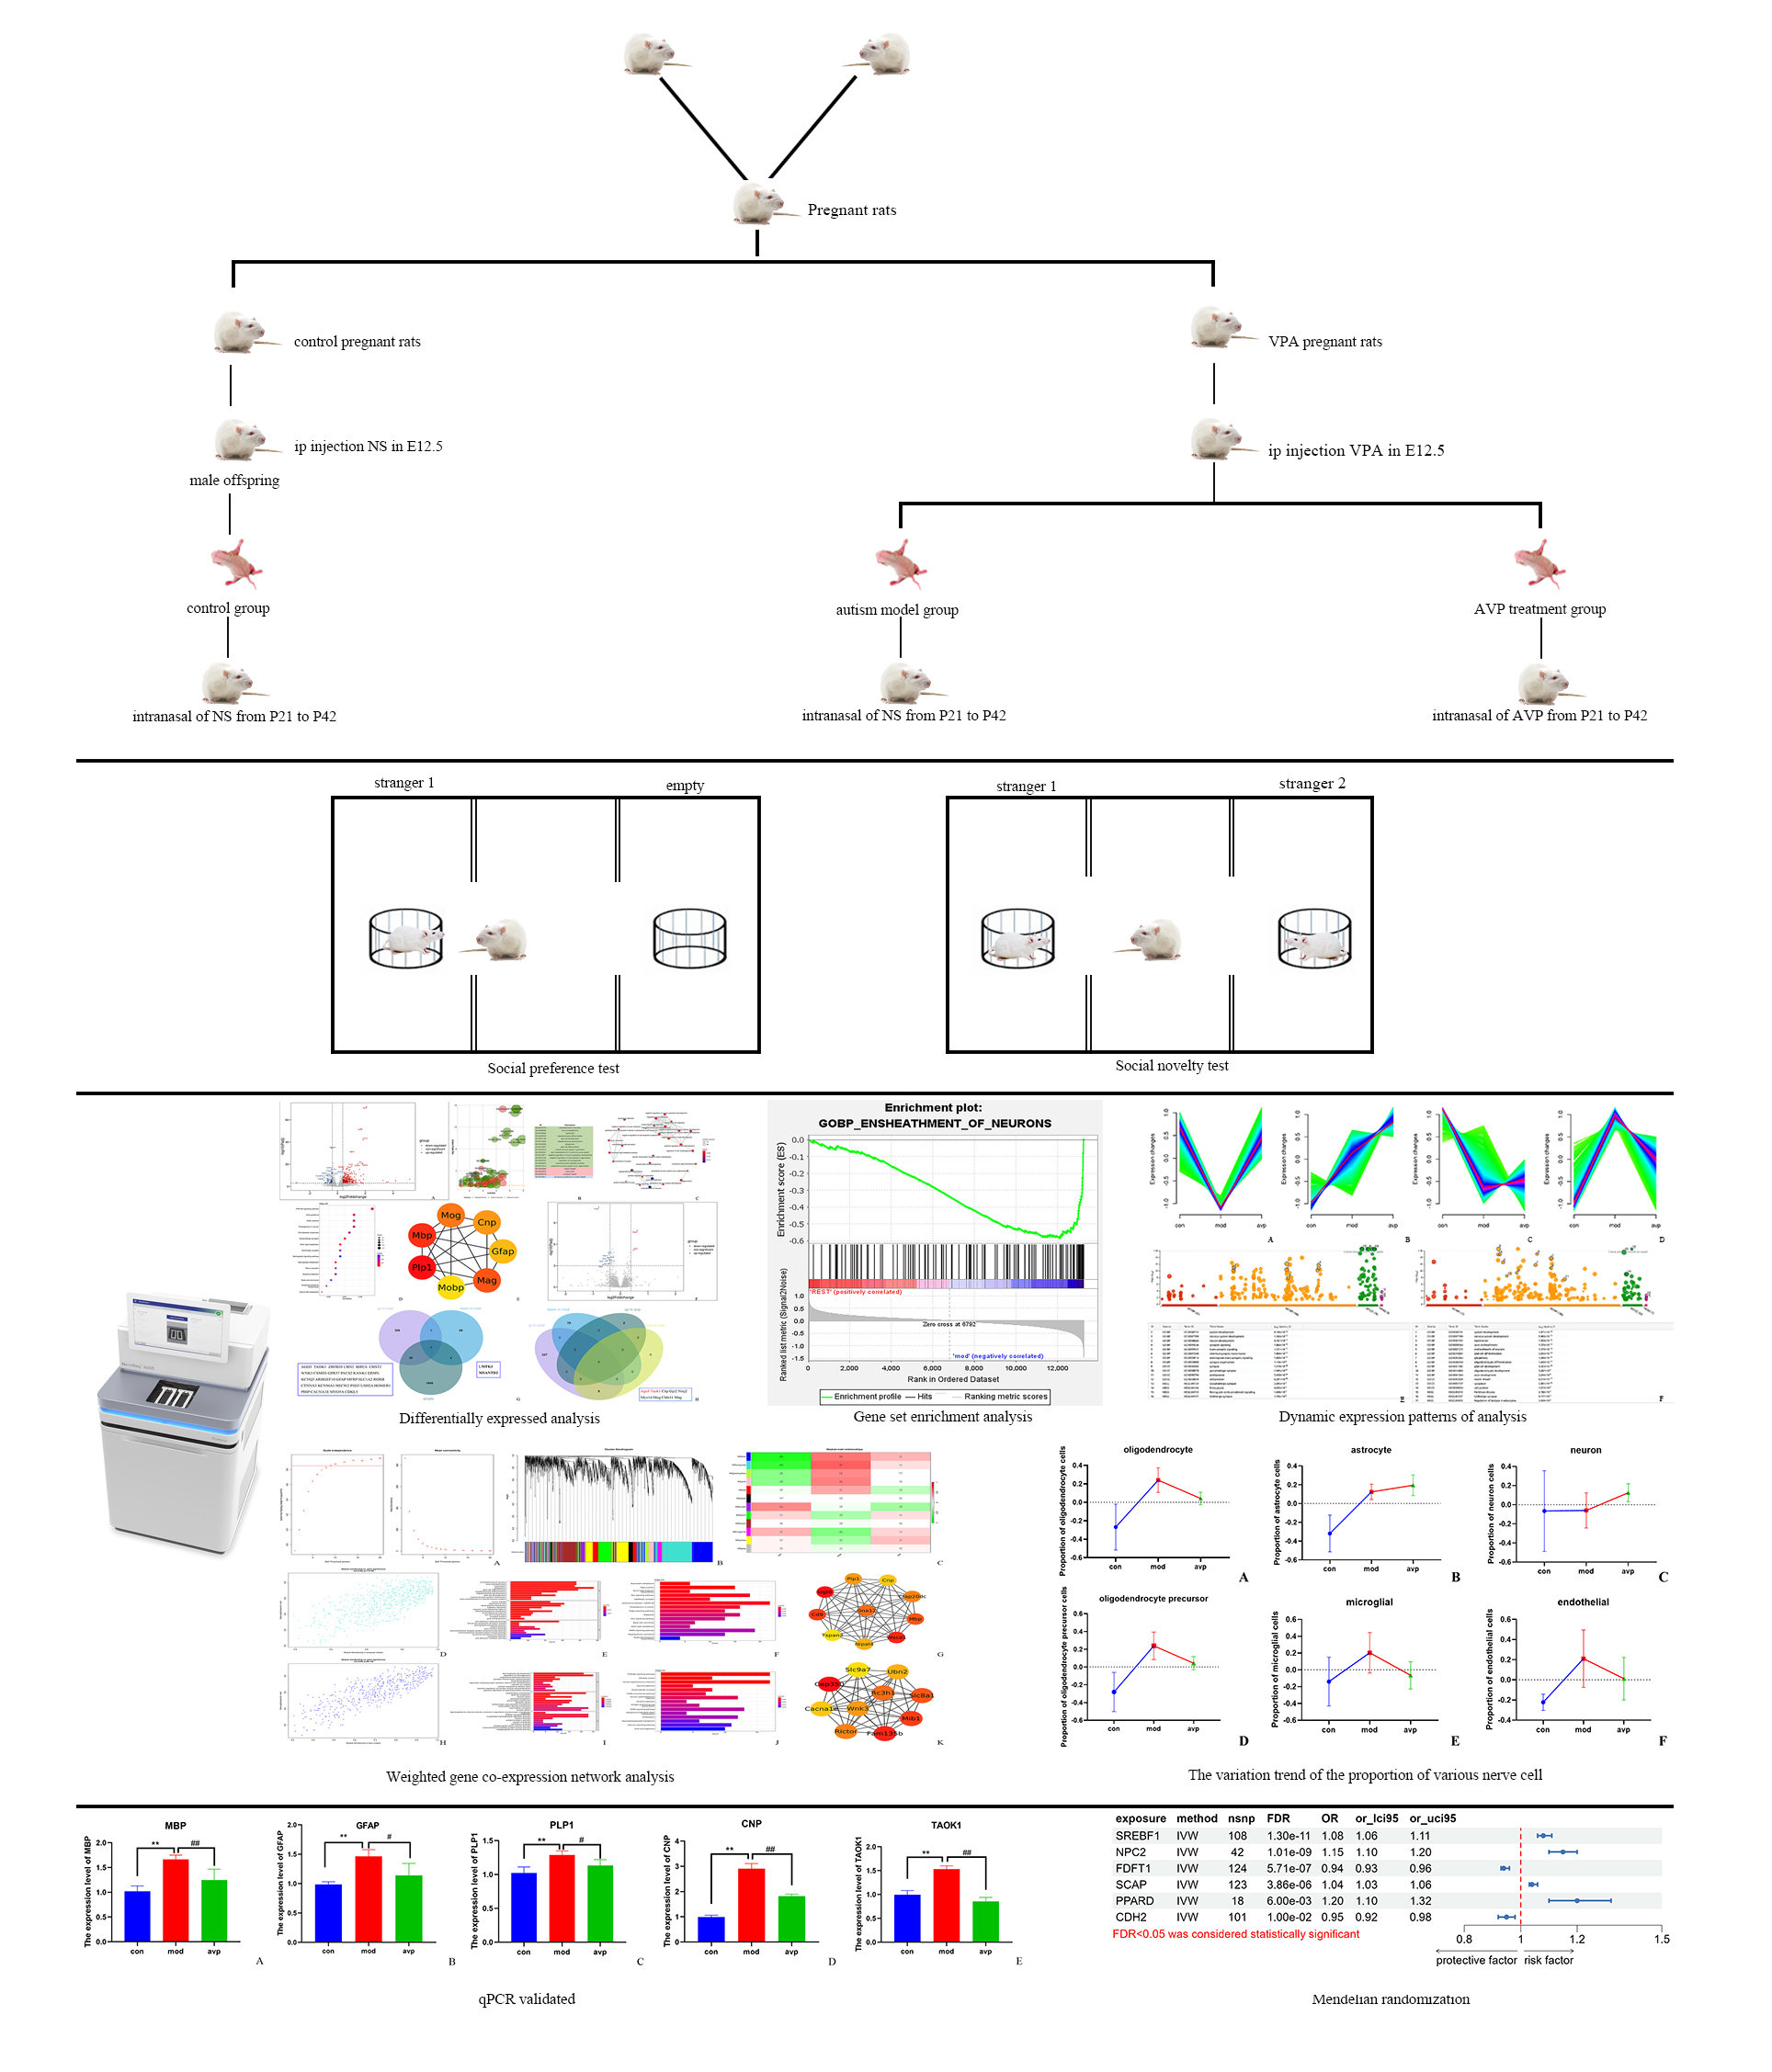 Fig. 1.
The entire experimental procedure. NS, normal saline; VPA, valproic acid sodium salt; AVP, arginine vasopressin; qPCR, quantitative real-time polymerase chain reaction.
In the social preference test (Fig. 2A), the control and AVP groups spent more time sniff the cage with stranger 1 than the empty cage. The autism model group showed disruptions in social interactions and spent a similar time sniff the cage containing stranger 1 and the empty cage.
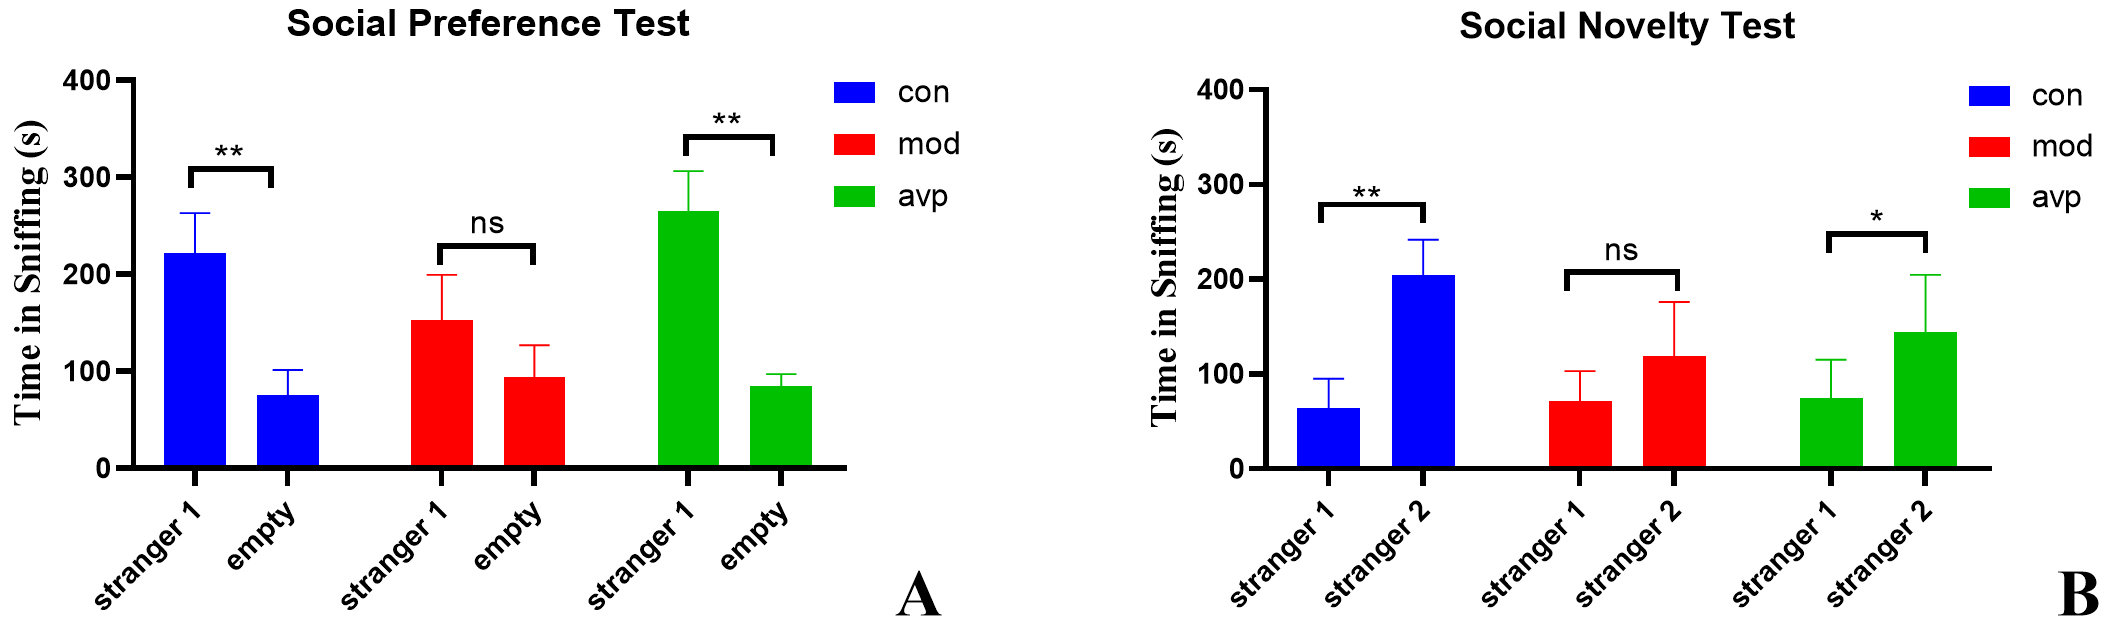 Fig. 2.
The results of three-chamber test. (A) Social preference test.
(B) Social novelty test. ns: no significant, * p
In the social novelty test (Fig. 2B), the control and AVP groups spent more time sniff the cage with stranger 2 than stranger 1. The autism rats seemed not to recognize the familiar conspecific and thus spent similar time with stranger 1 and stranger 2.
There were 403 genes (334 upregulated and 69 downregulated) whose expression was significantly differed in the autism model. The volcano plot is shown in Fig. 3A. GO functional enrichment analysis showed that most of these DEGs were involved in gliogenesis, ensheathment of neurons, axon ensheathment, myelination, glial cell differentiation, etc. (Fig. 3B). The largest number of GO terms cluster into three main branches, such as development, cytoskeleton and myelination development in the enrichment map (Fig. 3C). The KEGG enrichment showed these DEGs were significantly enriched in axon guidance, PI3K-Akt (protein kinase B) signaling pathway, motor proteins, glutamatergic synapse, cholinergic synapse, and sphingolipid metabolism (Fig. 3D). Subsequently, we identified the hub genes using the Matthews Correlation Coefficient (MCC) algorithm. 7 hub genes (PLP1 (proteolipid protein 1), MBP (myelin basic protein), MOG (myelin oligodendrocyte glycoprotein), MAG (myelin associated glycoprotein), CNP (CNPase, 2′,3′-cyclic nucleotide phosphodiesterase), GFAP (glial fibrillary acidic protein) and MOBP (myelin associated oligodendrocyte basic protein)) which involved in glial cell differentiation, gliogenesis and oligodendrocyte differentiation were found (Fig. 3E).
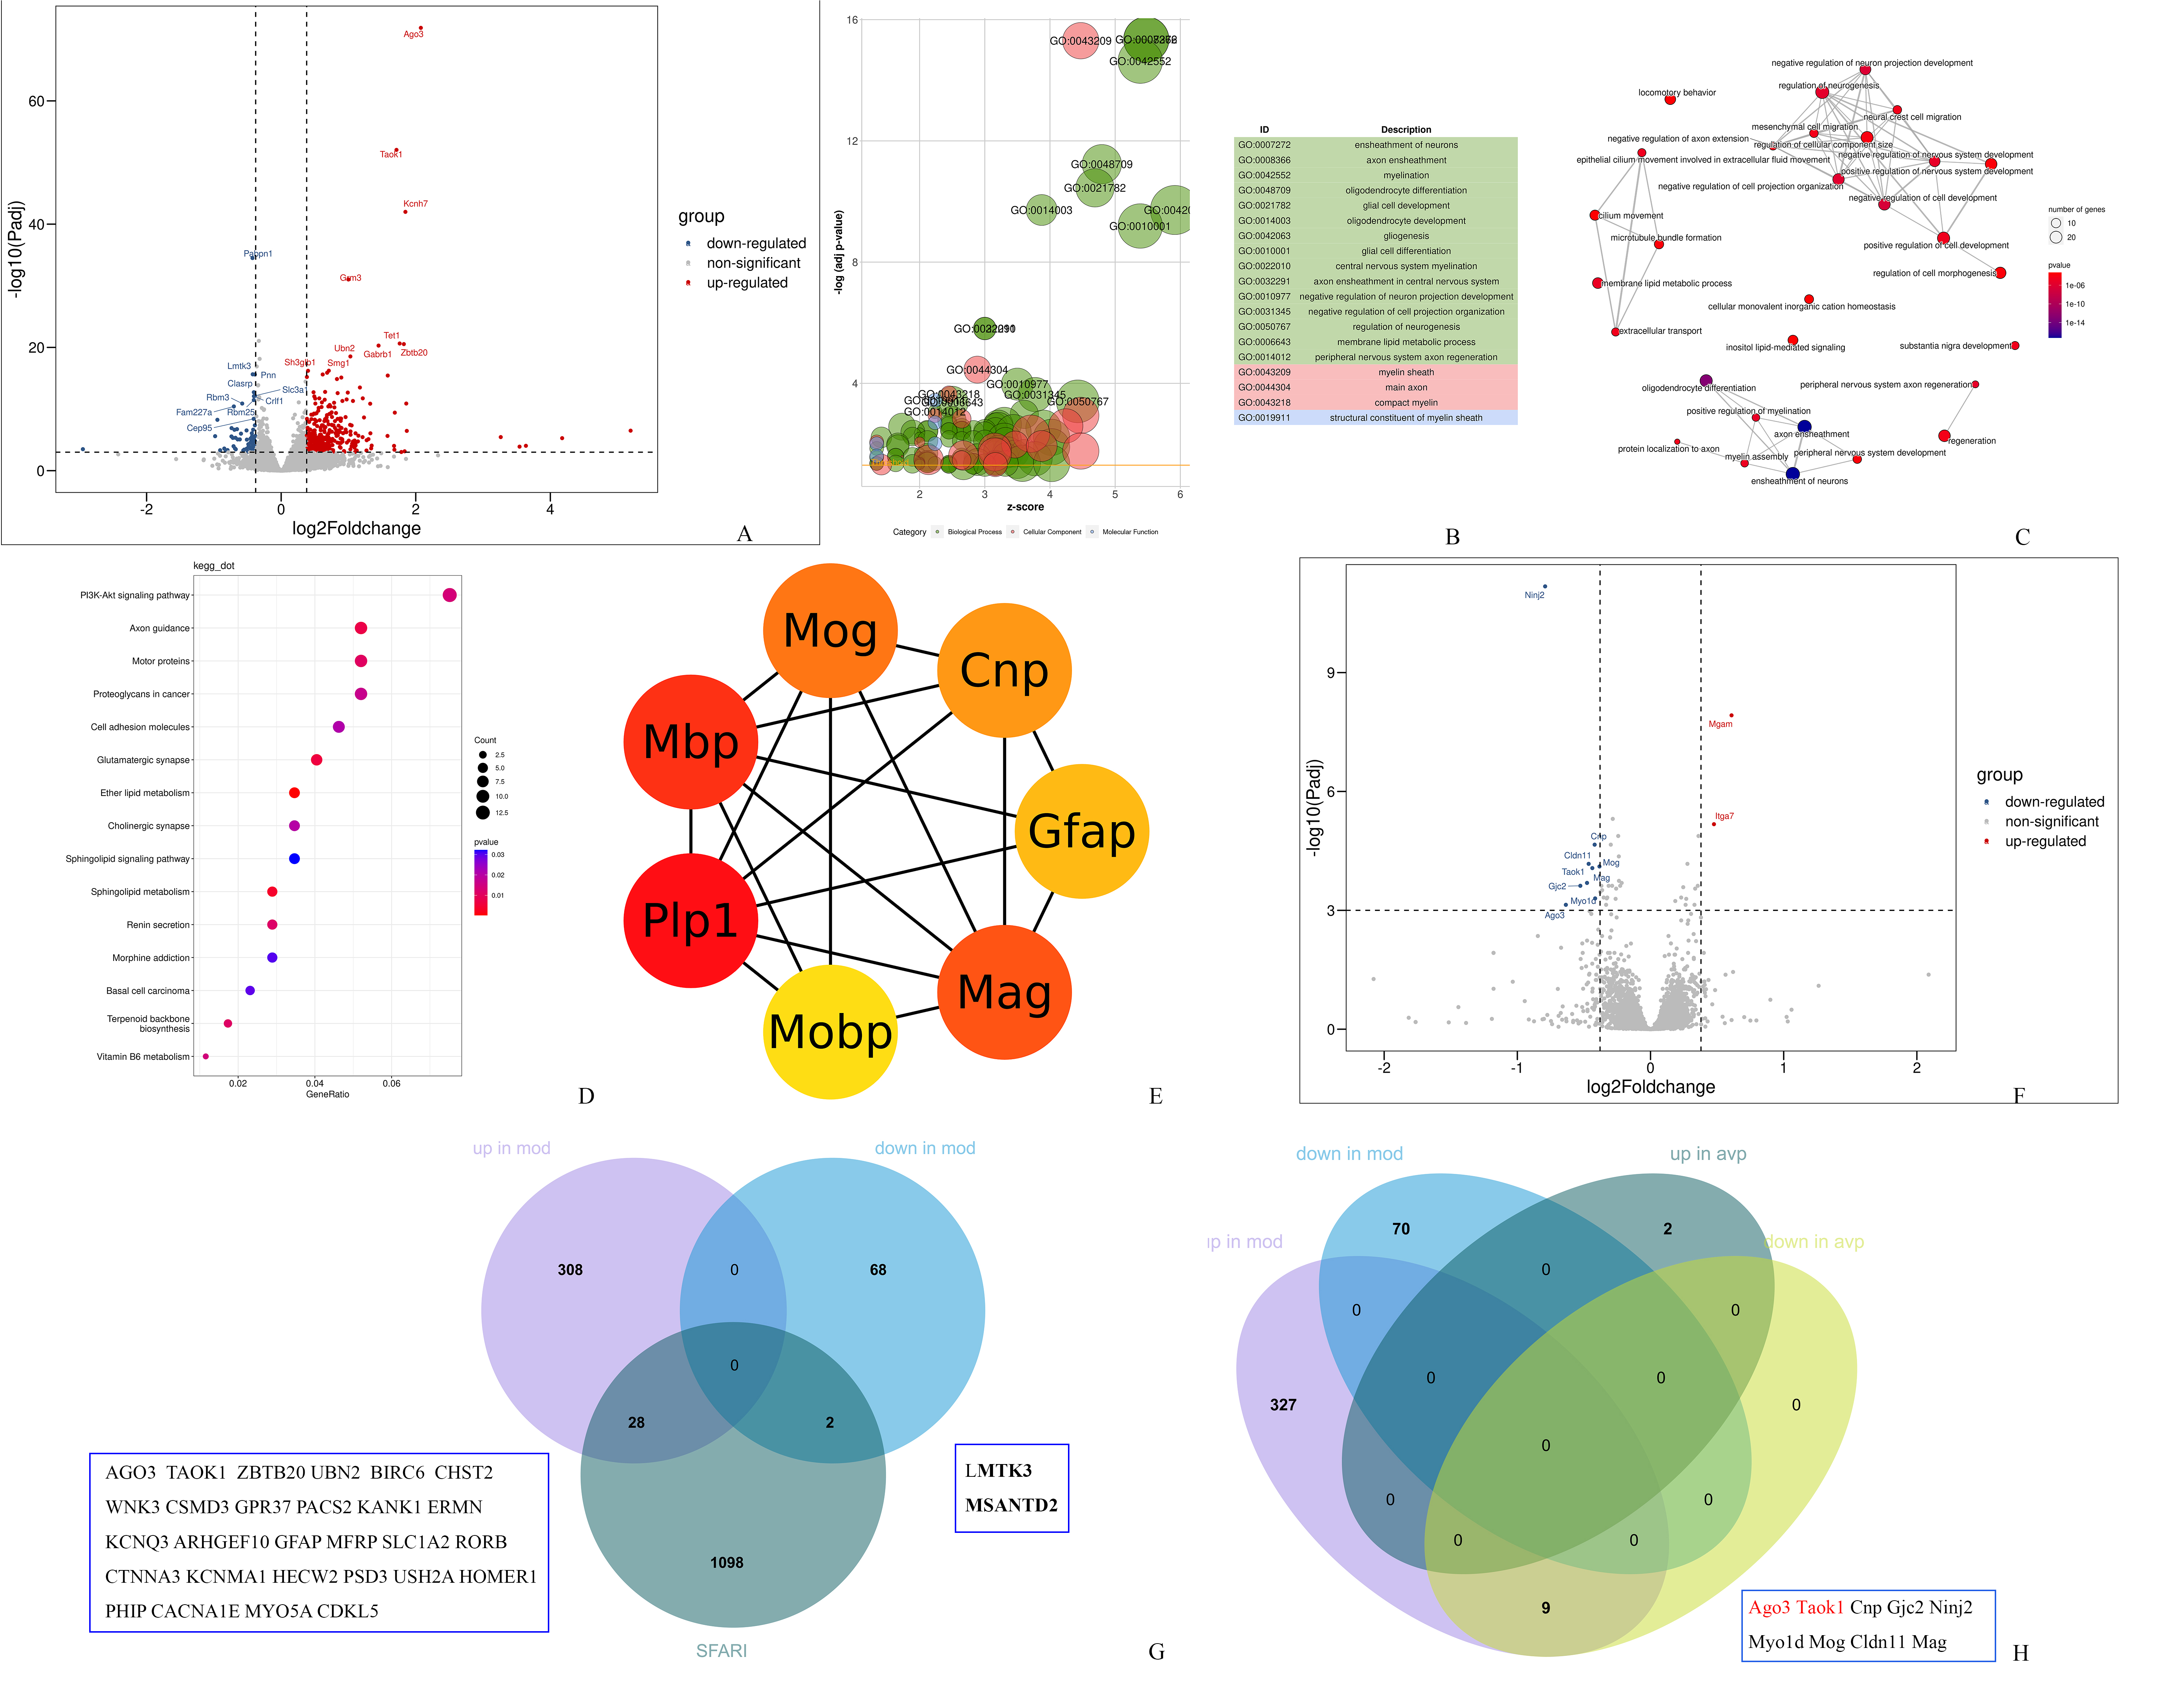 Fig. 3.
Functional analysis of DEGs. (A) Volcano plot showing differentially expressed genes (DEGs) between control and model groups. (B) Bubble plot showing Gene Ontology (GO) enrichment analysis between the control and model groups. (C) Enrichment map for GO biological process analysis between the control and model groups. (D) Dot plot showing Kyoto Encyclopedia of Genes and Genomes (KEGG) enrichment result between the control and model groups. (E) Cytohubba-MCC was used to identify hub genes between the control and model groups. (F) Volcano plot showing DEGs between the model and AVP groups. (G) Venn diagram showing the overlapping of DEGs (control vs. model group) and Simons Foundation Autism Research Initiative (SFARI). (H) Venn diagram showing the overlapping of DEGs between pre- and post- AVP treatment. MCC, Matthews Correlation Coefficient.
There were 11 genes (2 upregulated and 9 downregulated) whose expression was significantly different in the autism model compared to the AVP group (vlcano plot is shown in Fig. 3F). The number of DEGs was too small to allow reliable annotation with GO and KEGG.
Furthermore, we analyzed the overlap between our DEGs and the 1128 human ASD genetic association genes from the Simons Foundation Autism Research Initiative (SFARI). Among 403 DEGs, 30 genes (28 upregulated and 2 downregulated) involved in the development of nervous system were found (Fig. 3G). We also performed a Venn diagram analysis the overlap of DEGs between pre- and post- AVP treatment and 9 genes which upregulated in autism model and downregulated after AVP treatment were found (Fig. 3H). Among these genes, 7 (CNP, MOG, MAG, myo1d (Myosin1D), Cldn11 (Oligodendrocyte-specific protein), GJC2 (gap junction protein gamma-2) and Ninj2 (Nerve injury-induced protein 2)) were mainly involved in myelin development and 2 (AGO 3 (Argonaute 3 or EIF2C3) and TAOK1 (Thousand and one amino-acid kinase 1)) were associated with a high risk for autism in SFARI. There were no genes which decreased in the model group and then increased after AVP treatment.
68 GSEA biological process were significantly upregulated in the autism model group. The 3 most significant terms were related to the ensheathment of neurons, oligodendrocyte development, and glial cell development. Only 4 GSEA biological process (BP) were significantly downregulated in the autism model group, such as mRNA splice site selection, rRNA modification, positive regulation of T helper cell differentiation and regulation of mRNA processing (Fig. 4A). 39 GSEA BP were significantly downregulated after AVP treatment compared to the autism model group. The top 3 terms were related to the cilium movement, attachment of mitotic spindle microtubules to kinetochore, and kinetochore organization. Only 3 gene sets, such as interleukin 4 production, brown fat cell differentiation regulation, and cellular polysaccharide catabolic process were significantly upregulated after AVP treatment (Fig. 4B). The intersection of the GSEA BP between pre- and post- AVP treatment was analyzed (Fig. 4C). Our results found that 13 BP were upregulated in autism model and downregulated in AVP treatment, such as ensheathment of neurons, oligodendrocyte development, axon ensheathment in the central nervous system, oligodendrocyte differentiation, cilium movement and similar (Fig. 5). No gene sets which downregulated in autism model and upregulated in AVP treatment were found.
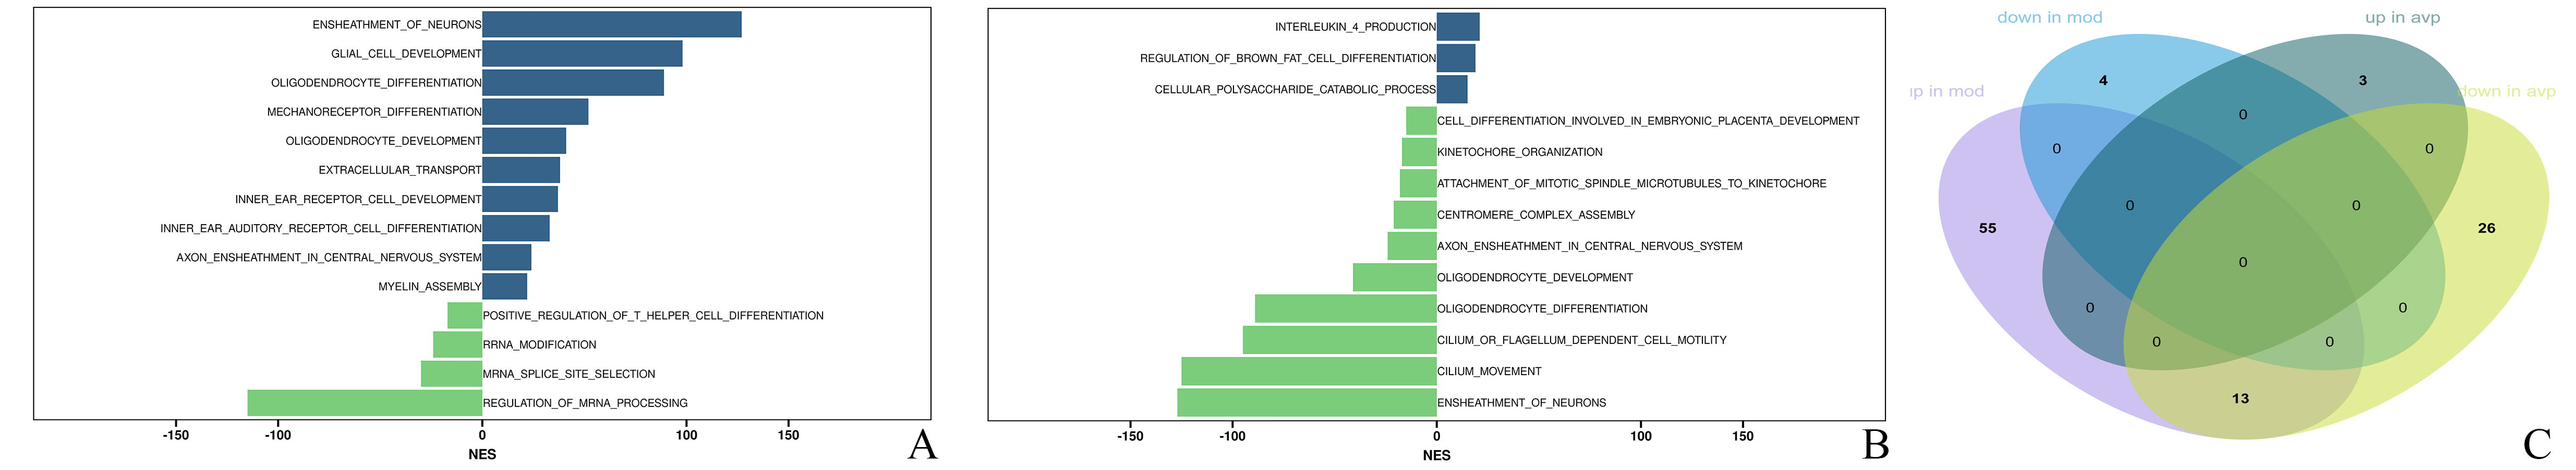 Fig. 4.
Differential gene sets analysis. (A) Differential gene sets between control and model group. (B) Differential gene sets between model and AVP group. (C) Venn diagram showed the overlapping gene sets between pre- and post- AVP treatment.
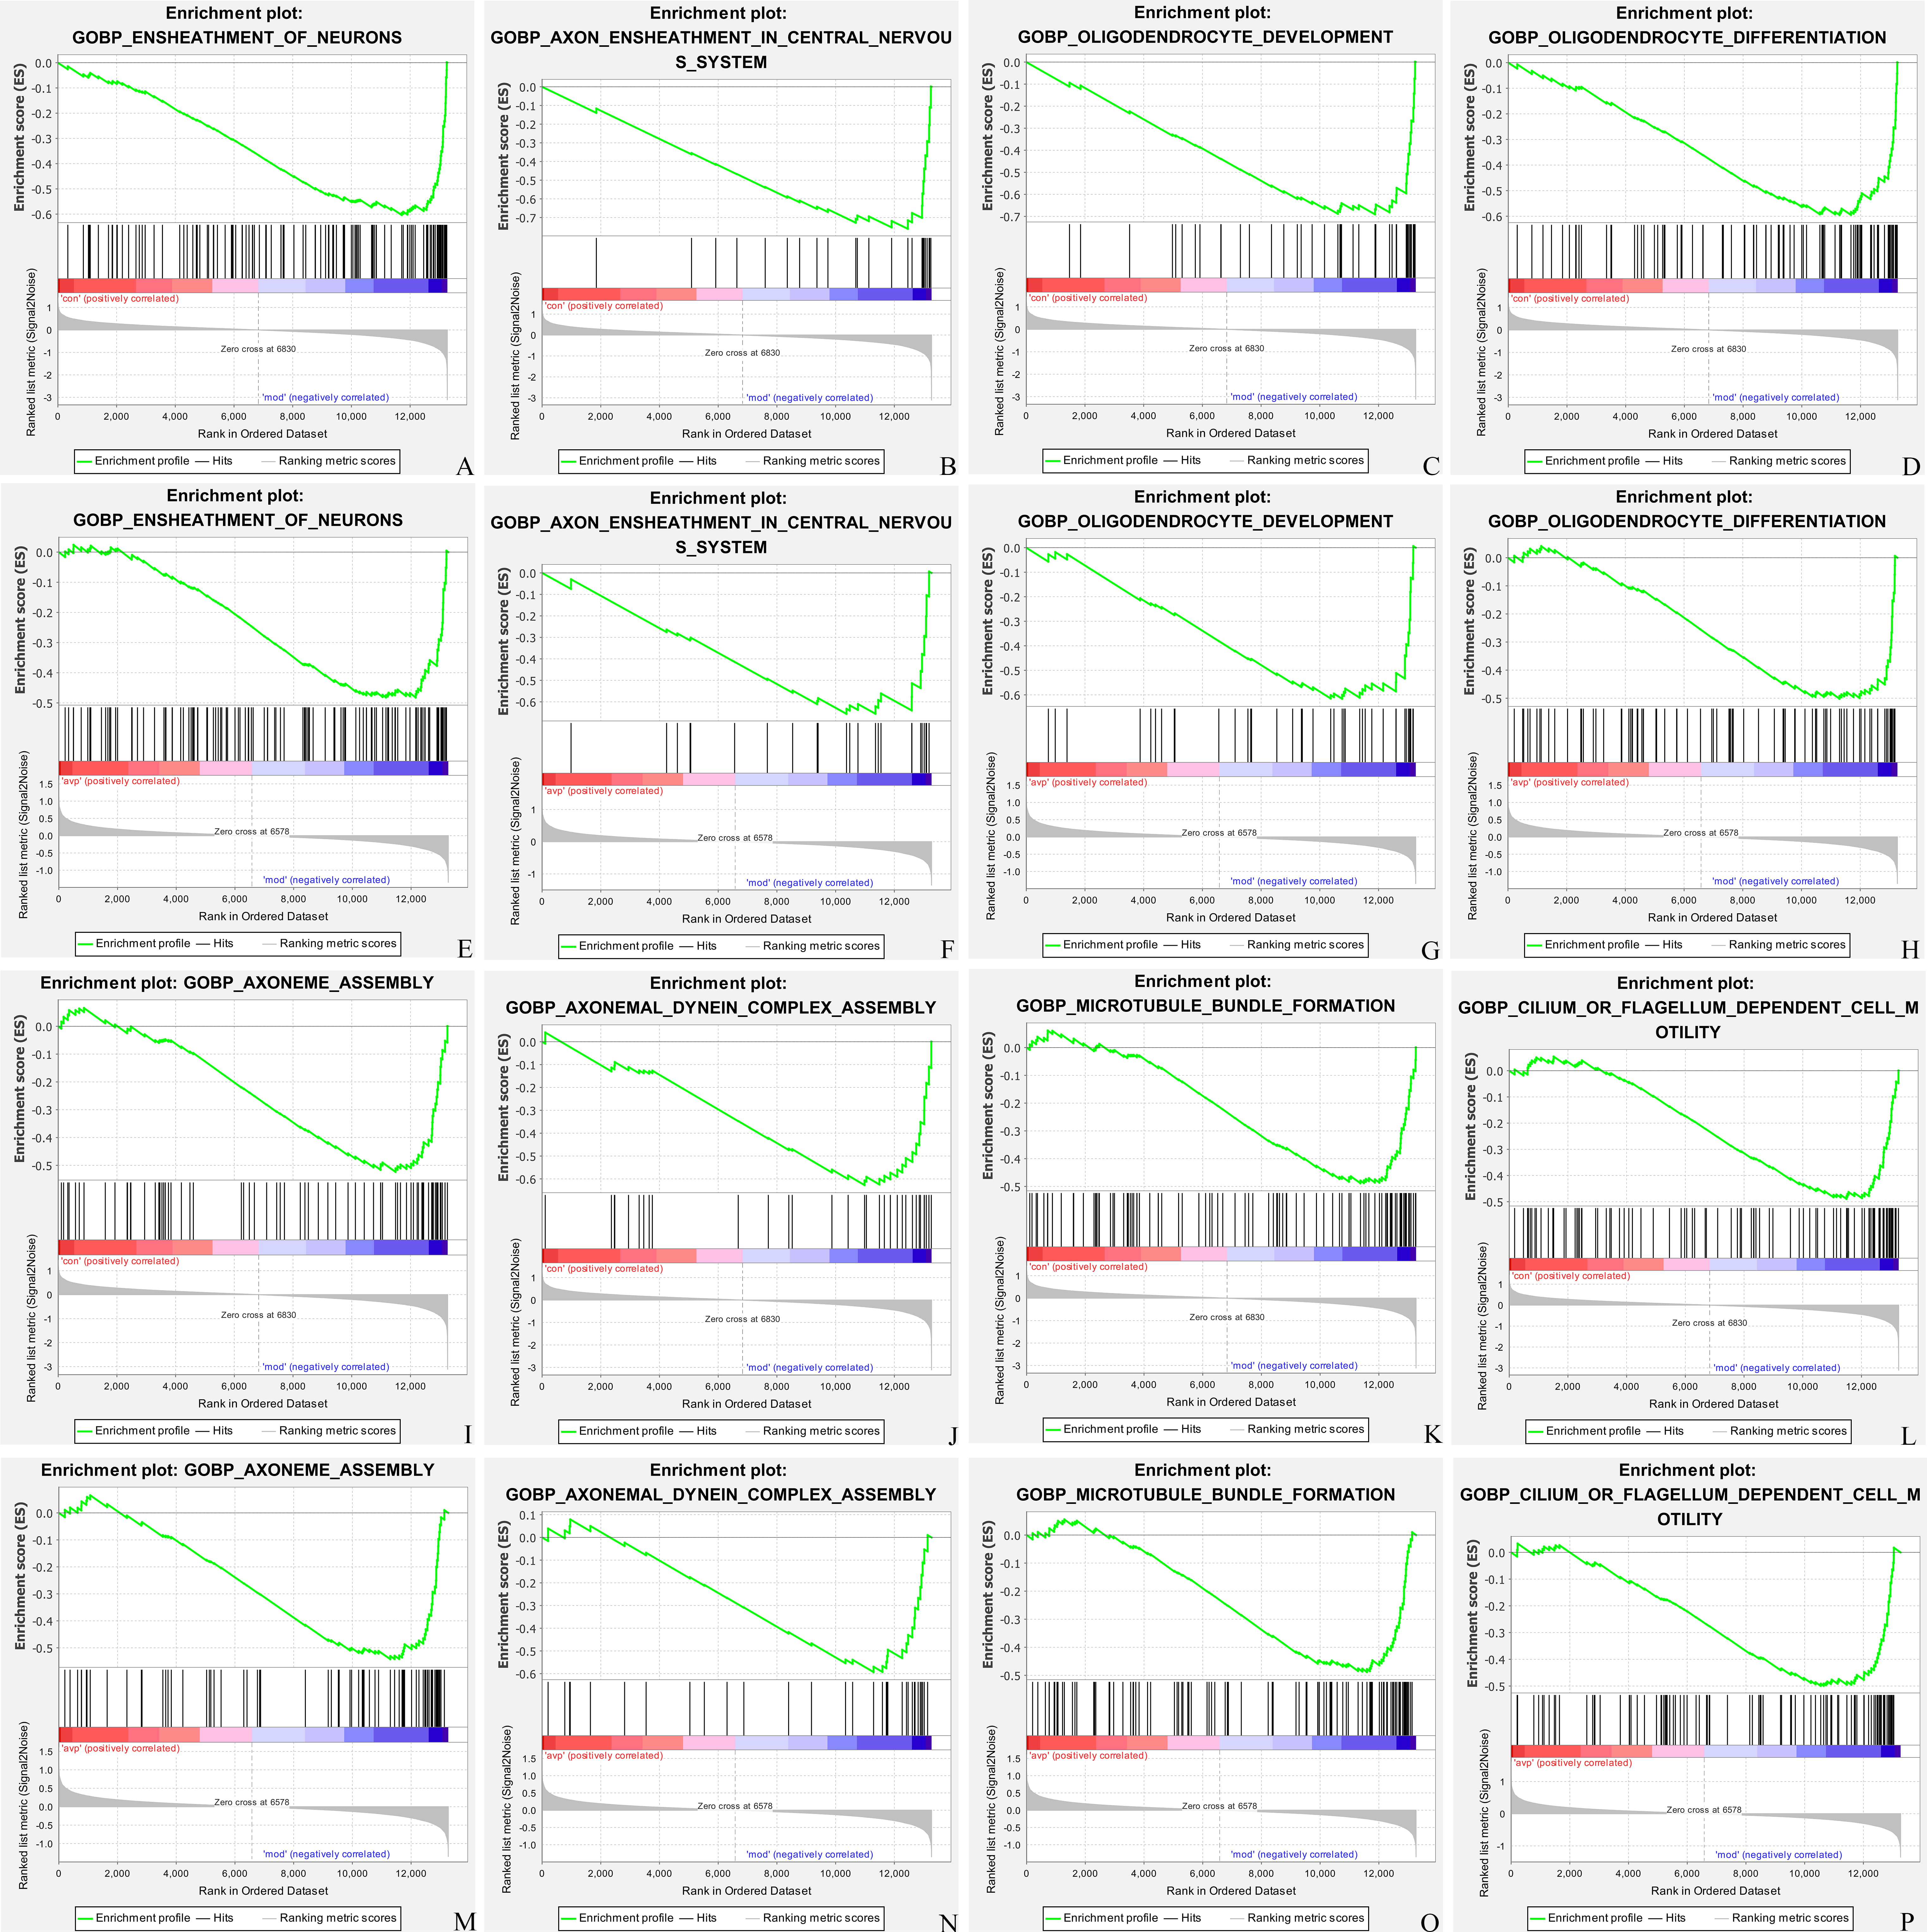 Fig. 5.
Biological process enrichment by Gene Set Enrichment Analysis (GSEA). (A,E) Ensheathment of neurons; (B,F) axon ensheathment; (C,G) oligodendrocyte development; (D,H) oligodendrocyte differentiation; (I,M) axoneme assembly; (J,N) axonemal dynein complex assembly; (K,O) microtubule bundle formation; (L,P) cilium or flagellum dependent cell motility in control (con) vs. autism (mod) and autism (mod) vs. AVP.
The results of GSEA KEGG enrichment analysis showed that only 1 gene set (ribosome) was significantly upregulated and 1 gene set (spliceosome) was downregulated in the autism model group compared to the control group. Three gene sets (galactose metabolism, regulation of actin cytoskeleton, selenoamino acid metabolism) were upregulated, and no gene sets were downregulated in the AVP treatment group compared to the autism model group.
4 clusters with different expression trends were found (Fig. 6A–D). We further analyzed the gene biology function in clusters 1 and 4. Genes in cluster 1 showed a decreasing trend in the autism model group and increasing after AVP treatment (Fig. 6A). A large number of nervous system development and synaptic signaling-related biological processes and GABAergic synapse, glutamatergic synapse-related pathway was significantly enriched in this cluster (Fig. 6E). Genes in cluster 4 showed an increasing trend in autism model and decreasing after AVP treatment (Fig. 6D). A large number of nervous system development, glial cell development and myelination related biological processes and Parkinson’s disease, GABAergic synapse, and regulation of lipolysis in adipocytes related pathway was significantly enriched in this cluster (Fig. 6F).
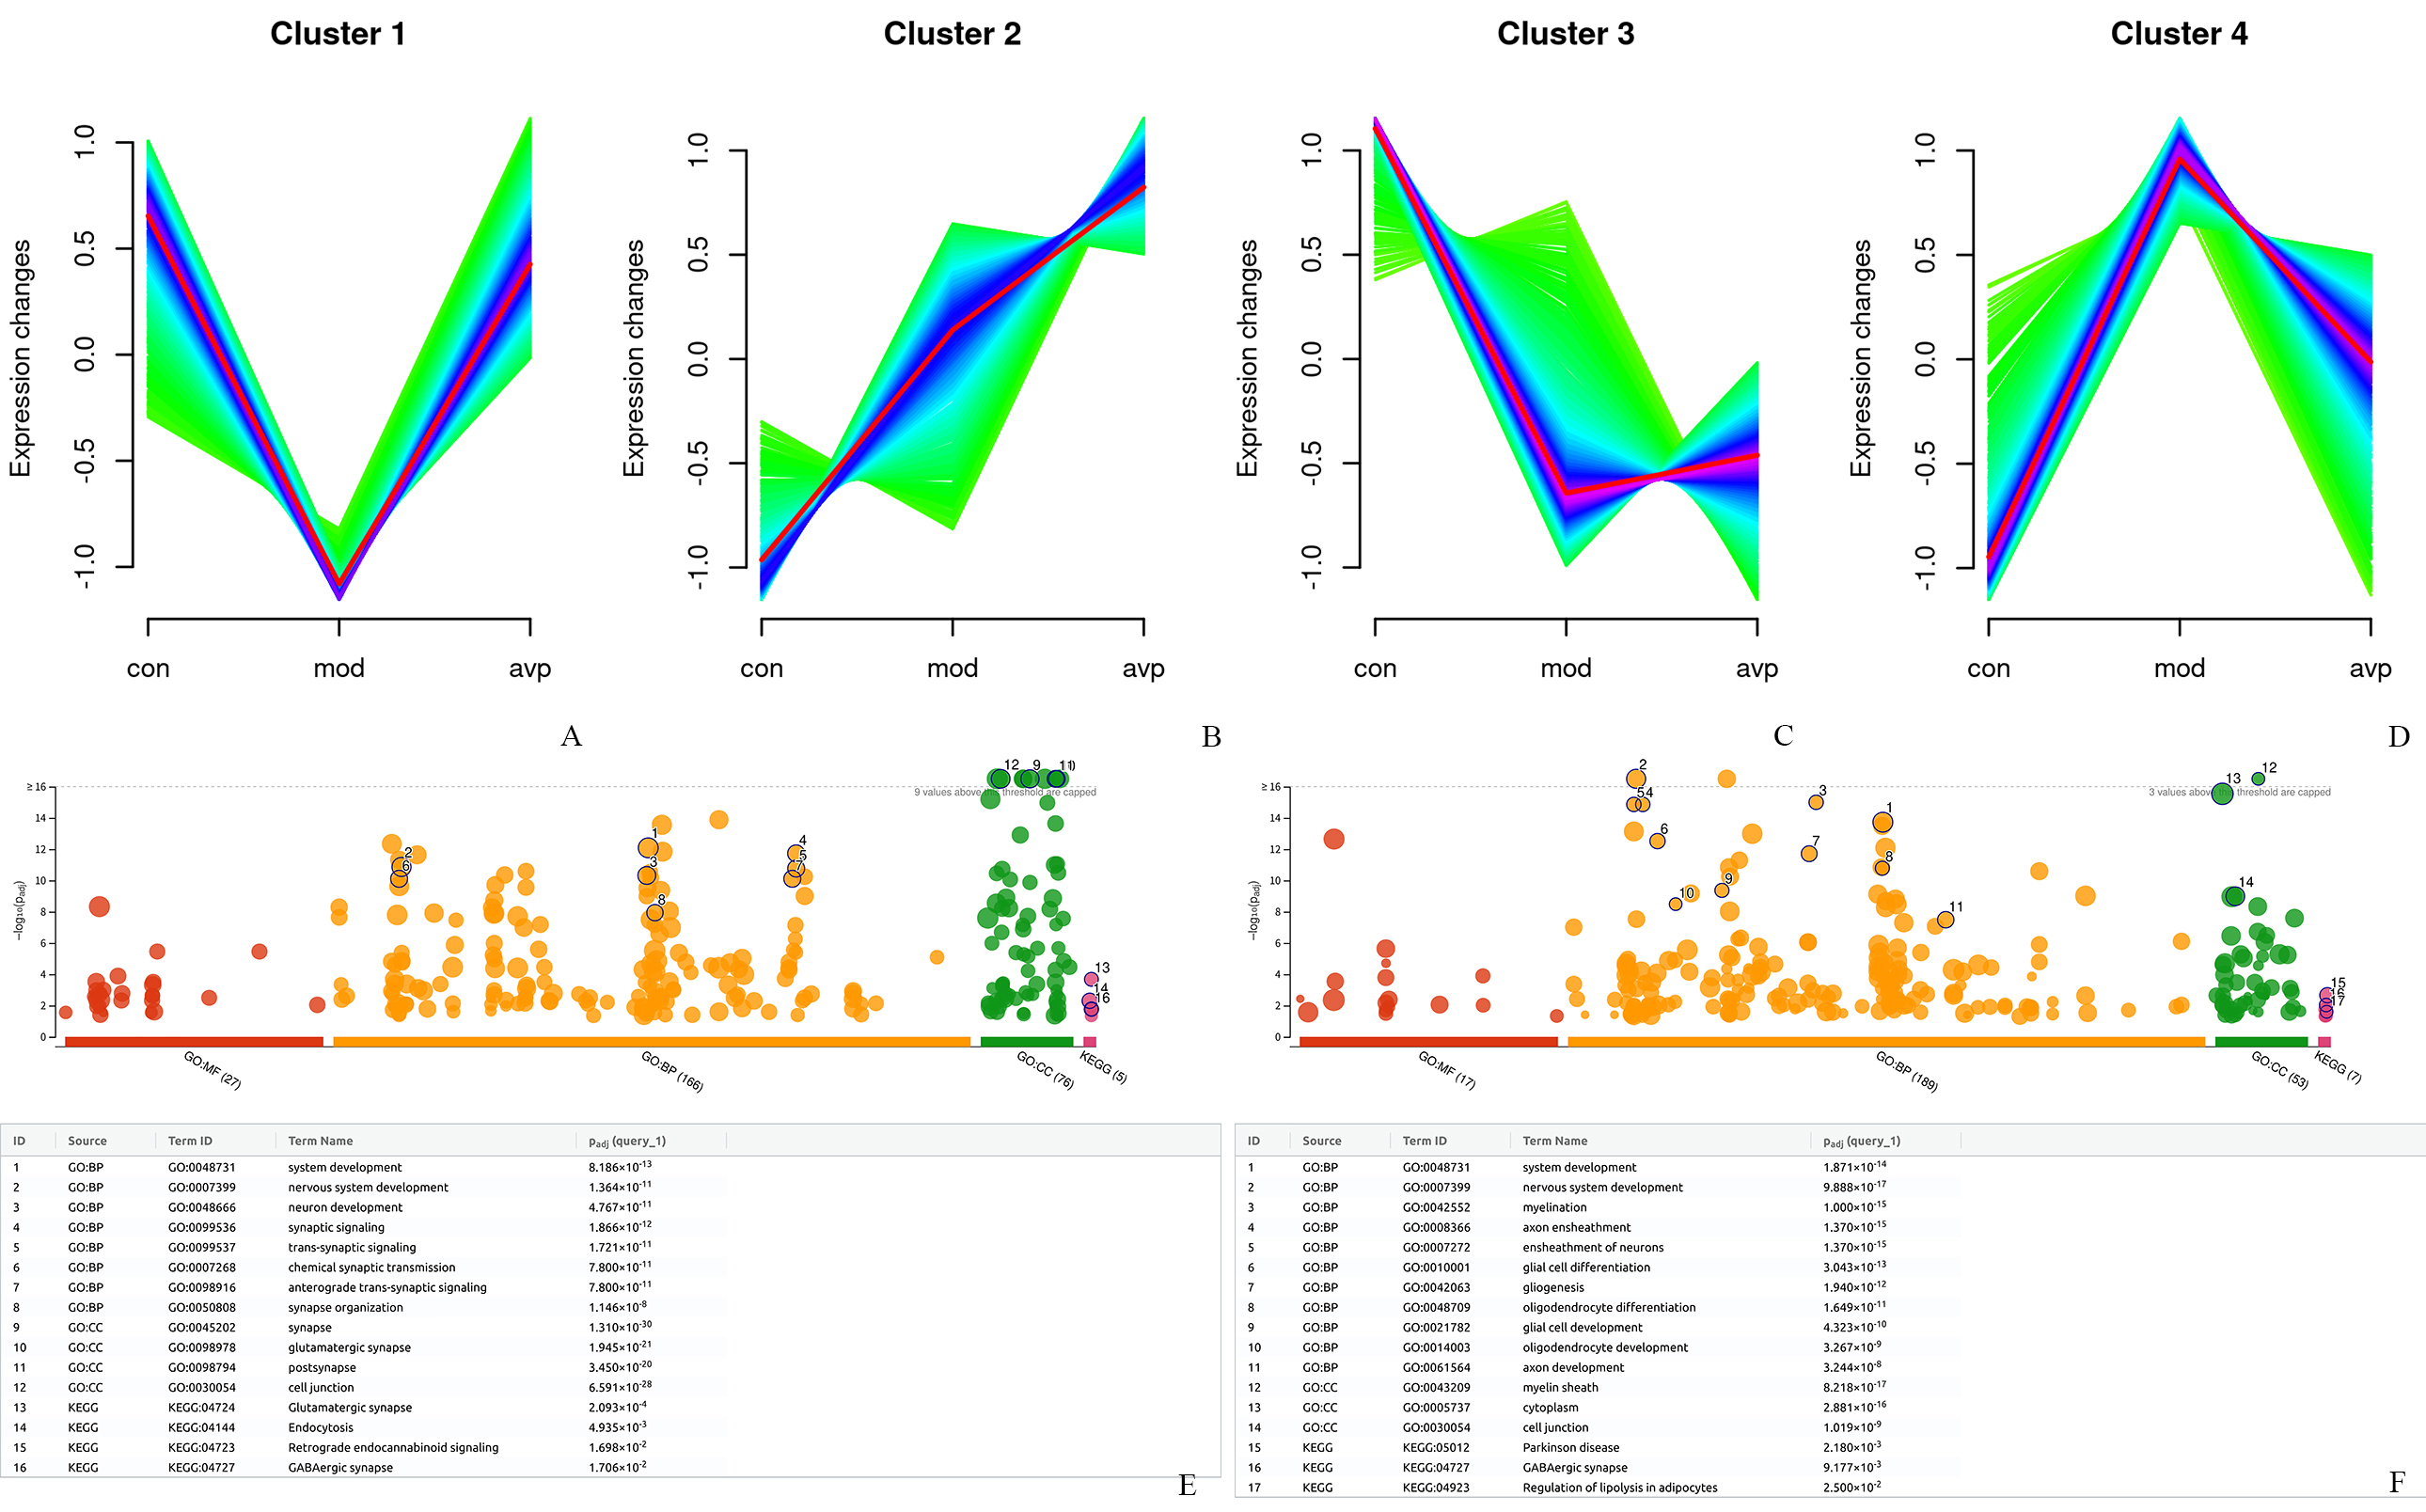 Fig. 6.
Dynamic expression patterns of genes. (A) Cluster 1, genes were downregulated in autism model and upregulated after AVP treatment. (B) Cluster 2, genes were consistently upregulated in the autism model and AVP groups. (C) Cluster 3, genes were continuous decreased in the autism model group and AVP group. (D) Cluster 4, genes were upregulated in autism model and downregulated after AVP treatment. Genes function analysis in cluster 1 (E) and cluster 4 (F).
The top 3000 most variable genes were selected to construct the co-expression
network, and the optimal soft threshold power
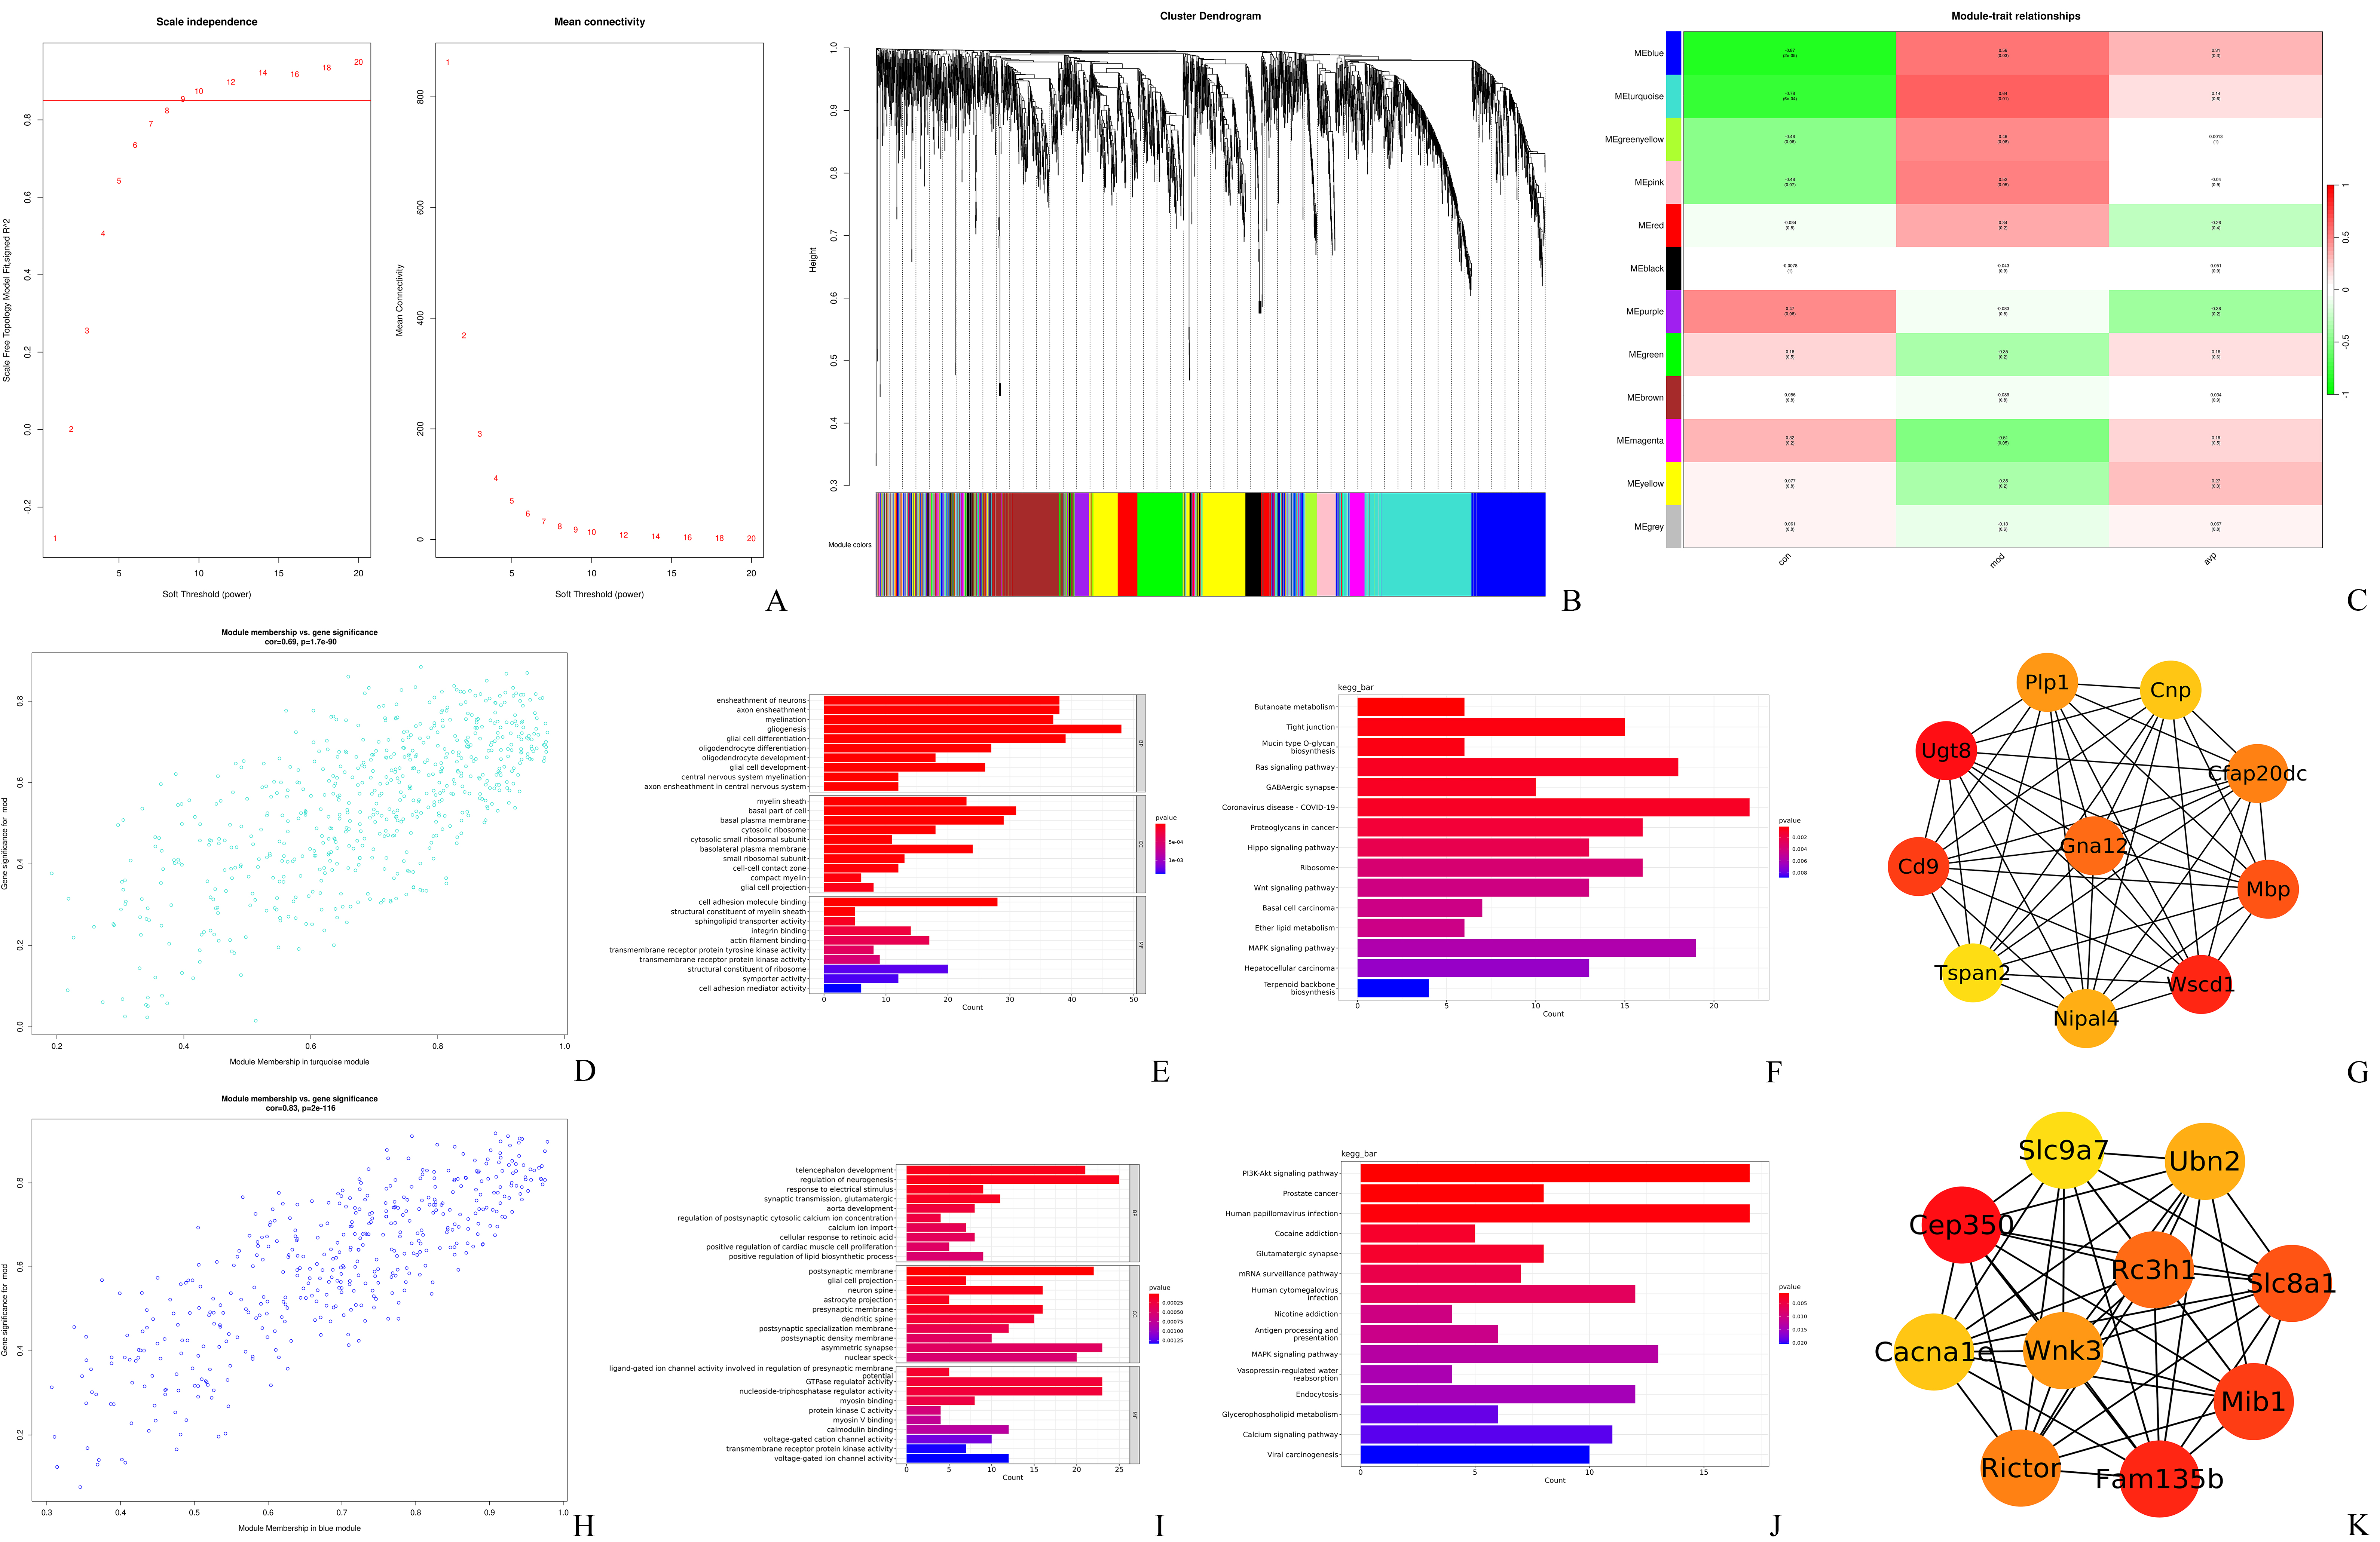 Fig. 7.
The results of weighted gene co-expression network analysis (WGCNA). (A) Scale-free index and mean connectivity analysis for different soft-threshold powers. (B) Module clustering dendrogram of genes. (C) Heatmap of the correlation between different modules and autism phenotype. (D) Scatter plot of the gene significance for the autism vs. the module membership in the turquoise module. (E) GO annotations of genes in the turquoise module. (F) KEGG pathway analysis of genes in the turquoise module. (G) Hub genes in the turquoise module. (H) Scatter plot of the gene significance for the autism vs. the module membership in the blue module. (I) GO annotations of genes in the blue module. (J) KEGG pathway analysis of genes in the blue module. (K) Hub genes in the blue module.
To identify the most biologically relevant functions of these significant differential modules in autism, functional annotations were identified by GO and KEGG pathway enrichment analysis. A total of 632 correlation genes were screened from the turquoise module for subsequent analysis (Fig. 7D). The main biological function of the turquoise module is to affect gliogenesis, glial cell differentiation, ensheathment of neurons, axon ensheathment, myelination, etc. (Fig. 7E). These genes primarily affected a series of pathways: the Ras signaling pathway, MAPK signaling pathway, PI3K-Akt signaling pathway, GABAergic synapse, and Ribosome (Fig. 7F). There were 453 correlation genes that were screened from the blue module for subsequent analysis (Fig. 7H); the most significant biological function for the blue module was telencephalon development, regulation of neurogenesis, synaptic transmission, calcium ion input, and regulation of postsynaptic cytosolic calcium ion concentration (Fig. 7I). Also, the genes primarily affected a series of pathways of the MAPK signaling pathway, PI3K-Akt signaling pathway, calcium signaling pathway, glutamatergic synapse, and dopaminergic synapse (Fig. 7J). Next, we visualized the hub gene in the most significant module in the protein-protein interactions (PPIs) network using the Cytoscape software (Fig. 7G,K).
The top 1000 most variable genes were selected to analyze the variation trend of various nerve cells. Our results showed that the proportion of oligodendrocyte (p = 0.004), astrocyte (p = 0.002), oligodendrocyte precursor cell (p = 0.003), and endothelial cell (p = 0.011) increased in autism model group, and decreased in oligodendrocyte (p = 0.018) and oligodendrocyte precursor cell (p = 0.035) after AVP treatment (Fig. 8).
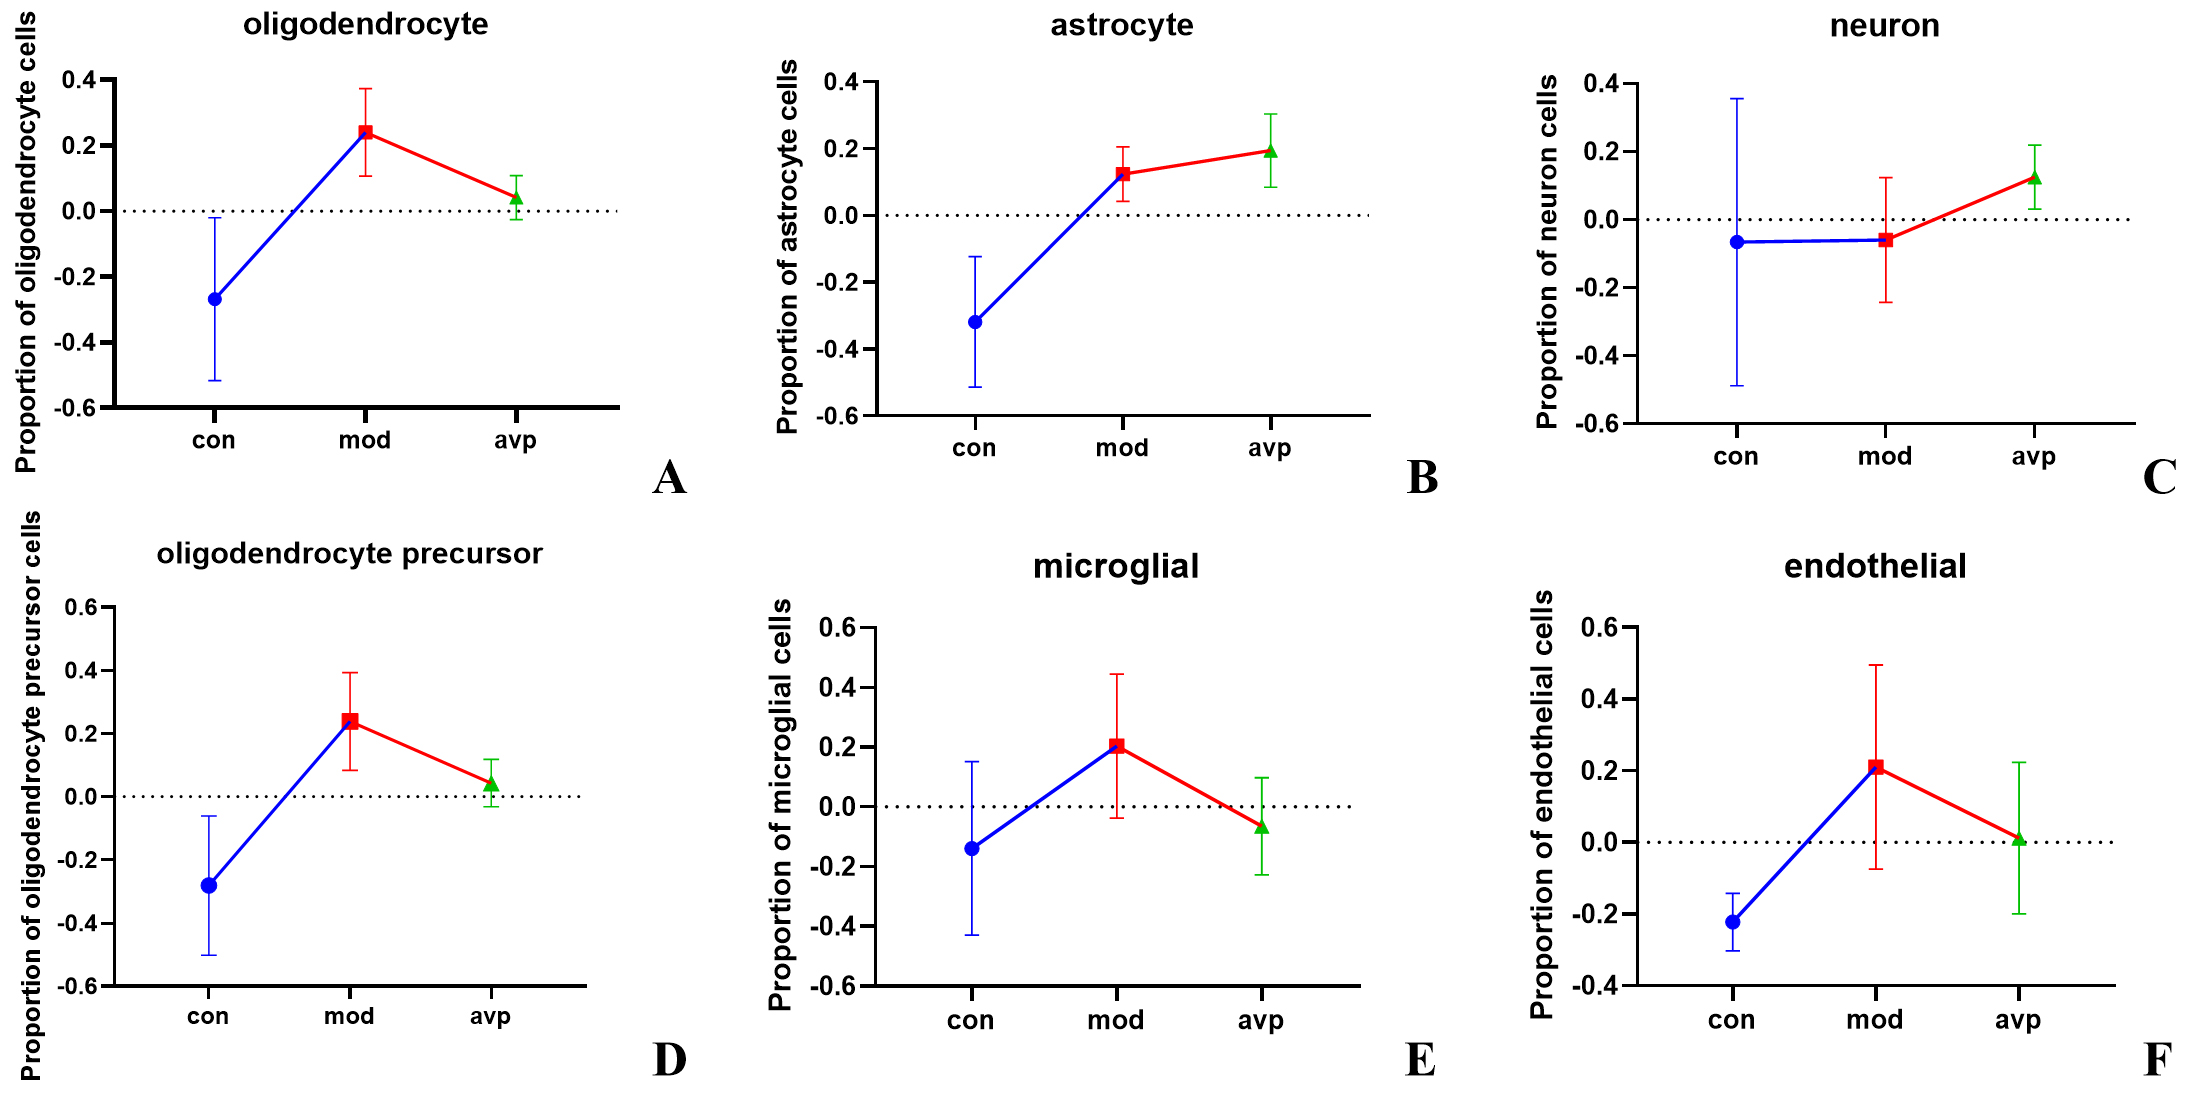 Fig. 8.
The global changes trend in cell-type proportions in each group. (A) The oligodendrocyte, (B) astrocyte, (C) neuron, (D) oligodendrocyte precursor cell, (E) microglia, and (F) endothelial cell.
In order to corroborate the findings of RNA-seq, qPCR was
used to assess the mRNA levels of genes implicated in myelin development
(Fig. 9). The mRNA levels of myelin development-related genes MBP,
PLP1, CNP, and the astrocyte-specific marker
GFAP gene were significantly increased in the autism model group
(p
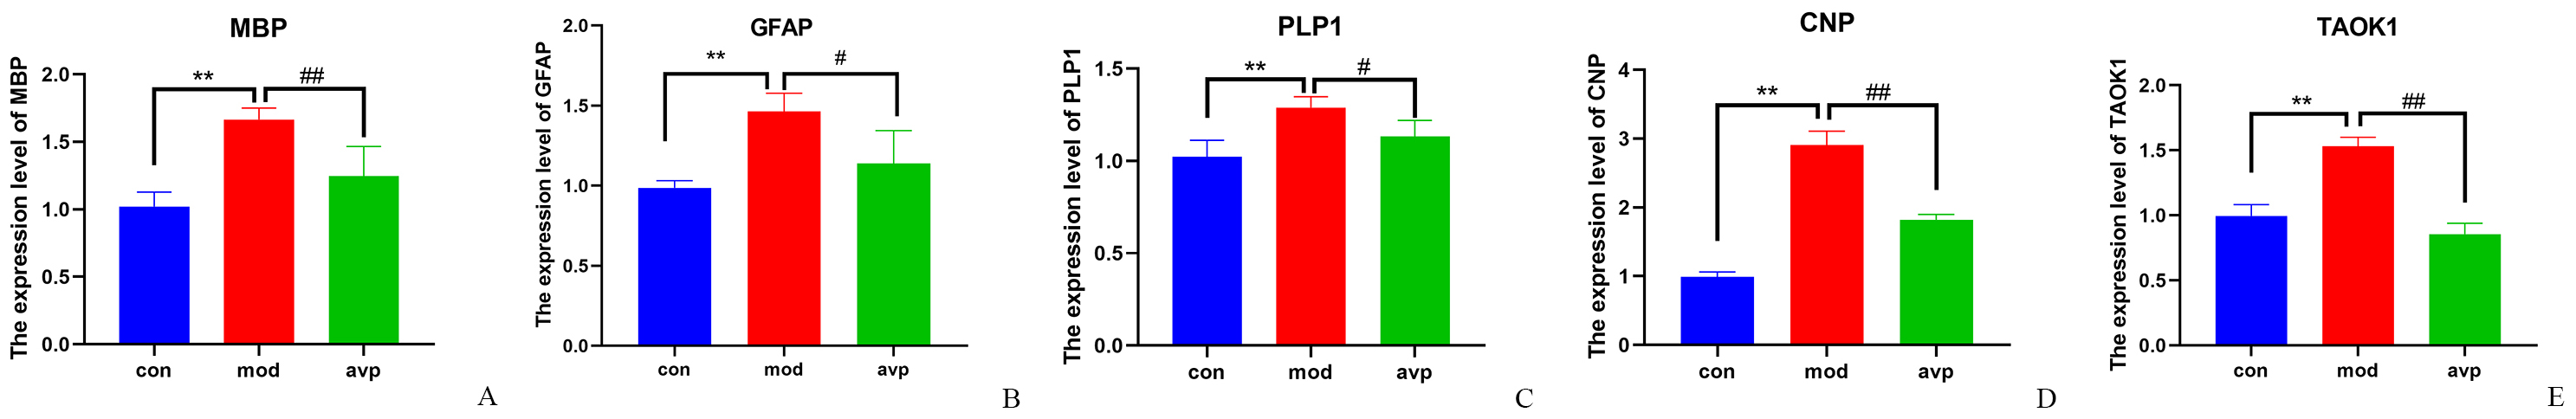 Fig. 9.
The relative levels of myelin related genes
mRNA. (A) MBP, (B) GFAP, (C) PLP1, (D) CNP,
and (E) TAOK1. Control group vs. autism model group:
**p
Our results showed that 6 myelin-related
genes were causally associated with autism (FDR
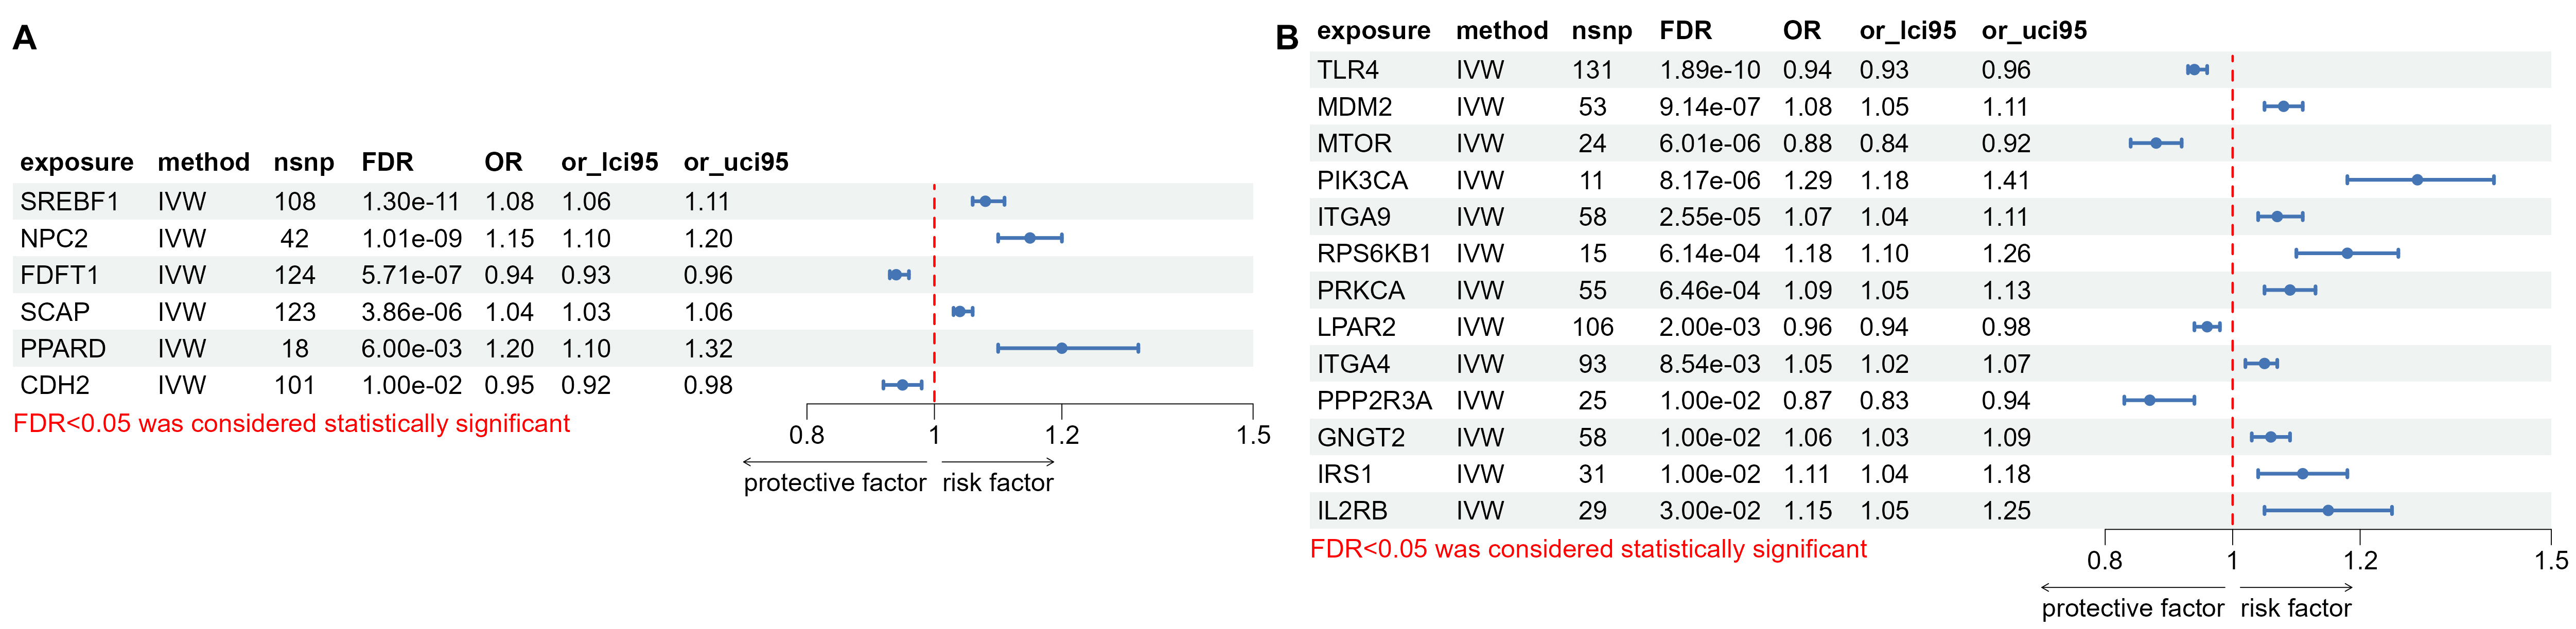 Fig. 10.
The results of mendelian randomisation analyses. Forest plots showed the causal associations between (A) myelin related genes (B) PI3K pathway related genes and autism spectrum disorder (ASD). PI3K, phosphoinositide 3-kinase; FDR, false discovery rate.
The study has confirmed that AVP can significantly improve social dysfunction in children with autism [16] and autism rat model [19, 44]; however, the underlying mechanism remains unclear. To gain further insight into the effects of AVP on the hippocampal and its possible mechanisms, we analyzed and compared the transcriptome profile alterations in the hippocampal ASD model both before and after AVP treatment. Our analyses identified 9 genes that were significantly upregulated in the autism model and significantly improved after AVP treatment. Two of these genes (AGO3 and TAOK1) were associated with a high risk for autism in SFARI. AGO3 is an important core protein in RNA interference (RNAi) pathways of eukaryotic cells. Recent genetic studies have confirmed that AGO3 missense mutation is associated with autism [45, 46] and other neurodevelopmental disorders [47]; however, the molecular mechanism remains unclear. TAOK1, a MAP3K serine/threonine kinase, has been demonstrated to participate in cytoskeleton regulation, neuron development, and other processes by regulating p38 MAPK, c-Jun N-terminal kinase (JNK), and Hippo signaling pathways [48, 49, 50]. The overexpression of TAOK1 resulted in disruption to neuronal morphology and migration, indicating that strict regulation of this gene during development is essential for the maintenance of normal neuronal function [51]. Seven of these genes, CNP (a myelin biogenesis related proteins expressed explicitly in differentiating oligodendrocytes in the central nervous system (CNS) [52, 53, 54]), MOG (myelin oligodendrocyte glycoprotein, a membrane bound protein found on the surface of oligodendrocyte cells and the outermost surface of myelin sheaths [55, 56]), MAG (myelin associated glycoprotein, expressed on the innermost myelin membrane wrap, enhancing long-term axon-myelin stability, helping to structure nodes of Ranvier, and regulating the axon cytoskeleton [57]), myo1d (myosin1D, which expressed in mature oligodendrocytes and required for myelin-like membrane formation [58, 59, 60]), Cldn11 (oligodendrocyte-specific protein, which is expressed exclusively in oligodendrocytes within the CNS, plays a pivotal role in the process of myelination [61, 62, 63]), GJC2 (gap junction protein gamma-2, a protein in gap junctions plaques localized on the cell bodies of oligodendrocytes in rodents [64, 65, 66]), and Ninj2 (nerve injury-induced protein 2, predominantly expressed in the oligodendrocyte lineage cells in CNS [67]) were strongly associated with myelin development. It is clear that increased hippocampal myelination is associated with autism and that AVP may improve autism symptoms by inhibiting hippocampal myelination.
Oligodendrocytes (OL) are the CNS cells that generate the multilayered myelin membrane sheath surrounds axons of vertebrate neurons, providing metabolic support to neurons and having an important role in maintaining axonal integrity and energy metabolism [68, 69, 70, 71, 72]. Abnormal myelination and a consequent breakdown of OL-axon communication have been increasingly linked to neurodevelopmental diseases, such as autism [73, 74]. Our findings showed that the differentiation of oligodendrocytes, development, and myelination-related biological processes was significantly increased in autism model group and improvement after AVP treatment. GSEA and dynamic expression patterns analysis also showed that genes/gene sets of these biological processes tended to increase in the autism model group and decrease after AVP treatment. WGCNA analysis further confirmed that these biological processes significantly positive correlation with autism phenotypes. The variation trend of various nerve cells also showed that the proportion of oligodendrocyte and oligodendrocyte precursor cells increased significantly in the autism model and significantly decreased after AVP treatment. Subsequently, we confirmed that OL and myelin development-related genes MBP (a structural component of myelin that is expressed exclusively in the myelinating glia [75]), PLIP (the most abundant membrane protein in CNS myelin, indispensable for the axon-supportive function of myelin [76]), and CNP were significantly up-regulated in autism and significantly improved after AVP treatment by qPCR. In addition, GFAP, a specific marker of astrocyte, was significantly upregulated in autism and improved after AVP treatment. Astrocyte may communicate with oligodendrocytes to support initial myelin, remyelination and regulating myelinated axon excitability and conduction speed [77, 78, 79]. Our results were consistent with the research results reported by Hien et al. [80], who found that biological processes associated with myelin sheath were upregulated in the Tsc2+/- hippocampal slices by ribosome profiling. In their study, Lee and Tilot et al. [81, 82] also found that the genes involved in OL development and myelination were significantly upregulated in the Ptenm3m4 mouse model. The abnormal increase of OL and myelin contributes to the ASD phenotype, not only disrupting myelination but also potentially disrupting the balance between axons and myelin production and supplying exceeding axonal demand, thus leading to aberrant myelination of neuronal cell bodies [83], and potentially changing the connectivity between the hippocampus and other brain regions [73, 84, 85]. The abnormal increase of OL and myelin in the hippocampus may be due to the promotion of cholesterol biosynthesis, myelin biogenesis, and protein synthesis by VPA [73, 81, 86].
The results of MR analysis further confirmed the causal relationship between hippocampal myelination-related gene expression and autism. Abnormal development of OL and myelination may be a fundamental mechanism of autism. AVP may significantly improve oligodendrocyte cell development and myelination in the hippocampus of autistic rats. In addition, consistent with our previous study [17], the PI3K-Akt signaling pathways were significantly enriched between the normal and model groups. WGCNA analysis also showed that PI3K-Akt signaling pathways were significantly associated with autism phenotypes. MR analysis also confirmed the causal relationship between hippocampal PI3K-Akt signaling pathway-related gene expression and autism. There was no significant effect on the PI3K-Akt signaling pathway after AVP treatment.
The present study has several strengths. First, to the best of our knowledge, this is the first study that examined hippocampal transcriptome changes in a rat model of autism before and after AVP treatment to provide a molecular basis for AVP treatment of ASD. Second, we analyzed the sequencing data using a combination of bioinformatic techniques, including threshold and threshold-free methods, and consistently found that genes associated with myelin development were highly expressed in ASD and significantly improved after AVP treatment. In sequencing data analysis, the threshold for differential gene filtering (such as fold change, FDR) is empirical data that significantly impacts the analysis results. However, different studies and tissues may use different thresholds, leading to differences in the top-change genes screened by each. The combination of threshold and threshold-free methods may prove an effective means of overcoming the issue of genes with moderate but meaningful expression being discarded by the application of a strict cut-off value (logFC and FDR). Third, qPCR was then used to validate the significantly altered genes, and MR was used to investigate the causal relationship between myelin development and ASD. Conventional transcriptome analysis only verifies the DEGs by qPCR, which can only indicate an association between the genes and disease, while their causal relationship needs to be further verified by a large number of experiments. The present study also has some limitations, such as fewer sequencing samples, testing only on a single animal model, less experimental validation, and others.
In summary, our results revealed that some hippocampal myelination and PI3K signaling pathway-related gene were causally associated with autism. AVP may significantly improve social dysfunction by regulating myelination and oligodendrocyte development in the hippocampus in autism models.
The datasets generated during and/or analysed during the current study are available from the corresponding author on reasonable request.
MW and XB designed the research study. MW and BZ conducted experiments. XB and BZ analyzed the data and writing original draft. All authors contributed to editorial changes in the manuscript. All authors read and approved the final manuscript. All authors have participated sufficiently in the work and agreed to be accountable for all aspects of the work.
Rat samples were obtained from Guizhou Medical University (SYXK2018-0001). All experiments were approved by Guizhou Medical University Animal Care and Use Committee (No.2200050).
We would like to express my gratitude to all those who helped me during the writing of this manuscript.
This work was supported by Basic Research Program of Science and Technology Department of Guizhou Province (ZK [2023]312).
The authors declare no conflict of interest.
References
Publisher’s Note: IMR Press stays neutral with regard to jurisdictional claims in published maps and institutional affiliations.