
†These authors contributed equally.
Academic Editors: Jia Meng, Graham Pawelec and Wei Chen
Background: The past decade has seen major advances in the use of artificial intelligence (AI) to solve various biomedical problems, including cancer. This has resulted in more than 6000 scientific papers focusing on AI in oncology alone. The expansiveness of this research area presents a challenge to those seeking to understand how it has developed. A scientific analysis of AI in the oncology literature is therefore crucial for understanding its overall structure and development. This may be addressed through bibliometric analysis, which employs computational and visual tools to identify research activity, relationships, and expertise within large collections of bibliographic data. There is already a large volume of research data regarding the development of AI applications in cancer research. However, there is no published bibliometric analysis of this topic that offers comprehensive insights into publication growth, co-citation networks, research collaboration, and keyword co-occurrence analysis for technological trends involving AI across the entire spectrum of oncology research. The purpose of this study is to investigate documents published during the last decade using bibliometric indicators and network visualization. This will provide a detailed assessment of global research activities, key themes, and AI trends over the entire breadth of the oncology field. It will also specifically highlight top-performing authors, organizations, and nations that have made major contributions to this research domain, as well as their interactions via network collaboration maps and betweenness centrality metric. This study represents the first global investigation of AI covering the entire cancer field and using several validated bibliometric techniques. It should provide valuable reference material for reorienting this field and for identifying research trajectories, topics, major publications, and influential entities including scholars, institutions, and countries. It will also identify international collaborations at three levels: micro (that of an individual researcher), meso (that of an institution), and macro (that of a country), in order to inform future lines of research. Methods: The Science Citation Index Expanded from the Web of Science Core Collection was searched for articles and reviews pertaining exclusively to AI in cancer from 2012 through 2022. Annual publication trends were plotted using Microsoft Excel 2019. CiteSpace and VOSViewer were used to investigate the most productive countries, researchers, journals, as well as the sharing of resources, intellectual property, and knowledge base in this field, along with the co-citation analysis of references and keywords. Results: A total of 6757 documents were retrieved. China produced the most publications of any country (2087, 30.89%), and Sun Yat Sen University the highest number (167, 2.47%) of any institute. WEI WANG was the most prolific author (33, 0.49%). RUI ZHANG ranked first for highest betweenness centrality (0.21) and collaboration criteria. Scientific Reports was found to be the most prolific journal (208, 3.18%), while PloS one had the most co-citations (2121, 1.55%). Strong and ongoing citation bursts were found for keywords such as “tissue microarray”, “tissue segmentation”, and “artificial neural network”. Conclusions: Deep learning currently represents one of the most cutting-edge and applicable branches of AI in oncology. The literature to date has dealt extensively with radiomics, genomics, pathology, risk stratification, lesion detection, and therapy response. Current hot topics identified by our analysis highlight the potential application of AI in radiomics and precision oncology.
Cancer is the leading cause of death and morbidity worldwide. In 2020, 19.3 million new cases of cancer were reported, with this number projected to increase over the coming few decades. By 2040, it is estimated there will be 30.2 million new cancer diagnoses annually [1]. Healthcare innovation, especially in relation to cancer care, must therefore be encouraged.
Early cancer diagnosis continues to be a challenge at the global scale. Statistics compiled by the United Kingdom’s national cancer registry show a strong correlation between cancer stage and 1-year cancer mortality, with some cancer subtypes having incrementally worse outcome as the stage increases [2]. As an example, the 5-year survival rate for lung cancer following resection of stage I disease is 70%–90%, but for all stages it is just 19% for women and 13.8% for men [3]. In 2018, 44.3% of all cancer patients in England were diagnosed with early stage disease (stage I or II), with the proportion being less than 30% for lung, esophageal, gastric, pancreatic, and oropharyngeal cancers [4]. Within the framework of a national goal, the National Health Service outlined a target rate for early diagnosis of 75% by 2028 [5]. Early diagnosis is one of the top priorities for several organizations, such as the World Health Organization and the International Alliance for Cancer Early Detection.
Early cancer detection and mortality from cancer can be improved by screening. However, public buy-in, financial considerations, and other factors limit the effectiveness of screening programs and do not cover all at-risk populations [6]. Moreover, the selection of patients and the risk-benefit trade-offs, even for established screening programs such as breast cancer, remain controversial. Indeed, it has been argued that a one-size-fits-all approach is at odds with the aim of personalized medicine [7, 8, 9]. Screening initiatives that are expanded without evidence-based indications can also be financially burdensome and waste valuable resources for budget-constrained health systems [10].
Novel cancer drugs have been introduced in the past few decades, but their cost-benefit ratios are suboptimal [10]. Oncologists face the dilemma of the same cancer having potentially different clinical outcomes in different sets of patients. Patients also demonstrate varying sensitivity to cytotoxic drugs. This can be explained by inter- and intratumoral heterogeneity of cancer tissues resulting from genetic variability, epigenetic alterations, and a heterogeneous tumor microenvironment. It is therefore critical that cancer treatments be made more accessible and personalized.
The development of new anticancer treatments is time-consuming and resource-intensive. Despite passing preclinical tests and clinical trials, new drugs often have low success rates. Patient enrollment into trials also remains challenging. Nevertheless, 18 (34%) of the 53 new Food and Drug Administration (FDA) approvals in 2020 were for anti-cancer treatments, with this trend likely to continue for the foreseeable future [11]. Fast-paced cancer research has created a glut of relevant literature, making it difficult for physicians to apply the latest recommendations in their practice.
A great deal of diversity exists in the data collected by oncology providers. In addition to physicians’ notes, some of the other complex data includes pathology, laboratory, radiology, and advanced molecular diagnostics reports [12]. Valuable clinical insights and analytics can be obtained from crude medical data, but this is highly dependent on appropriate extraction, processing, analysis, interpretation, and integration of data [12].
In light of the limited capacity of the human brain to process information, an alternative strategy is needed to synthesize the voluminous body of complicated and disparate data that results from multi-omics analyses. This means artificial intelligence (AI) is of potentially great benefit for the health and healthcare industry through its problem-solving capabilities. For example, patient signs and symptoms are usually assessed by clinical practitioners using their own experience and knowledge. Furthermore, diagnostic disciplines depend heavily on physicians being able to recognize patterns in data, such as images, and interpreting them within the patient’s context. Although disease can be diagnosed using this clinical information and data, the accuracy of diagnosis cannot be ensured and misdiagnoses cannot be avoided completely [13]. It has been demonstrated that reproducibility amongst physicians for several diagnostic tasks is less than desirable [14, 15]. In terms of treatment planning, accurate diagnosis is vital for improving patient outcomes, for grading of malignancies, and for monitoring patient response to treatment [16]. To meet the demands of precision medicine, more accurate diagnostics are therefore necessary to fill the gap between visual inspection and precision medicine [17]. Clearly, this aspect highlights the limitations of the human brain in assimilating large data samples [12]. In contrast, a great deal of data can be handled with ease by AI models. Due to the effectiveness and efficiency of learning from large samples and training from them, an integrated approach to data extraction and processing can generate more accurate diagnostic results [12]. The use of AI to detect and accurately quantify patterns in medical data could enhance diagnostic processes, resulting in greater efficiency and reproducibility, as well as a higher degree of accuracy and precision [18]. The accuracy of AI methods has even been reported to be superior to that of expert diagnoses [19].
AI currently offers a great opportunity to impact oncology-related problems. Advances in high-performance computing and deep learning (DL) strategies have started to reshape the landscape [20]. In particular, AI is being used in cancer detection, diagnosis, tracking, classification, prediction of treatment outcome, risk forecasting, molecular characterization of tumors and their microenvironment, identification of biomarkers with robust diagnostic and predictive utility, as well as in drug discovery and repurposing [21, 22]. There are currently more than 300 AI-related clinical trials registered at ClinicalTrial.gov [23], with seven randomized trials that evaluate the use of AI in medicine having already been published [24]. Recent work identified 97 clinical trials involving AI in cancer diagnosis, with most having launched after 2017 [25].
Recent developments in AI have led to unique insights in oncology through the collaboration of biologists with informaticians or computer scientists. Cancer detection models that employ AI can assist health centers to support the clinical verdicts of their experts without being compromised. As a result, AI and especially machine learning (ML) and DL have gained considerable traction in cancer research due to their versatility and ever-expanding use. There has been a large increase in the number of papers published, as evidenced by a literature search on AI tools and large datasets with historical clinical examples for the training of AI models [26].
Hence, the recent rapid growth of AI applications in oncology invites analysis of the publication patterns, global collaborations, intellectual components and trajectory of knowledge production, as well as the prevailing topics in this field. For example, 2749 papers were published between 1999 and 2020 on AI in prostate cancer [27], the third most commonly diagnosed tumor type worldwide [28]. The research field has evolved rapidly over the last five years, accounting for nearly half of all publications. Despite the vast amount of literature, collaborations between institutions and especially those in Asia remained scattered, reflecting inadequate resource-, intellectual- and knowledge-sharing [27]. Additionally, the majority of highly influential researchers were found to originate in the USA and Europe [27]. Co-authorship network analysis has proven useful to identify gaps and missed opportunities. Asian countries such as China have remarkable potential in this area, with the second highest number of published articles. This demonstrates a need for improved collaboration among the researchers already engaged in the field in order to facilitate the propagation of regional knowledge to a global audience.
Accordingly, it is timely to determine the current status of AI publications in the entire field of oncology, to identify gaps in the literature, to present suggestions on how to address those gaps, and to provide an overall view of the topic. By following the emerging research on this topic, well-informed readers are able to improve and expand their knowledge and determine the best direction for future research. To our knowledge, the global trends regarding AI-based cancer research have not been fully investigated, despite the important scientific progress to date.
One of the objectives of bibliometric analysis is to mathematically and statistically evaluate the pattern of scientific publications within specific topics, research areas, organizations, countries, or other domains. Bibliometrics has been used in various research fields to quantitatively, qualitatively, and structurally assess performance [29]. Researchers may use such outcomes to promote their work, write proposals, and obtain funding, as well as to identify hotspots, trends, and resources for collaboration.
Further, although bibliometrics is mostly involved with the quantification of scientific output and assessment of the quality and impact of that output, it is also helpful for depicting research structures and concepts, as well as their evolutionary paths [30, 31]. The use of bibliometric methods can therefore be advantageous for research synthesis, especially systematic studies, and for mapping the scientific community (science mappings) [32, 33].
By conducting bibliographic analysis of the literature, this study aims to fill the void relating to AI-based methods applied to cancer research. This will be achieved through a comprehensive bibliometric analysis that explores the productivity of global researchers, institutions, countries, and journals and their impact in this field. The knowledge structure of this set was also examined in terms of social structure (international collaboration network) and conceptual structure (co-occurrence network of keywords).
In line with the study’s purpose, the following research questions are posed:
The research question: What is the current state of knowledge regarding AI research in oncology and how has it evolved over time?
RQ1. How is the number of research articles published between 2012 and 2021 distributed?
RQ2. Which nations, institutions, and researchers are the most productive?
RQ3. What is the global network of collaboration among nations, institutions, and authors?
RQ4. Which nations, institutions, and researchers are the most prominent, as indicated by a high publication record and an outstanding bibliometric profile?
RQ5. Which journals have published the most articles?
RQ6. What are the primary research focuses of AI in cancer-related scholarly publications?
RQ7. Which oncology-related field has produced the most AI literature?
RQ8. What cancer type has been most extensively explored by AI?
RQ9. What are the trending themes (hot topics) for AI in oncology research?
RQ10. How can this bibliographic data be quantitatively evaluated and presented visually in a single article?
Some bibliometric studies have discussed cancer-related topics. Wu CC et al. [34] published a bibliometric analysis of 3423 papers related to comorbidity of cancer and pain for the years 2010 to 2019. They concluded the USA published the greatest number of articles, and that breast cancer was by far the most common cancer type in publications germane to this field [34].
Several studies have also been published that use science mappings, or bibliometric approaches and indicators, to provide an overview of AI subfields in various tumor types and to assess trends within knowledge domains.
Musa IH et al. [35] investigated the top theoretical contributions of the top 100 cited papers indexed in the Scopus database regarding AI and ML in cancer research from 1993 to 2019. The USA was found to have the most relevant publications and total citations, while Germany and Belgium boasted the highest ratio of collaboration in this field [35]. It was demonstrated that AI and ML enable technological advancement, particularly through the widespread application of artificial neural networks, DL, and ML techniques, as well as mammography-based models, convolutional neural networks (CNNs), and text mining techniques for cancer prediction, diagnosis, control, and prevention [35]. There was, however, a notable limitation in the citation analysis in that it takes time for citations to build, as the publication process is typically quite lengthy [36]. Research deviation is prone to occur when high-quality articles fail to achieve an ideal citation timing [36]. Accordingly, citation-only analysis more accurately reflects the status of the research field that existed in the past, rather than the current status of the research area under study. Furthermore, the study by Musa IH et al. [35] did not include the majority of potentially relevant studies. As a result, an overall picture of the research landscape for AI pertaining to oncology could not be obtained.
Likewise, Hanis TM et al. [37] used the Scopus and Web of Science databases to extract the top 100 cited publications involving breast cancer and ML studies published between 1993 and 2019. Their bibliometric analysis revealed that top institutions included the University of Chicago and the National University of Singapore, while the USA, Germany, and China had the highest participation [37]. Moreover, DL and breast imaging data have become increasingly prevalent in ML-based breast cancer research over the past decade [37].
Other studies that use bibliometric approaches combined with network mappings have been limited to providing an overview of the different branches of AI applied to different cancer types, such as DL applied to the classification of breast cancer images [38], ML-based breast cancer prediction [39], and AI for prostate cancer [27] and pediatric oncology [40].
Most analyses appear to have focused exclusively on subsets of AI applications such as ML or DL within specific tumor types, such as breast and prostate cancer. However, the full spectrum of AI-based oncology research has been underestimated. To date, there has been no formal characterization of AI’s contribution across the entire cancer spectrum. Consequently, a new and comprehensive bibliometric investigation is required to provide an up-to-date and detailed overview of the characteristics of the AI-based oncological literature.
The present study attempts to fill this gap by probing the bibliographic data of relevant publications to examine the implications of publication frequency, authors, organizations, nations, journals, references, and research topics. It does this with the aid of two mapping software tools, CiteSpace 5.8.R3 (Drexel University, Philadelphia, PA, USA) and VOSviewer v1.6.10.0 (Rapenburg 70, 2311 EZ Leiden, Netherlands). The clear and informative maps generated by this work reveal the key publications considered fundamental to the intellectual construction, while identifying the highly influential researchers and institutions that could serve as potential collaborative partners.
Data were obtained on April 19, 2022 from the Science Citation Index Expanded of the Web of Science Core Collection (WoSCC) of Clarivate Analytics. This bibliometric study analyzed documents related to AI in oncology and published between January 1, 2012 and January 1, 2022. The search strategy was developed based on previous work [27, 35, 37, 38, 39, 40] involving bibliometric descriptive analyses and science mappings of the literature related to AI in oncology. A brief overview of these previous studies and the full search strategy is described in the Supplementary Material and Supplementary Table 1.
Abstracts, authors’ names, article titles, journal names, keywords, and affiliations were collected and saved as plain text bibliographic records. These records were then imported into CiteSpace and VOSviewer for analysis.
The retrieved bibliographic information allows two types of analysis to be performed: (i) quantitative, which aims to produce a general overview of the scientific output in the domain of the study, i.e., distribution of documents, dynamics of literature production, most prolific sources (e.g., researchers, institutions, countries, and journals), and (ii) qualitative, which aims to identify the contributions and distinguishing features of documents that have been co-cited the most, co-occurring keywords, as well as prominent research groups and possible partnerships.
A keyword co-occurrence network was built using VOSviewer, a software tool for network analysis [41]. When two keywords occur together in a publication, their co-occurrence indicates the number of publications in which they are used together. In the VOSviewer diagram, the circle size indicates the number of publications that match the relevant keyword. The distance between two nodes and the width of the line connecting them indicate the degree to which the keywords co-occur. In other words, the closer two nodes are situated, the thicker the line connecting them, and the more likely there is to be a strong connection between them (keywords are used more frequently within a single article).
The visualization map created by CiteSpace has nodes and lines [42]. Nodes indicate different types of information, such as country, institution, author, keyword, and reference. The nodes of varying sizes represent the frequency, while the links between each node represent relationships associated with cooperation, co-occurrence, or co-citation.
VOSviewer was used to obtain co-occurring keyword networks. CiteSpace was applied to (1) construct author, country or region, organization, and keyword co-occurrence map; (2) perform co-citation analyses on journals and references; (3) present co-occurring keywords in a timeline view; and (4) identify keywords and references with strong citation bursts. The number of scientific papers published annually was displayed using Microsoft Excel 2019.
Research trends and topics were identified using several measures:
(i) Co-citation reference (document) network: The construction of co-citation networks is based on co-citation relationships that simultaneously link documents cited by other documents. Co-citations are weighted in accordance with their strength, with higher values indicating a greater likelihood that two or more references are cited together in a single article. It has been suggested that articles that are often co-referenced by a third document are likely to deal with similar or related topics [43]. Co-citation references provide an indication of the intellectual foundation composed of highly co-cited papers, whereas documents with high betweenness centrality can augment co-citation networks to demonstrate an intellectual base’s scholarly impact. In this sense, papers with a high number of co-citations and a high degree of betweenness centrality are referred to as intellectual turning points, i.e., papers that contribute significantly to domain advancement.
(ii) Co-occurring keyword networks: In co-occurrence analysis, paired data are counted within a collection unit, in this case, keywords. In order to create co-occurrence networks, co-occurring keywords were identified in the text, their frequencies calculated, and clusters of co-occurring keywords were then located [44].
(iii) Betweenness centrality: A node’s betweenness centrality is determined when two or more nodes are connected in the same region (Eqn. 1).
As shown in equation (1),
Thus, betweenness centrality serves to measure the importance of a node within a network. A node with a high centrality indicator acts as a bridge between different entities, since it lies on the shortest route between other nodes and serves to connect other elements of the network that may otherwise be fragmented if it were to be removed [45].
By calculating the betweenness centrality, it was possible to determine which entities (e.g., authors, countries, or institutions) bridge two or more clusters. Generally, nodes that have a betweenness centrality greater than 0.1 (i.e., those connected to at least 10% of other nodes) exert substantial influence on others, and as a result are typically surrounded by purple borders. Tthe thickness of the purple border increases in proportion to its betweenness centrality. Overall, a high centrality indicator denotes an entity’s high level of engagement with others, as well as its influence in the research field.
(iv) Citation burst: A measure of burstness is the rate at which change occurs. Bursts in the frequency (e.g., citation) of an entity (e.g., an author, reference, or keyword) across time indicate a period during which the frequency changes abruptly, thus detecting emergent items. In particular, the citation burst of an author, institution, or nation is defined by a high level of scholarly engagement.
This analysis also included networks of co-authors’ countries, networks of co-authors’ organizations, co-authorship networks and journal co-citation networks, all of which are indicators of the field’s intellectual structure.
Overall, 6757 documents were published, including 6281 articles (92.96%) and 476 reviews (7.04%). Fig. 1A shows a general trend of increasing scientific research output over time, which can be divided into two phases.
 Fig. 1.
The number of different document types published annually related to AI in oncology research. (A) The number of documents published annually related to AI in oncology research. (B) The number of reviews published annually related to AI in oncology research. (C) The number of original articles published annually related to AI in oncology research.
Growth rates remained relatively stable between 2012 and 2018, during which time the number of publications increased from 163 to 472. However, the number of publications has shown a rapid increase since 2018. Yearly publications reached 1539 in 2020 and increased further to 2255 papers in 2021.
Fig. 1B and Fig. 1C show the trends in output according to the type of scientific publication (reviews or original articles, respectively).
Authors from 502 institutions in 120 countries or regions contributed documents published in this theme. Table 1 lists the 15 countries, regions and institutions with the highest rankings. The top 15 countries or regions are distributed across four continents, with half of them in Asia. China contributed the most to this field (2300 documents, 34.04%), followed by the USA (1625, 24.05%) and India (620, 9.18%).
| Rank | Country | Centrality | Count (% of 6757) | Rank | Institution | Centrality | Count (% of 6757) |
| 1 | China | 0 | 2300 (34.04) | 1 | Sun Yat Sen Univ (China) | 0.06 | 167 (2.47) |
| 2 | USA | 0.05 | 1625 (24.05) | 2 | Fudan Univ (China) | 0 | 117 (1.73) |
| 3 | India | 0.14 | 620 (9.18) | 2 | Chinese Acad Sci (China) | 0.12 | 117 (1.73) |
| 4 | South Korea | 0.08 | 366 (5.42) | 3 | Shanghai Jiao Tong Univ (China) | 0.01 | 110 (1.62) |
| 5 | England | 0.18 | 348 (5.15) | 4 | Harvard Med Sch (USA) | 0.02 | 95 (1.40) |
| 6 | Japan | 0.03 | 331 (4.90) | 5 | Sichuan Univ (China) | 0.03 | 92 (1.36) |
| 7 | Germany | 0.06 | 321 (4.75) | 6 | Southern Med Univ (China) | 0.05 | 83 (1.23) |
| 8 | Canada | 0.03 | 269 (3.98) | 7 | Stanford Univ (USA) | 0.04 | 82 (1.61) |
| 9 | Italy | 0.01 | 261 (3.86) | 8 | Zhejiang Univ (China) | 0.02 | 81 (1.21) |
| 10 | Netherlands | 0.06 | 197 (2.92) | 9 | Mem Sloan Kettering Canc Ctr (USA) | 0.06 | 78 (1.15) |
| 11 | France | 0.02 | 177 (2.62) | 10 | Univ Texas MD Anderson Canc Ctr (USA) | 0.03 | 77 (1.13) |
| 12 | Saudi Arabia | 0.18 | 160 (2.37) | 11 | Seoul Natl Univ (South Korea) | 0.05 | 70 (1.03) |
| 13 | Iran | 0 | 160 (2.37) | 12 | Nanjing Med Univ (China) | 0.05 | 69 (1.02) |
| 13 | Australia | 0.04 | 153 (2.26) | 13 | Peking Univ (China) | 0.08 | 68 (1.00) |
| 14 | Spain | 0.08 | 143 (2.12) | 14 | China Med Univ (China) | 0.06 | 66 (0.97) |
| 15 | Pakistan | 0.17 | 128 (1.89) | 15 | Univ Toronto (Canada) | 0.12 | 65 (0.96) |
The analysis identified ten institutions located in China, four in the USA, and one each in South Korea and Canada. Sun Yat Sen Univ was ranked first for the number of published articles (167, 2.47%), followed by Fudan Univ (117, 1.73%), and Chinese Acad Sci (117, 1.73%).
England and Saudi Arabia exhibited the highest betweenness centrality (0.18), followed by India (0.14). The highest-ranked institutions for betweenness centrality were the Chinese Acad Sci and Univ Toronto (0.12).
Fig. 2 shows collaborations among countries or regions. China, the USA and India had larger node sizes in this network map, representing higher numbers of papers. The central countries for the network were England, Saudi Arabia, Pakistan, India, Poland, Sweden, and Brazil, given their worldwide cooperation. For example, England had close ties with the Netherlands, Sweden, Greece, North Ireland, Scotland, Brazil, Australia, Mauritius, Georgia, Myanmar, Iraq, Japan, and United Arab Emirates. The main collaborators with Saudi Arabia were Pakistan, Sudan, Egypt, Jordan, Palestine, Yemen, Bangladesh, Oman, and Scotland. The main countries that collaborated with Pakistan were South Korea, Spain, Qatar, Saudi Arabia, United Arab Emirates, Oman, Malaysia, Tajikistan, Kyrgyzstan, and Ecuador. India worked closely with Denmark, Peru, Chile, Uruguay, Poland, Uzbekistan, Costa Rica, Algeria, Czech Republic, Saudi Arabia, and Kazakhstan. Citation bursts were consistently found in England, Greece, Turkey, and Denmark, which indicates their large number of recent publications.
 Fig. 2.
Network of countries and regions related to AI in oncology research.
Analysis of institutional collaboration patterns showed two distinct groups of institutions that worked closely together (Fig. 3). One group of collaborators was comprised of Chinese Acad Sci, Shanghai Maritime Univ, Shanghai Univ, Univ Sci & Technol China, Tongji Univ, Hunan Univ, Univ Chinese Acad Sci, and Chinese Univ Hong Kong. The other collaborative network had Univ Toronto as the linking bridge and included Univ Hlth Network, Univ Oslo, Univ Ottawa, Ontario Inst Canc Res, Sunnybrook Hlth Sci Ctr, and Univ Athens. Univ Toronto and Mem Sloan Kettering Canc Ctr both published articles in this field that showed strong bursts.
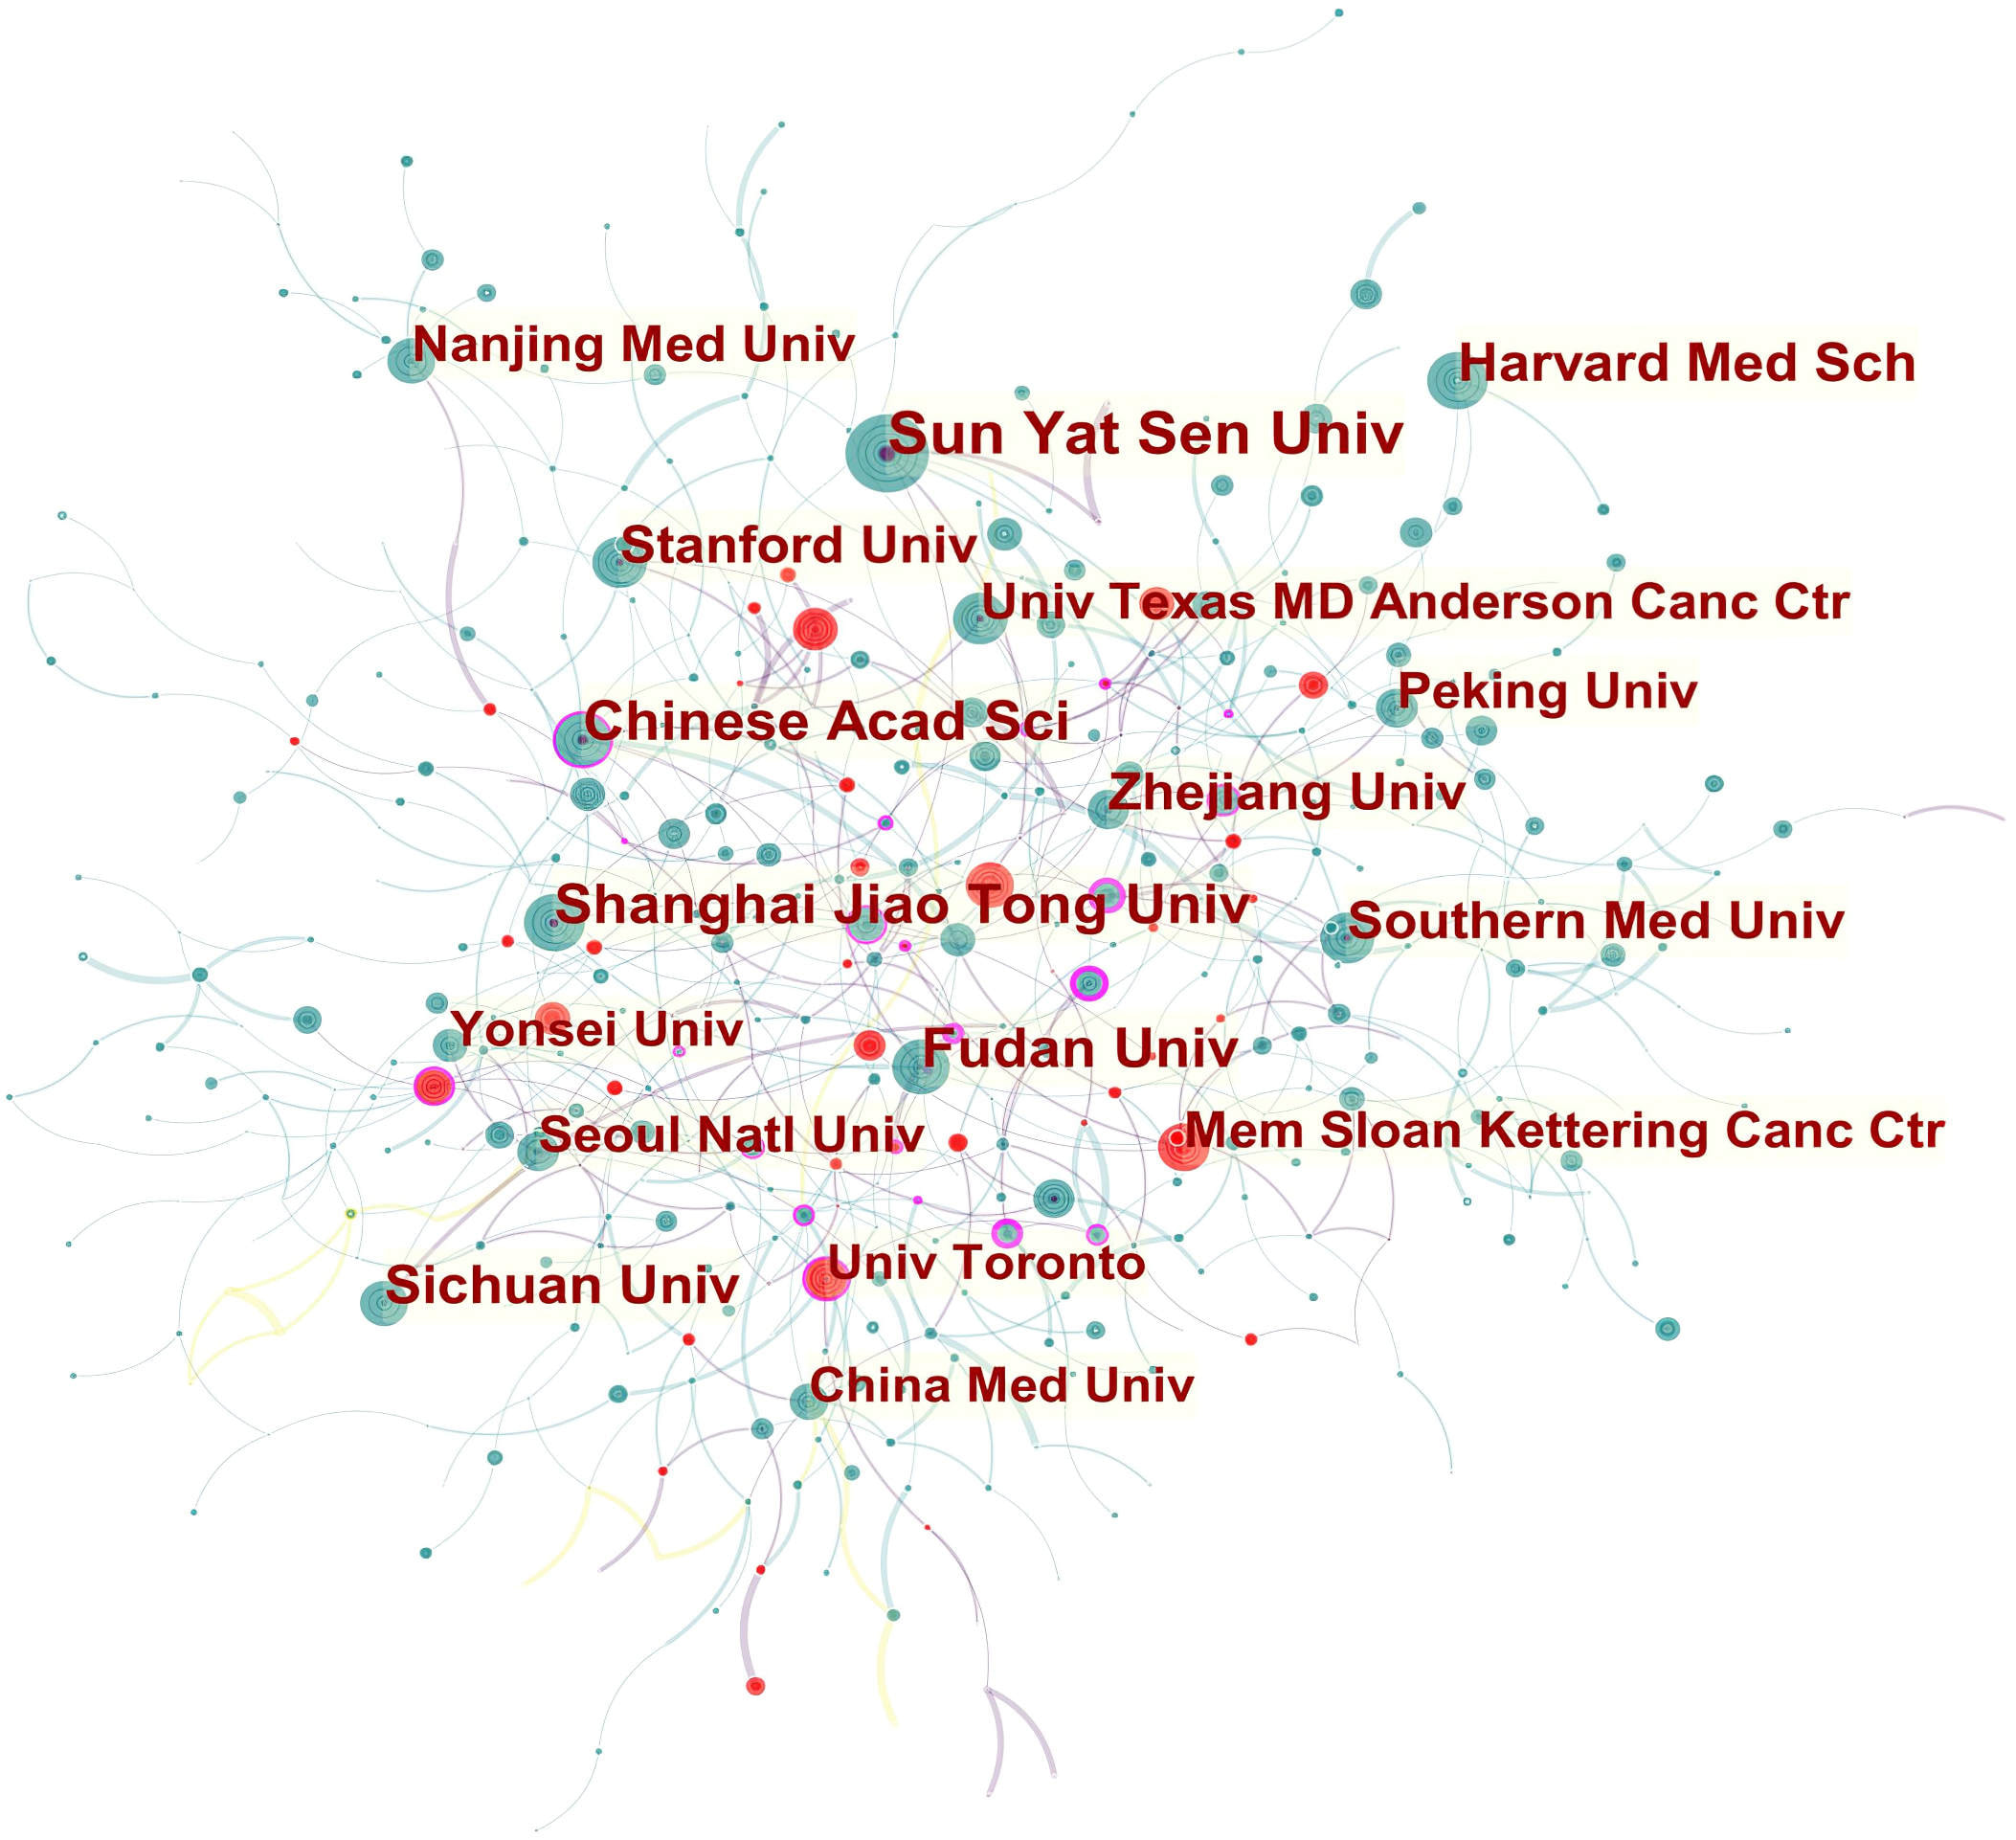 Fig. 3.
Network of institutions related to AI in oncology research.
A total of 334 authors were involved in the publication of these papers. The top 10 authors are listed in Table 2. WEI WANG (33, 0.49%) has the most publications, followed by JIE TIAN (28, 0.41%) and ELAI DAVICIONI (20, 0.30%). The top authors for betweenness centrality were RUI ZHANG (0.21), LEI ZHANG (0.14), CHEN CHEN (0.1), and JIE TIAN (0.1).
| Rank | Author | Count (% of 6757) | Centrality |
| 1 | WEI WANG (China) | 33 (0.49) | 0.01 |
| 2 | JIE TIAN (China) | 28 (0.41) | 0.1 |
| 3 | ELAI DAVICIONI (Canada) | 20 (0.30) | 0.09 |
| 4 | JING ZHANG (China) | 19 (0.28) | 0 |
| 4 | TITUS J BRINKER (Germany) | 19 (0.28) | 0 |
| 4 | ANANT MADABHUSHI (USA) | 19 (0.28) | 0 |
| 4 | CHEN CHEN (China) | 19 (0.28) | 0.1 |
| 5 | LEI ZHANG (China) | 18 (0.27) | 0.14 |
| 5 | YUDONG ZHANG (China) | 18 (0.27) | 0.01 |
| 6 | TOMOHIRO TADA (Japan) | 17 (0.25) | 0.04 |
| 7 | LEI CHEN (China) | 16 (0.24) | 0.04 |
| 7 | ACHIM HEKLER (Germany) | 16 (0.24) | 0.01 |
| 8 | ZAIYI LIU (China) | 15 (0.22) | 0 |
| 8 | CHRISTOF VON KALLE (Germany) | 15 (0.22) | 0 |
| 8 | JOCHEN S UTIKAL (Germany) | 15 (0.22) | 0 |
| 9 | RUI ZHANG (China) | 14 (0.27) | 0.21 |
| 9 | HUGO J W L AERTS (USA) | 14 (0.20) | 0.03 |
| 10 | QI ZHANG (China) | 13 (0.19) | 0.06 |
| 10 | DIRK SCHADENDORF (Germany) | 13 (0.19) | 0.01 |
| 10 | XIN CHEN (China) | 13 (0.19) | 0.03 |
| 10 | JING LI (China) | 13 (0.19) | 0.01 |
| 10 | DI DONG (China) | 13 (0.19) | 0.03 |
The collaboration network of co-authors showed that RUI ZHANG and LEI ZHANG occupied central positions (Fig. 4). Active collaborations were seen among RUI ZHANG, GANG CHEN, JUNMING JIAN, XINGYU ZHAO, and QI LI. LEI ZHANG had frequent communication with LI LIU, JUNMING JIAN, XINGYU ZHAO, and JIAN ZHOU.
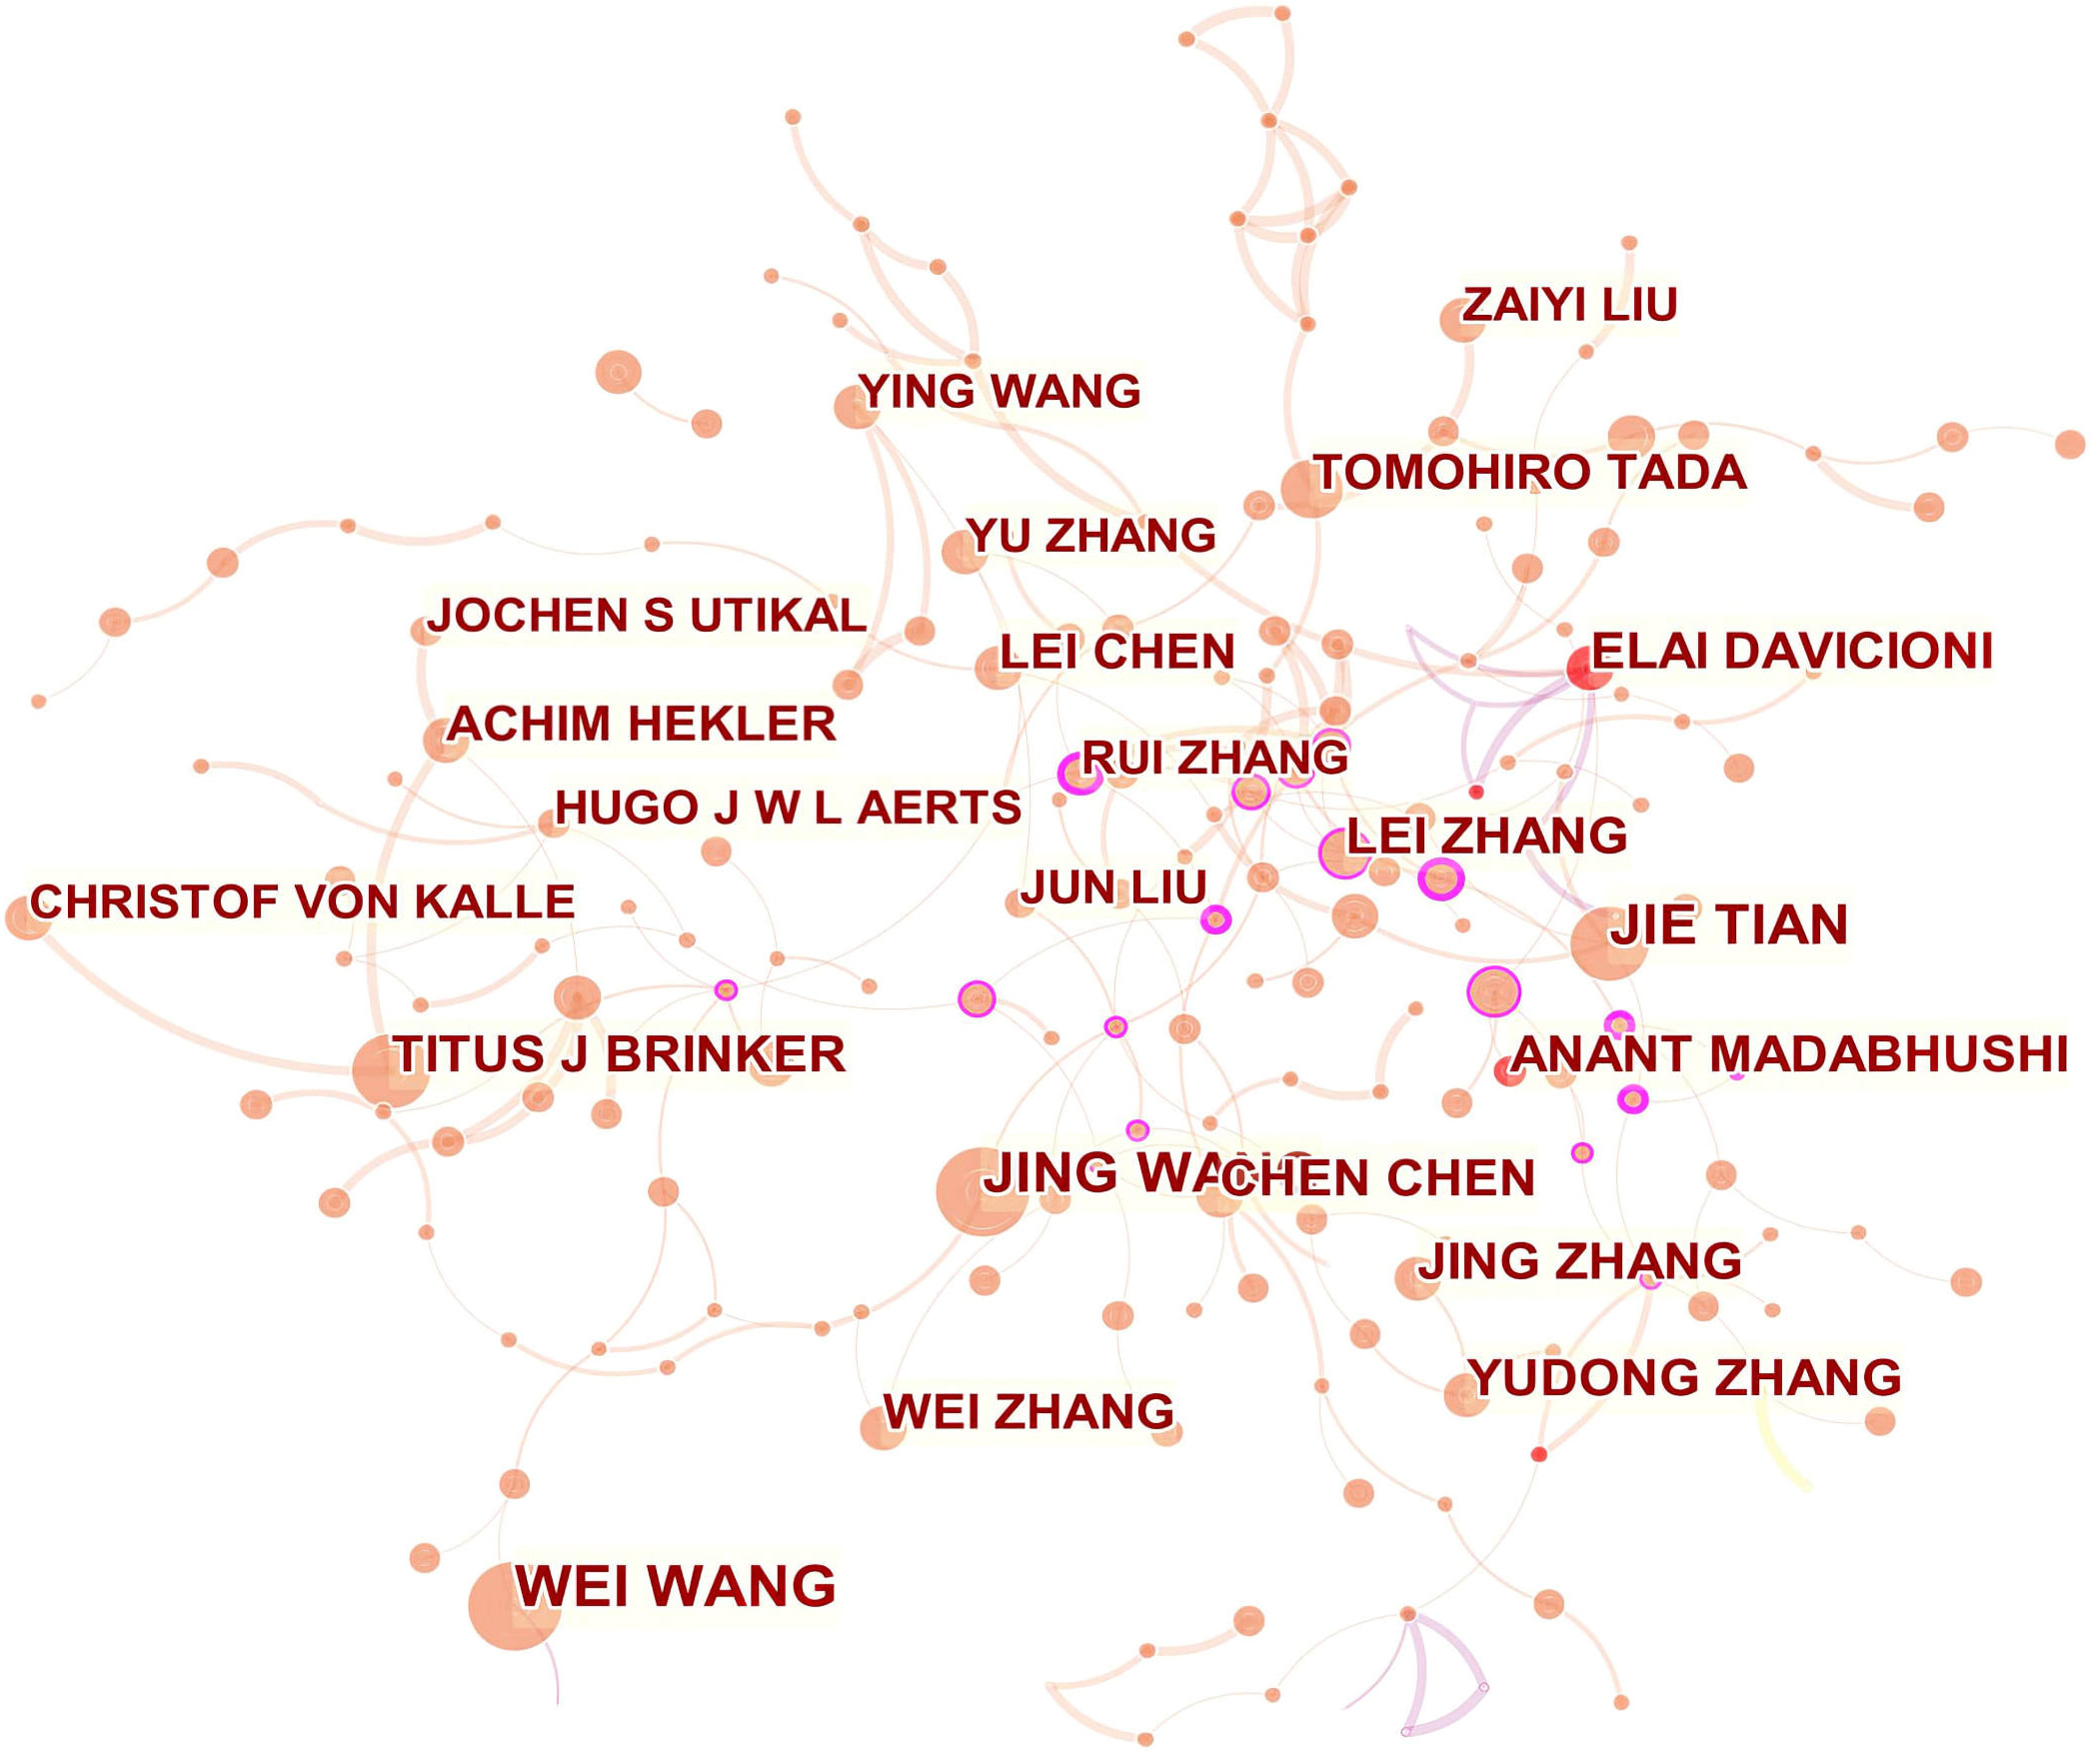 Fig. 4.
Network of authors related to AI in oncology research.
This research field was covered by 1311 academic journals. As shown in Table 3, Scientific Reports had the highest publication output (208, 3.08%), followed by Frontiers in Oncology (176, 2.60%), IEEE access: practical innovations, open solutions (158, 2.33%), and Cancers (156, 2.31%). Cancers had the highest impact factor (IF) of 6.639, followed by Frontiers in Oncology with an IF of 6.244, and Computer methods and programs in biomedicine with an IF of 5.428.
| Rank | Journal | Count (% of 6757) | IF | JCR | Rank | Co-cited Journal | Count (% of 136,929) | IF | JCR |
| 1 | SCIENTIFIC REPORTS (England) | 208 (3.08) | 4.379 | Q1 | 1 | PLOS ONE (USA) | 2121 (1.55) | 3.240 | Q2 |
| 2 | FRONTIERS IN ONCOLOGY (Switzerland) | 176 (2.60) | 6.244 | Q2 | 2 | SCIENTIFIC REPORTS (England) | 1878 (1.37) | 4.379 | Q1 |
| 3 | IEEE ACCESS (USA) | 158 (2.33) | 3.367 | Q2 | 3 | NATURE (England) | 1778 (1.30) | 49.962 | Q1 |
| 4 | CANCERS (Switzerland) | 156 (2.31) | 6.639 | Q1 | 4 | CA-A CANCER JOURNAL FOR CLINICIANS (USA) | 1708 (1.25) | 508.702 | Q1 |
| 5 | PLOS ONE (USA) | 132 (1.95) | 3.240 | Q2 | 5 | JOURNAL OF CLINICAL ONCOLOGY (USA) | 1634 (1.19) | 44.544 | Q1 |
| 6 | EUROPEAN RADIOLOGY (Germany) | 85 (1.26) | 5.315 | Q1 | 6 | NEW ENGLAND JOURNAL OF MEDICINE (USA) | 1469 (1.07) | 91.245 | Q1 |
| 7 | COMPUTERS IN BIOLOGY AND MEDICINE (USA) | 70 (1.04) | 4.589 | Q1 | 7 | RADIOLOGY (USA) | 1357 (0.99) | 11.105 | Q1 |
| 8 | MEDICAL PHYSICS (USA) | 66 (0.98) | 4.071 | Q1 | 8 | IEEE TRANSACTIONS ON MEDICAL IMAGING (USA) | 1353 (0.98) | 10.048 | Q1 |
| 8 | COMPUTER METHODS AND PROGRAMS IN BIOMEDICINE (Netherlands) | 66 (0.98) | 5.428 | Q1 | 9 | CLINICAL CANCER RESEARCH (USA) | 1340 (0.98) | 12.531 | Q1 |
| 9 | INTERNATIONAL JOURNAL OF IMAGING SYSTEMS AND TECHNOLOGY (USA) | 64 (0.95) | 2.000 | Q3 | 10 | CANCER RESEARCH (Germany) | 1277 (0.93) | 12.701 | Q1 |
| 10 | JOURNAL OF MEDICAL IMAGING AND HEALTH INFORMATICS (USA) | 63 (0.93) | 0.659 | Q4 |
Co-citation analyses show how frequently two specific items are mentioned simultaneously in another (document, author, journal, etc.). The papers published in this field were co-cited by 1327 scholarly journals. Table 3 shows that PloS one was the most co-cited journal (2121, 1.55%), followed by Scientific Reports (1878, 1.37%), and Nature (1778, 1.30%).
The 6757 publications related to AI in oncology research contained 1117 co-cited references. Upon viewing these publications, many dealt with the concepts of AI related to computer science, mathematics, and engineering. The number of times two publications were cited together by other publications is indicated by the co-cited references. Co-cited references provide a knowledge base from which previous articles draw [42]. Top references usually indicate the most relevant works in the field. The history of AI in computer science spans seven decades. Meanwhile, AI has incorporated knowledge from a number of other disciplines, including probability statistics, mathematics, and information engineering. Conseqently, it is not surprising that the top references are about AI theories and concepts in these fields. Over the last few decades, AI has grown significantly thanks to technological advances in computer science, mathematics, and engineering, as well as massive improvements in computing power that enable the compilation, sharing and analysis of large amounts of data [46]. Historically, Nordyke’s groundbreaking study from 1971 is widely credited with launching the field of AI in medicine [47, 48]. The use of AI in general medical applications and in specific specialties such as radiology, oncology, and pathology has grown considerably in recent years.
Our analysis identified the top original co-cited research articles that were germane to oncology (Table 4). In terms of co-citations, the article by Bray F et al. [49] entitled “Global cancer statistics 2018: GLOBOCAN estimates of incidence and mortality worldwide for 36 cancers in 185 countries” was ranked first (497), followed by “Dermatologist-level classification of skin cancer with deep neural networks”, by Esteva A et al. [50] in Nature. (372), “Cancer statistics, 2019.”, authored by Siegel RL et al. [51] in CA: a cancer journal for clinicians (218), and “Radiomics: Images Are More than Pictures, They Are Data”, published by Gillies RJ et al. [52] in Radiology (206).
| Rank | Reference | Journal | Citation | Year |
| 1 | Global cancer statistics 2018: GLOBOCAN estimates of incidence and mortality worldwide for 36 cancers in 185 countries | CA: a cancer journal for clinicians | 497 | 2018 |
| 2 | Dermatologist-level classification of skin cancer with deep neural networks | Nature | 372 | 2017 |
| 3 | Cancer statistics, 2019 | CA: a cancer journal for clinicians | 218 | 2019 |
| 4 | Radiomics: Images Are More than Pictures, They Are Data | Radiology | 206 | 2016 |
| 5 | Diagnostic Assessment of Deep Learning Algorithms for Detection of Lymph Node Metastases in Women With Breast Cancer | JAMA | 176 | 2017 |
| 6 | Classification and mutation prediction from non-small cell lung cancer histopathology images using deep learning | Nature medicine | 173 | 2018 |
| 7 | Clinical-grade computational pathology using weakly supervised deep learning on whole slide images | Nature medicine | 98 | 2019 |
| 8 | Predicting non-small cell lung cancer prognosis by fully automated microscopic pathology image features | Nature communications | 77 | 2016 |
| 9 | Deep learning as a tool for increased accuracy and efficiency of histopathological diagnosis | Scientific reports | 76 | 2016 |
| 10 | End-to-end lung cancer screening with three-dimensional deep learning on low-dose chest computed tomography | Nature medicine | 74 | 2019 |
By identifying the major topics that occur together more frequently, keyword co-occurrence creates thematic clusters based on bibliographic information. The major themes and trajectory of the intellectual foundation of this field were identified using keyword co-occurrence analysis.
VOSviewer can unpack the co-occurrence network of keywords with its filtering capabilities. Initially, irrelevant keywords were removed and the keywords of various documents were unified based on their style of writing in order to avoid over-saturation of one keyword in the network map. For example, the term “liver cancer” and its variants (such as “hepatoma” and “hepatocellular carcinoma”) were merged. Eventually, 764 co-occurring keywords were identified. By excluding keywords that co-occurred less frequently (less than 10 times), a network of 432 co-occurring keywords with nodes and links was constructed using a modularity-based clustering method (Fig. 5). Different colors designate separate clusters of keywords. Six predominant clusters were identified based on the co-keyword analysis (Fig. 5). The clusters of circles with similar colors indicate topics that are related among these keywords. Each cluster represents a unique research theme in the field of AI applied to oncology.
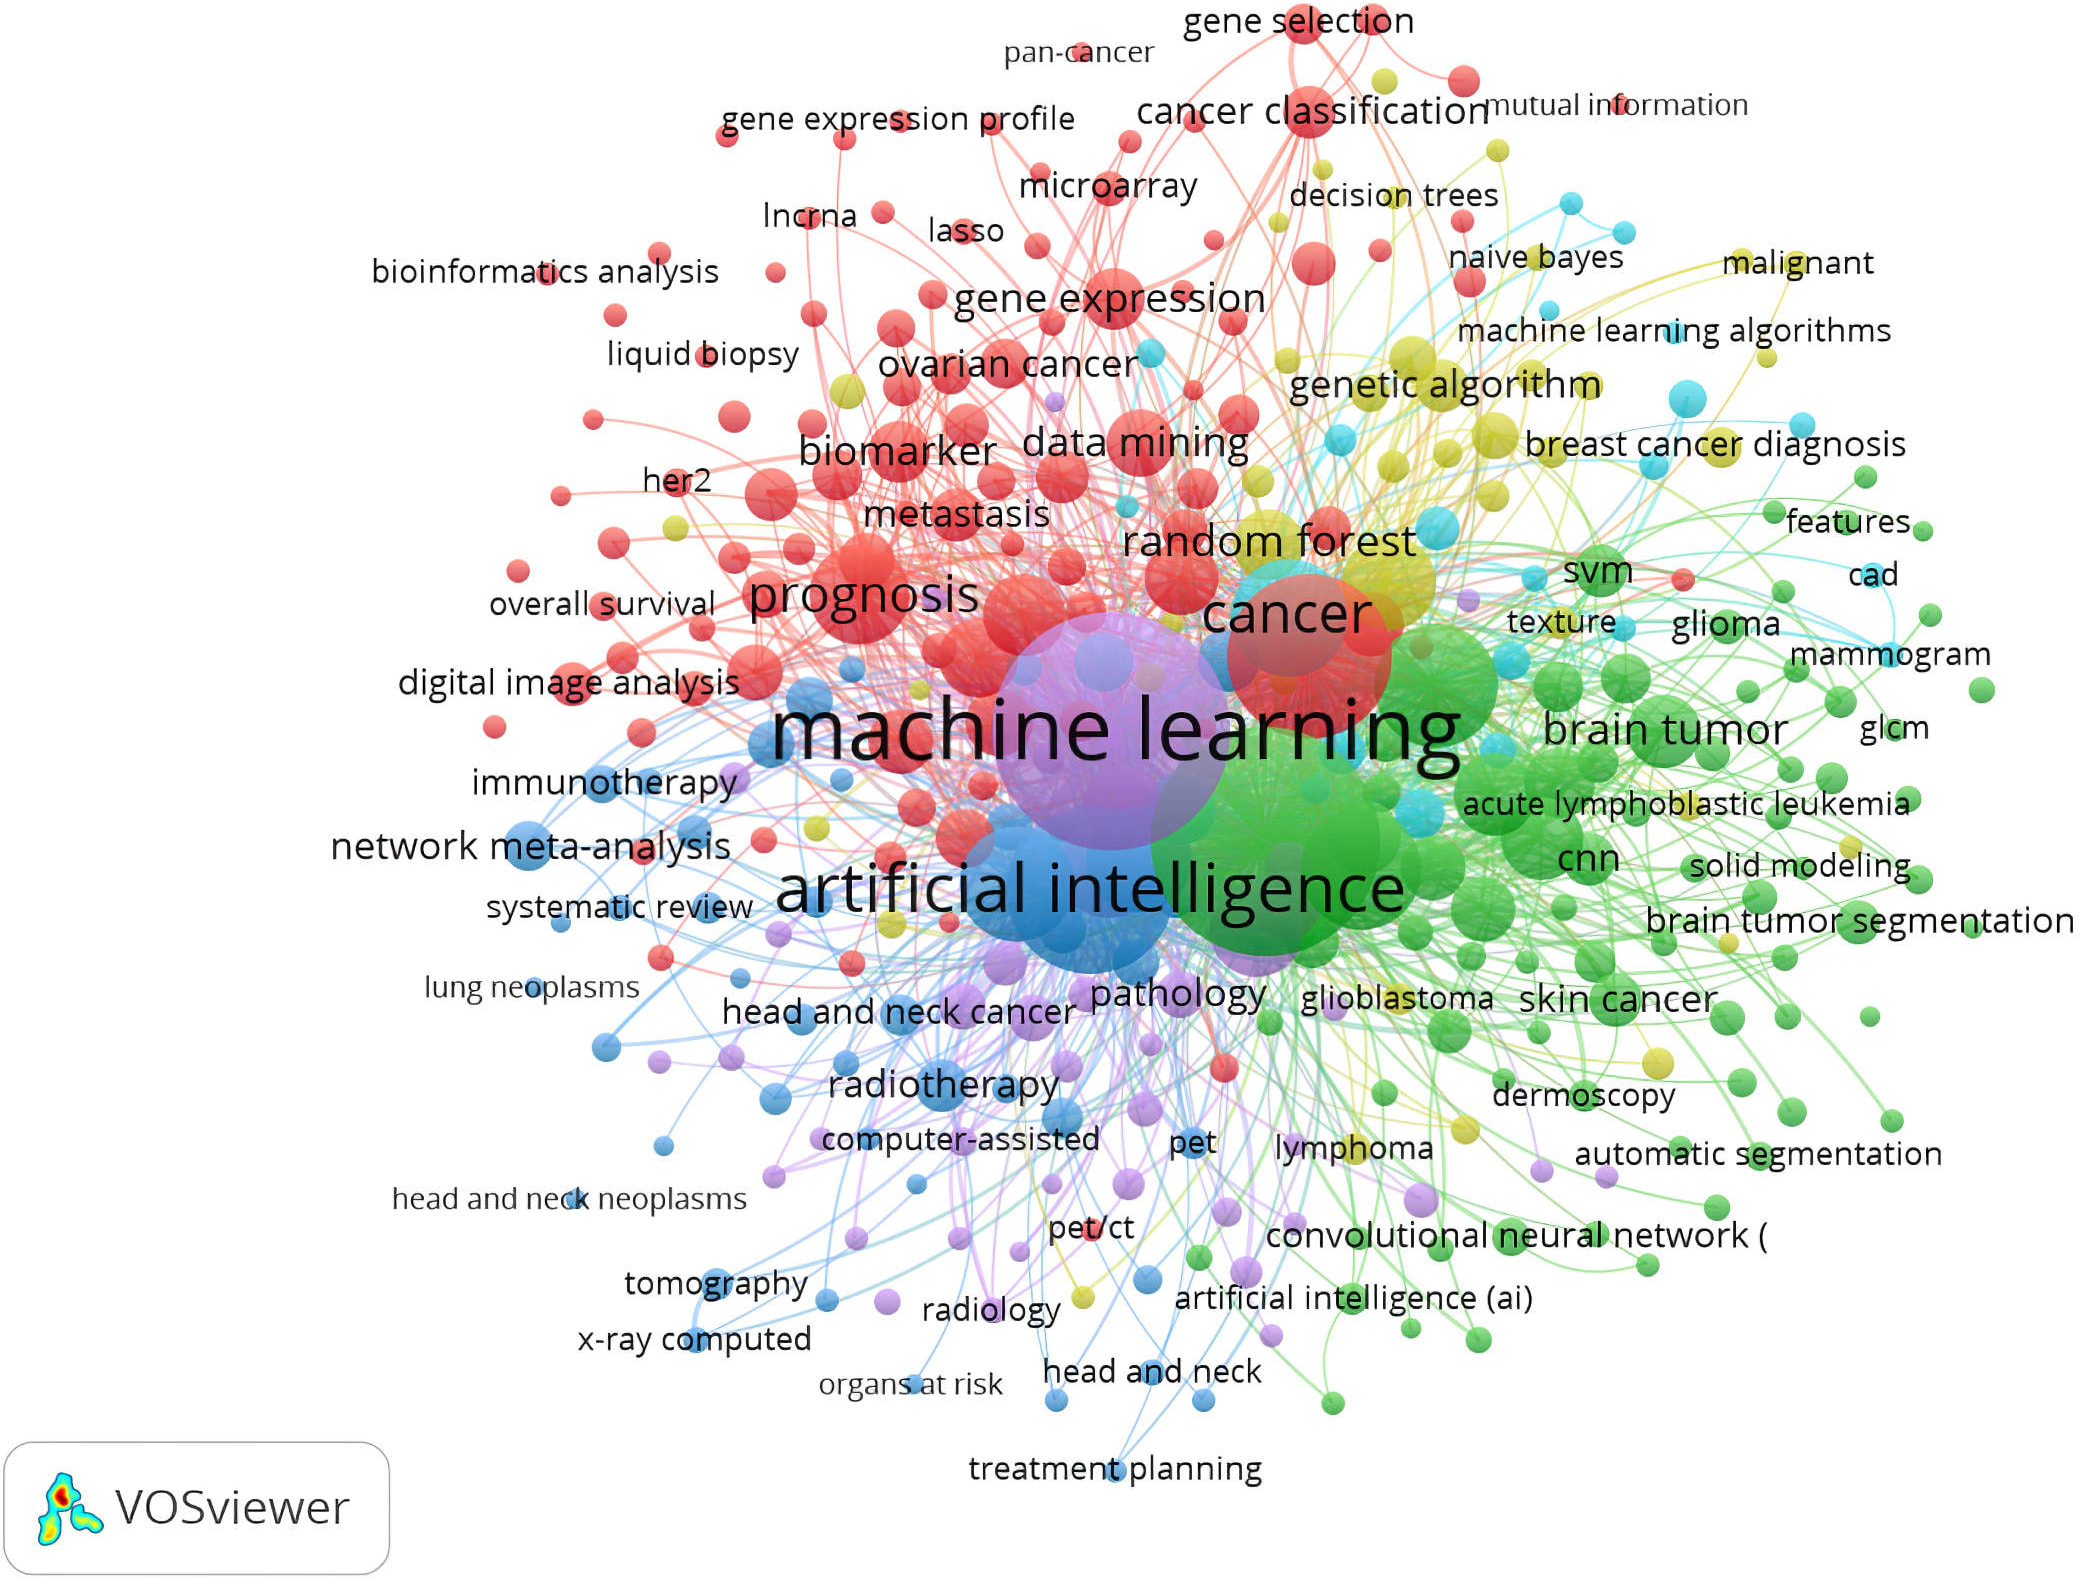 Fig. 5.
Co-occurrence of keywords in documents related to AI in oncology research.
Cluster 1 (Green): With keywords including “segmentation”, “glioma”, and “CNNs”, this cluster represented radiomics, particularly with regard to tumor segmentation. Precise segmentation is vital in order to achieve accurate radiomics analysis. The need for segmentation arises in the context of determining the volume of a cancer in the clinical setting. Implicit segmentation is necessary in order to delineate the boundaries of lesions and whether the tumour is measured along the long axis or along the short axis. Additionally, specific growth patterns and tissue changes are associated with malignant tumors. Parts of the tumor are segmented or compartmentalized, such as a solid enhancing portion, necrotic core, non-enhancing portion, and perifocal edema. These segments must be contoured for planning the radiotherapy based on measurement of the gross tumor volume and the clinical target volume, as well as for imaging after tumor resection [53]. Segmentation is also needed for research purposes, such as extracting image features from tumors. Currently, segmentation is performed either manually or by processing with software and using templates from standard atlases to identify structures. Neither method is ideal in terms of efficiency and accuracy.
Tumors can be segmented automatically or semi-automatically using AI techniques, thereby reducing time and improving accuracy. These benefits, along with the necessity for AI in oncology research, have led to attempts at automatic or semi-automatic tumor segmentation for the majority of tumor types [54, 55, 56, 57, 58]. For example, ML allows for fast and reliable segmentation of brain tumors using voxel-level classification that determines whether an individual voxel corresponds to normal brain tissue, glioma, or edema, and extracts those characteristics. Currently, segmentation tools use CNNs and classifier methods such as support vector machines and random forests [59, 60, 61]. These methods can aid in tumor segmentation, but their efficacy must be established prior to use in clinical practice.
Cluster 2 (Yellow): This cluster included “radiotherapy”, “immunotherapy”, and “chemotherapy”, and is centered on therapy response. AI can predict treatment response by analyzing tumor characteristics in radiologic images [62, 63, 64]. Imaging-based ML algorithms have been used to predict neoadjuvant chemotherapy response in various cancer types [65, 66, 67]. Bitencourt and colleagues described the performance of an ML model for predicting pathologic complete response in HER2-overexpressing breast cancer based on clinical MRI parameters and radiomic MRI features [68]. This performed similarly to meta-analyses based on post-treatment MRI results, where pooled sensitivity and specificity for residual disease ranged from 63–88% and 54–91%, respectively [69]. Furthermore, Sun R et al. [70] employed an AI technique to analyze RNA sequencing data and CT images from patients with malignant tumors. This successfully forecast radiomic markers and clinical results after anti-PD-1 or anti-PDL1 immunotherapy. The development of pharmacogenomics-based models for predicting individual treatment response has also been investigated [71]. The effect of chemotherapy drugs, such as gemcitabine and taxol, were predicted by an ML algorithm based on the patients’ genetic profiles [72].
Cluster 3 (Purple): This cluster was mainly focused on risk stratification and included keywords such as “risk prediction”, “cancer screening”, and “information extraction”. The organization of useful screening programs relies on accurate identification of high-risk patients. AI-based models with acceptable accuracy allow risk-stratification definitions to be refined and can also impact cancer screening recommendations. For example, ML has shown good results for predicting the risk of breast cancer [73]. Yala A et al. [74] reported that ML-based classifiers can accurately predict breast cancer risk within five years (area under the Receiver Operating Characteristic curve, AUC = 0.70).
Such AI models may be useful at the populational level. They could help to identify and benefit people with high cancer risk who are not covered by the current screening guidelines. Intensive risk-based recommendations may improve outcomes for sporadic colorectal cancer patients with early onset disease and limited screening options [75].
People who are at low risk for cancer development may elect not to be screened even though they are included in current screening recommendations, resulting in significant impact on the opportunity cost of the system [76]. This would allow for shared decision-making between the patient and doctor, as well as reducing inefficient and potentially harmful interventions.
Of even greater interest would be the potential application of AI for cancers for which no well-established screening method exists, such as lung and pancreatic cancer. This could potentially facilitate early detection and result in increased cure rates. A neural network was trained by Hart and colleagues to predict lung cancer risk. Based upon a wide range of health and demographic data, the model was able to predict lung cancer risk in a healthy population with high specificity and sensitivity [77]. In addition, an AUC value of 85% was achieved by a neural network model for the prediction of pancreatic cancer risk [78]. Individualized risk-calculation algorithms could help to prioritize screening in low-resource settings for high-risk individuals.
Cluster 4 (Red): Among the keywords in this cluster were “biomarker”, “imaging”, and “genomics”. This cluster is mainly related to AI for cancer genomics. Histopathology and genomics in oncology have experienced a surge in research interest. A much more detailed picture of tumour biology can now be obtained and more specific information can be provided on likely effective therapeutic approaches, particularly with the emergence of immunotherapies. It is theoretically possible to obtain this information through noninvasive imaging techniques, thereby having an extensive impact on clinical management. Furthermore, imaging techniques may have less sampling error since the entire tumour can be viewed at once. This task is made possible by radiogenomics, in which radiological imaging features are used to determine the genomic profile of the lesion [79].
AI research is currently active in the field of tumour subtyping for neuro-oncology. Neural networks were able to predict the methylation status of the O6-Methylguanine-DNA Methyltransferase (MGMT) promoter in newly diagnosed glioblastoma patients with an accuracy of 87.7% [80]. In a study of 259 glioma patients by Chang P et al. [81], a CNN model combined with MRI could predict mutations in isocitrate dehydrogenase 1, 1p/19q codeletion, and MGMT promoter methylation status with an accuracy of 83–94%. Several AI studies have investigated the use of radiogenomics to characterize regional genetic variations in glioblastoma, since intra-tumoural heterogeneity is thought to play an important role in disease development and treatment resistance [82]. The results of these studies are promising and may eventually have clinical applications. However, there is currently insufficient data to assess the model’s robustness since the imaging equipment and parameters often vary depending on the institution [83]. There are currently limitations on the possible clinical applications due to these problems.
Cell-free DNA (cfDNA) has emerged as a noninvasive liquid biopsy for screening and diagnosis. A study using ML approaches found that cfDNA could distinguish colorectal cancer from control groups with 87.9% sensitivity and 89.6% specificity (AUC = 0.96) [60]. ML has been investigated for its possible application in assisting cfDNA-based diagnosis, with the results showing greater than 99% accuracy for classifying colorectal, lung, renal, and uterine cancer subtypes [84, 85].
Noninvasive methods such as cfDNA and radiomics could complement existing methods if shown to be sufficiently accurate. The cfDNA and radiographic data of a lesion could provide sufficient genomic and structural information to facilitate diagnosis and treatment planning, for instance, when performing anatomically challenging biopsies.
Cluster 5 (Dark blue): The prominent keywords in this cluster were associated with lesion detection using AI and included “cancer detection”, “early diagnosis”, and “accuracy”. AI is already well established for the detection and classification of early cancers and pre-malignant lesions. Indeterminate pulmonary nodules are good candidates for image-based models since they occur frequently and are usually benign, although a small percentage represent early stage cancer [86, 87]. Recently, lung cancer screening trials such as the NELSON trial have allowed access to large databases of CT chest studies [88]. Recent models have shown significant improvements in sensitivity after using data from these trials and DL techniques. When 400 CT examinations were randomly selected from the NELSON trial, evaluation of the computer-assisted diagnosis showed 96.7% sensitivity compared to 78.1% for radiologists with double reading [89].
Medical images other than radiological have also been analyzed by AI. Wang P et al. [90] conducted a study on automated polyp detection using a sample of 5545 images obtained from 1290 patients. A DL algorithm for detecting colorectal polyps during colonoscopy showed 94.38% sensitivity, 95.92% specificity, and 0.984% AUC [91].
Other possible applications for AI in cancer involve the detection of metastasis in patients with known primary cancer, including metastatic disease in lung, liver, bone, or peritoneum [92].
Cluster 6 (Light blue): This cluster consists of “histopathology”, “biopsy”, and “immunohistochemistry”, and focuses mainly on issues related to AI in oncopathology. The pathological diagnosis is the definitive diagnosis that determines the treatment strategy and its effectiveness. However, pathologists are in short supply in many countries, including the USA, Japan, Canada, and many others around the world. This negatively impacts medical care [93, 94]. The use of AI for pathological diagnosis could fill the gap left by the shortage of pathologists. In light of the high variability among pathologists, it also makes sense to incorporate AI into computational pathology.
AI algorithms in oncopathology are primarily used for the diagnosis and grading of tumors, as well as prognostication. AI-based models have shown promising results for automated Gleason grading of prostate cancer [95], for classifying lung and ovarian cancers from histological subtypes [96, 97], and for grading malignant gliomas [98]. Based on histopathological results, Coudray N et al. [96] analyzed mutations in non-small cell lung cancers using AI. Accurate prediction of mutations in STK11, EGFR, FAT1, SETBP1 and other genes was possible using the pathological images (AUC: 0.733–0.856) [96]. AI can also be used to assess intraoperative margins based on optical coherence tomography (OCT) images of frozen sections [99]. With OCT, hig scattering tissue with a heterogeneous pattern allowed cancerous cells and tissues to be distinguished from normal breast tissue. In a small case series, the sensitivity and specificity were 100% and 82%, respectively, compared with pathology results [100]. Based on the analysis of 9879 quantitative features from each image tile, Yu KH et al. [101] reported that the top features identified using regularized ML methods were able to distinguish short-term survivors from long-term survivors in patients with adenocarcinoma or squamous cell carcinoma. The next step will be to conduct prospective studies to test the reproducibility of results across institutions. This should include not only pathological image analysis, but also a wide range of AI-driven medical image analysis solutions.
Investigation of frequently used keywords in the literature can provide insight into how research topics evolve over time. During the study period, AI applications in the diagnosis, risk stratification, management, and prognosis prediction of cancer became the research foci, as shown in Table 5. In addition, many oncology-related specialties are involved in this research area, but the main directions were from cancer radiology and radiation oncology. The different cancer types that can be investigated using AI devices include breast, skin, colorectal, etc. The results of our study are supported by Luchini C et al. [102], who reported that AI is gaining the greatest influence in branches that involve diagnostics, which account for a high percentage of approved devices [102]. Cancer radiology accounts for the majority of AI devices approved for use in oncology-related fields [102], with pathology and radiation oncology coming second and third, respectively. Breast cancer leads in terms of the number of applications for AI, followed by lung, prostate and colorectal cancers [102].
| Rank | Keywords | Count | Centrality | Rank | Keywords | Count | Centrality |
| 1 | cancer | 1031 | 0.03 | 11 | model | 359 | 0.04 |
| 2 | classification | 983 | 0.03 | 12 | image analysis | 321 | 0.02 |
| 3 | gene expression | 678 | 0.13 | 13 | magnetic resonance imaging (MRI) | 314 | 0.01 |
| 4 | diagnosis | 671 | 0.01 | 14 | risk | 302 | 0.03 |
| 5 | survival analysis | 467 | 0.01 | 15 | breast cancer | 249 | 0.01 |
| 6 | CNN | 420 | 0.02 | 16 | computed tomography (CT) | 241 | 0.07 |
| 7 | feature selection | 414 | 0.02 | 17 | radiotherapy | 224 | 0.03 |
| 8 | image segmentation | 410 | 0.01 | 18 | skin lesion | 185 | 0.01 |
| 9 | management | 371 | 0.04 | 19 | colorectal cancer | 175 | 0.02 |
| 10 | prediction | 364 | 0.03 | 20 | prognostic biomarker | 165 | 0.02 |
Fig. 6 shows how closely related keywords were grouped into distinct clusters. Similar to Fig. 5, this provides information about the intellectual structure of AI in oncology research.
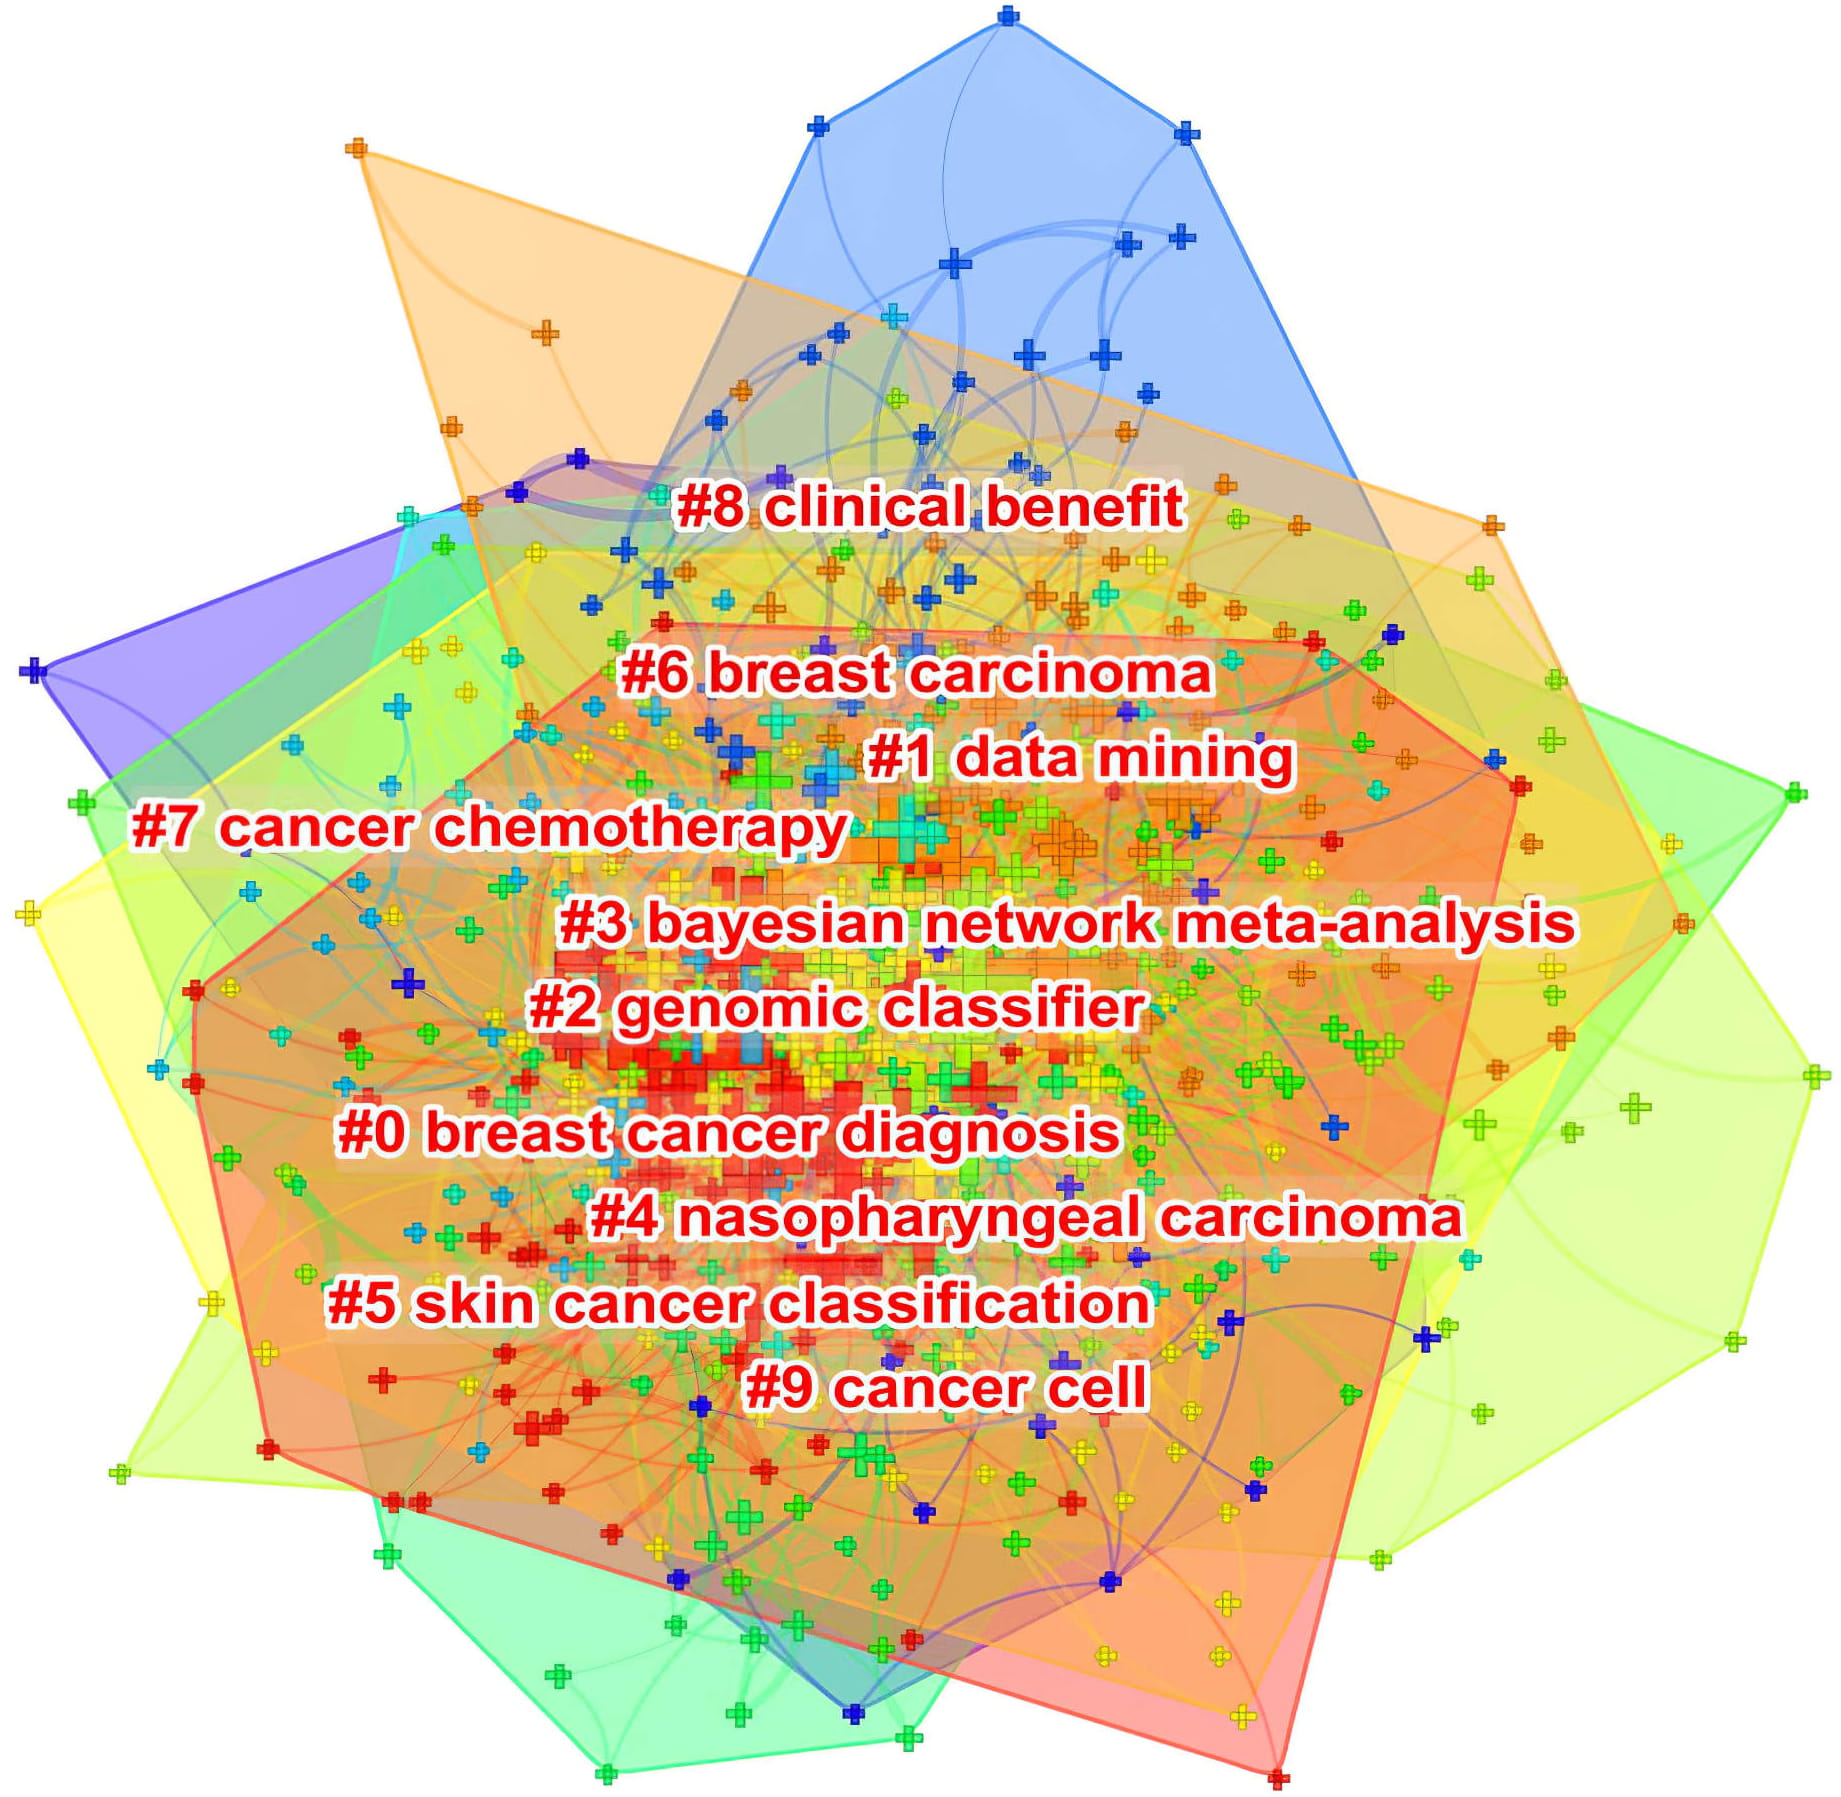 Fig. 6.
Co-occurring keyword clustering knowledge map of AI in oncology research.
Due to the inherent limitations of CiteSpace, these co-occurring keywords were not available for manual selection when the minimum number of occurrences was set to X times. Cluster labels can, however, be extracted using the Log-Likelihood Ratio method. This yields the best results in terms of uniqueness and coverage to provide a comprehensive picture of the research domain [103]. In addition, the Log-Likelihood Ratio method available with CiteSpace software provides better cluster labeling precision than other functions [103]. Importantly, the construction of co-occurring keyword clusters provides a basis for a timeline view that displays their evolution (Fig. 7).
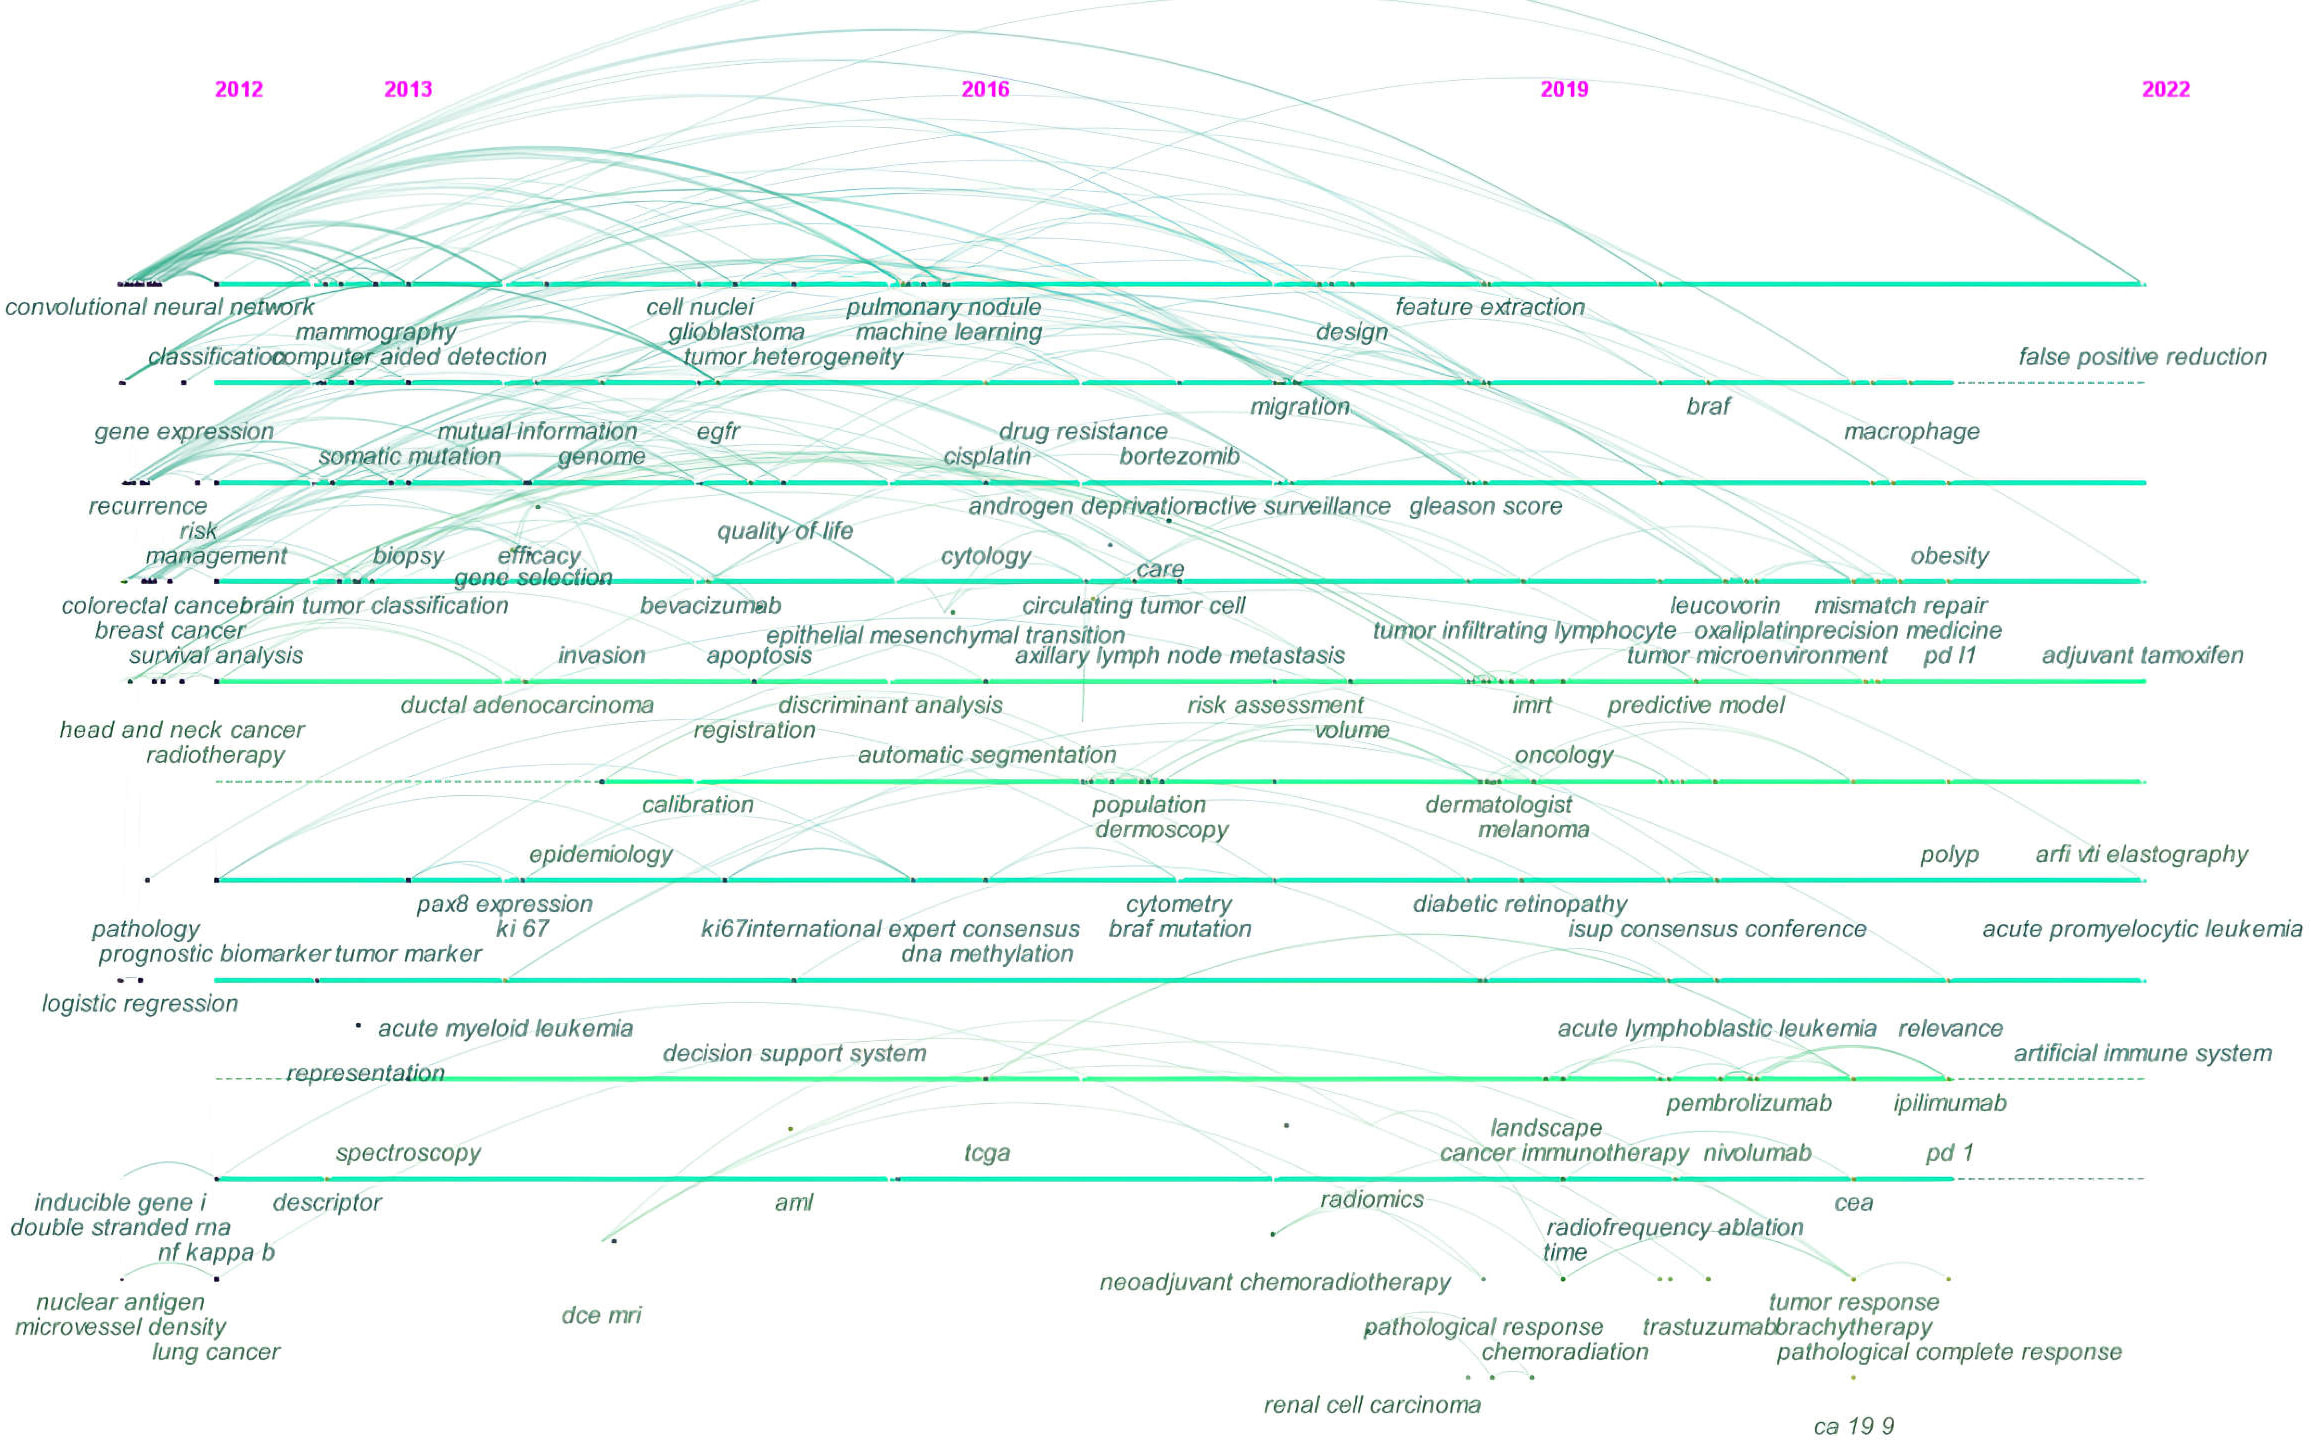 Fig. 7.
Timeline view of co-occurring keywords map of AI in oncology research.
A total of 764 co-occurring keywords were clustered in CiteSpace software using the previous dataset created for a co-occurrence network of keywords in VOSveiwer. This was manually reviewed by removing irrelevant terms and merging those with similar semantic meanings, but without requiring a minimum number of co-occurrences. Each cluster has a tag number that is proportional to the cluster’s size. For example, cluster #0 is the largest cluster, while cluster #9 is the smallest. Cluster size refers to the total number of co-occurring keywords represented in the cluster. The following ten clusters were presented: #0 breast cancer diagnosis; #1 data mining; #2 genomic classifier; #3 Bayesian network meta-analysis; #4 nasopharyngeal carcinoma; #5 skin cancer classification; #6 breast carcinoma; #7 cancer chemotherapy; #8 clinical benefit; #9 cancer cell.
Fig. 7 shows the trend for AI in oncology research based on the timeline visualization of co-occurring keywords network. As indicated by the cluster view, nodes (co-occurring keywords) arranged horizontally are semantically related and belong to the same cluster. Moreover, nodes are organized horizontally according to their year of occurrence. In Fig. 7 for example, the nodes labeled as automatic segmentation, dermoscopy, dermatologist, and melanoma on the sixth line correspond to the #5 skin cancer classification (Fig. 6).
As the trend between nodes moves in a left-to-right direction, it indicates topics that have been closely followed by researchers, as well as those that have been focused on more recently.
The initial years from 2012 to 2016 showed more emphasis on topics such as biopsy, pathology, radiotherapy, prognostic biomarkers, and genomes. The 2016 to 2019 mid-term phase was focused on drug resistance, neoadjuvant chemoradiotherapy, radiomics, and cytology. The trend in research from 2019 to 2022 revealed a focus on areas such as precision medicine, cancer immunotherapy, pathological response, and tumor microenvironment.
Kywords with ongoing citation bursts included “tissue microarray” (7.12), “tissue segmentation” (6.03), “artificial neural network” (4.79), and “radical prostatectomy” (4.19) (Fig. 8). Hot topics may be gleaned from these keywords.
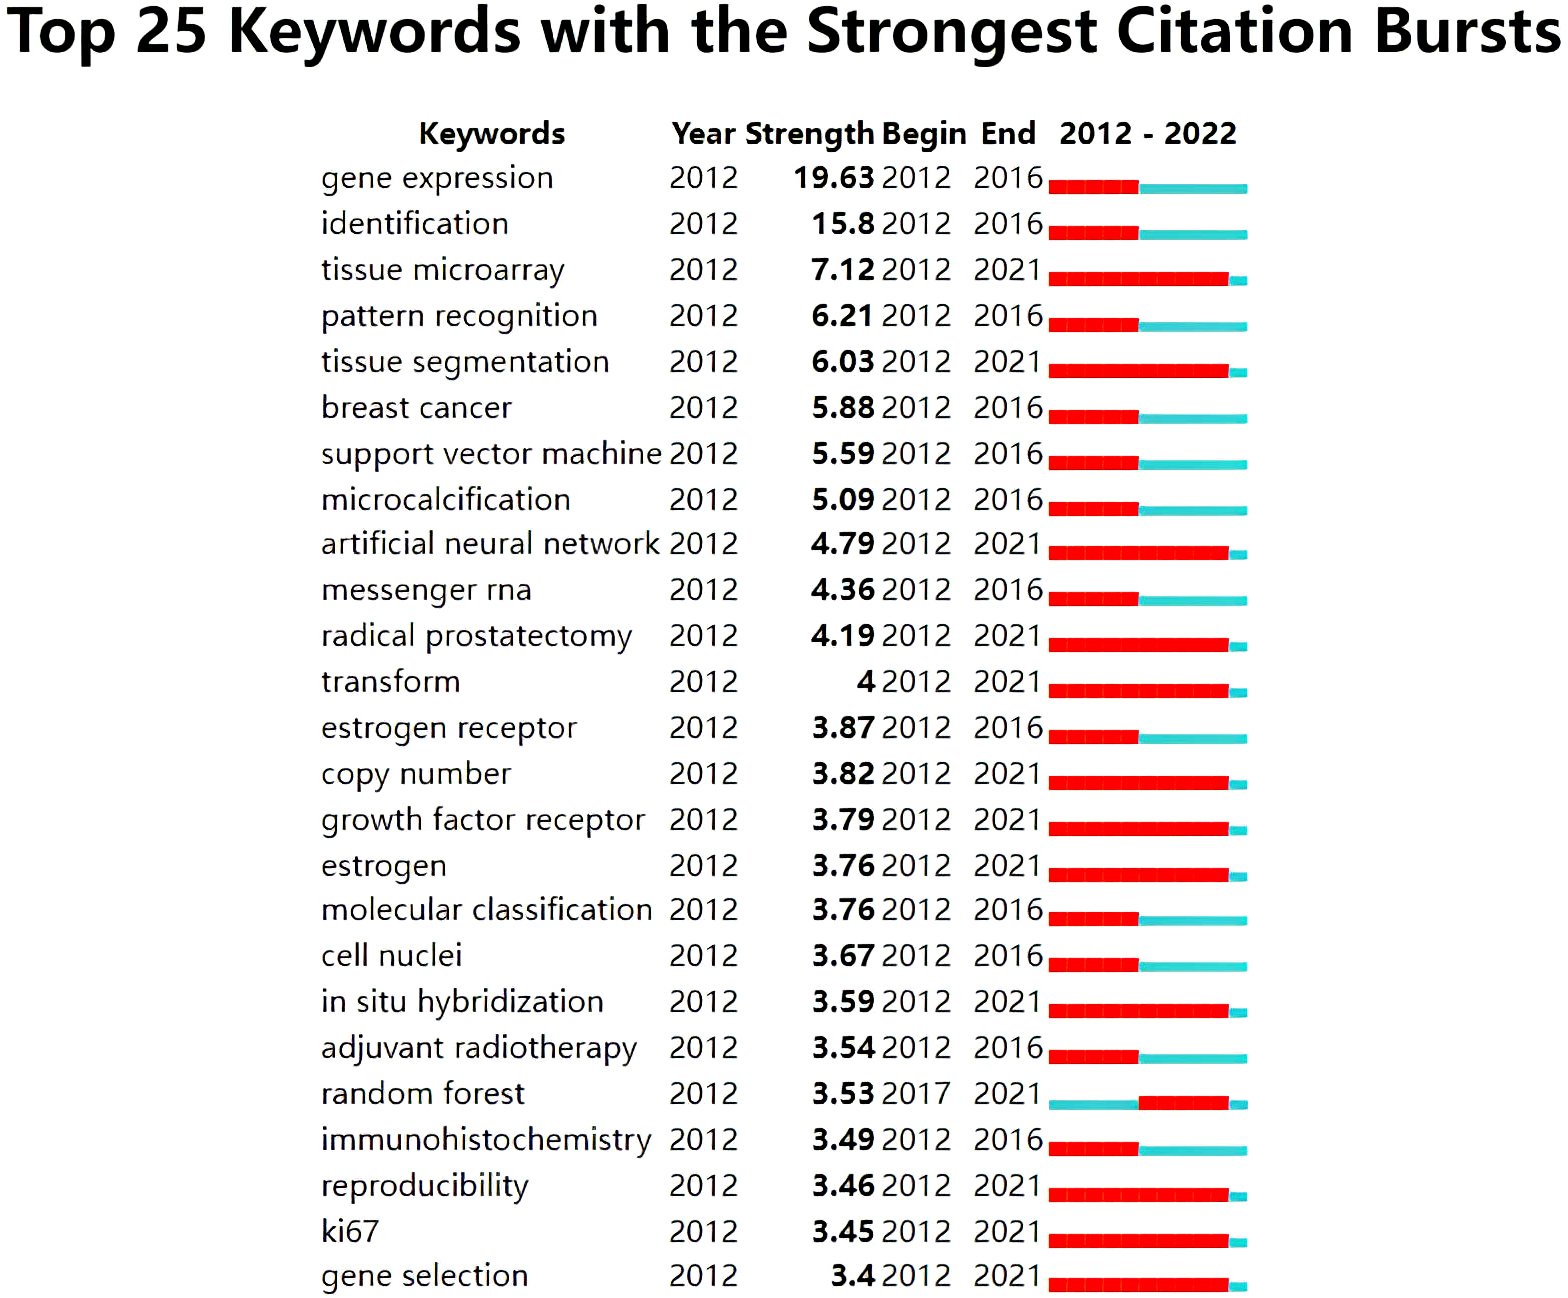 Fig. 8.
Keywords with strong citation bursts related to AI in oncology research.
The present study found that AI was of growing interest in the field of oncology. As shown in Fig. 1, research in this field has gained cosiderable traction in recent years, as evidenced by the significant increase in number of published articles over the last four years. AI and cancer articles were quite rare until 2017, before showing a rapid increase afterwards. This trend coincided with the increased availability of computing resources and the increasing popularity of AI solutions in other areas of healthcare. It also highlights the fact that most clinical trials involving AI for cancer diagnosis began after 2017 [25, 104]. Interestingly, this trend was also observed in certain oncology subspecialties. For example, there was only a small number of articles pertaining to AI and pediatric oncology up until 2017, but the number increased sharply thereafter [40]. Moreover, researchers in the domain of DL and breast cancer image classification began working collaboratively in 2017 and have since published their work, with this domain continuing to grow [38]. Therefore, it can be inferred that growing global collaboration after 2017 facilitated the dissemination of AI awareness in cancer research, leading to dramatically increased productivity since that year.
It has been reported that the COVID-19 pandemic served as a potent influencer, with countries worldwide experiencing significant variation in the volume and features of scientific publishing during this crisis [105]. To determine whether there were differences in publishing types between the pre-COVID-19 and post-COVID-19 world, the annual growth rate (AGR) of reviews and articles was computed using the equation shown below for three periods (2018–2019, 2019–2020, and 2020–2021). The AGR can be calculated by expressing a variable’s change in percentage as a year-over-year statistic. This metric can be helpful for assessing performance and for monitoring success and failure in any activity.
A marked difference was found in the AGR of reviews, with the AGR declining from 150% to 90% in the first year of the COVID-19 outbreak (2020) and then increasing to 100% in 2021. Furthermore, the AGR of articles fell substantially, from 131.77% in 2019 to 58.87% in 2020, and then even further to 49.95% in 2021. The AGR for the publication of reviews and articles indicates their output was negatively affected by the COVID-19 pandemic. Moreover, there was further deterioration in article productivity as the investigation interval was extended. Hence, although articles have gained widespread acceptace as the primary means of communicating knowledge and allowing researchers to exchange information, the very large increase in AI-based oncology research in recent years has been driven mainly by the dominance of reviews.
Table 1 reveals that the focus of progress to date has been centred on countries
in Asia and North America, most notably China and the USA, respectively. Not
surprisingly, these countries were ranked as the top two and demonstrate a
similar trend in terms of their Research and Development (R&D) expenditure. The
largest investment in R&D was in the USA (
A node’s betweenness centrality describes how closely it is interconnected to other nodes. A node with a high betweenness centrality, represented by the purple halo in the network, is more significant since more information will pass through it. Along with being prolific countries, India, England, and Saudi Arabia were leaders in terms of their centrality indicators, demonstrating they were likely to initiate collaborative relationships within their respective communities. Furthermore, Fig. 2 shows that Pakistan, Poland, Sweden and Brazil were major influencers in this field and were also involved in extensive collaborations. The USA and China, however, displayed less cooperation worldwide. Similarly, the analysis conducted by Musa IH et al. [35] revealed that despite the USA and China being the most productive nations, European countries had the most active collaborations in AI-based cancer research, surpassing both the USA and China. Hanis TM et al. [37] reported a study of the top 100 most-cited publications on breast cancer and ML. They found that approximately half of the top 10 countries with the highest citations are European, further emphasizing their scientific contribution.
China and the USA dominated the high-yield institutions. Despite this, their low betweenness centrality was also indicative of their limited global collaborations. Due to their productivity and broad partnerships, the Chinese Acad Sci and Univ Toronto could both serve as potential targets for individuals with an interest in this research area.
As shown by the authors’ contribution in Table 2, Chinese researchers are the biggest contributors to this domain. A weak level of collaboration among the high-yield authors in this field was evident in Fig. 4.
Increasingly, researchers collaborate across national and institutional boundaries to take advantage of their expertise, technical resources, scientific infrastructure, reputation, and other benefits [107, 108]. Development of international collaborations can help researchers to produce results with more impact. Micro-, meso-, and macro-level collaboration network analyses of this domain allows the identification of knowledge gaps and missed opportunities. For example, countries in North America (USA and Canada) and Asia (China, South Korea, and Japan) with the highest share of publications were less active in collaborating with their domestic institutions and with partners abroad. Therefore, identifying the factors that encourage or discourage scientific collaboration should be a major priority for key researchers and policy makers in these countries. Privacy concerns about data sharing and underlying competing interests between medical centers are likely to account for this discrepancy. ML approaches, for example, require very large volumes of data for training and validation, raising issues of computerized trust, data sharing, and privacy concerns. During the processing of data it is possible for AI to encroach upon privacy through access to personal data, such as genomic sequences. True anonymity may not be possible for some data, such as those obtained through whole genome sequencing. Besides the potential for privacy leakage, collecting large amounts of data as part of data linkage and multicentric collaborations may allow researchers to make connections that were not possible previously, thus potentially compromising patient privacy even if the data is anonymized [109, 110].
It is crucial to focus on global interests and cooperation in order to address the scarcity of datasets that can be used for external validation of AI models. Poor collaborative networks can limit data sharing, which then hinders the vetting process and restricts the generalizability of AI algorithms for use in clinical care. AI applications in oncology have flourished in recent years, allowing significant advances in the diagnosis, prognostication, and prediction of treatment response across a wide array of data types. At the same time, a reasonable balance between privacy protection and the benefits of data-driven innovation is required, with the participation of all stakeholders [111]. It is also necessary to foster more international organizations capable of overseeing future AI studies within ethical and legal constraints in order to protect patient privacy and to achieve global standardization of AI in cancer.
Furthermore, it is anticipated that global collaboration will enable the exchange of valuable expertise and resources among countries, while also increasing the research output. The major interest of the USA and China in this field, as evidenced by their high productivity, also suggests they have the potential to steer collaborations with other research members, thereby potentially resulting in more revolutionary findings.
As shown in Table 3, Western journals dominate scientific publications of AI in oncology research. A majority of these journals are classified as Q1 or Q2, which indicates that high quality, well-designed studies constitute the basis for this field. Journal co-citation analysis allows researchers to identify the major mainstream journals and their impacts. These journals rank amongst the top journals in their respective disciplines. A high proportion of publications and co-citations are in influential journals, suggesting a growing interest in this area. The high demand for AI applications in cancer research and clinical practice may be a contributing factor.
Based on these findings and results collected at the micro (individual researchers), meso (institutions) and macro (nations) levels, this study highlights the importance of strengthening journal capacity and of promoting global collaboration in order for Asian countries to produce quality scientific outcomes and to disseminate knowledge in this field.
We examined conceptual structure using keyword co-occurrences to identify clusters of research themes in which extensive research has been carried out, as shown in Fig. 5. Moreover, we closely examined the top co-cited references listed in Table 4 and Table 6 in order to shed light on the intellectual core of this field from a different perspective. These tables show that the DL model represents the cutting-edge and most common branch of AI applied to oncology today. DL technology is a subclass of ML, and has great potential in the medical sector. DL algorithms perform well when analyzing images, and hence they are used for medical image classification, improvement of image quality, and segmentation. The co-cited references also indicate that breast and lung cancers are the most most widely studied cancer types. It was previously shown that high-output countries or those with extensive collaborations as identified in the present study (e.g., USA, China, and India) were in fact the major contributors to breast cancer and DL studies globally [38]. Furthermore, England, Sweden and Pakistan were identified as major influencers in our analysis, and were also found to have a high level of involvement in DL-based breast cancer research [38]. Since breast cancer is a major cause of death among women, research into this disease has been at the forefront of AI adoption [15, 112, 113, 114, 115, 116]. Research publications on this topic have risen in the last decade as larger countries recognize that breast cancer is a “a global scourge”, thus making it a research topic of interest in the AI field. AI techniques are currently being used in mammography screening to reduce breast cancer-related deaths, while neural networks are used for detecting and identifying patients at high risk of developing breast cancer and for determining the prognosis of this disease [35].
| Rank | Reference | Journal | Centrality | Year |
| 1 | Lung Pattern Classification for Interstitial Lung Diseases Using a Deep Convolutional Neural Network | IEEE transactions on medical imaging | 0.14 | 2016 |
| 2 | Quantitative image analysis of cellular heterogeneity in breast tumors complements genomic profiling | Science translational medicine | 0.12 | 2012 |
| 3 | Accurate and reproducible invasive breast cancer detection in whole-slide images: A Deep Learning approach for quantifying tumor extent | Scientific reports | 0.11 | 2017 |
| 4 | Pulmonary Nodule Detection in CT Images: False Positive Reduction Using Multi-View Convolutional Networks | IEEE transactions on medical imaging | 0.1 | 2016 |
| 5 | Decoding tumour phenotype by noninvasive imaging using a quantitative radiomics approach | Nature communications | 0.09 | 2014 |
In addition to the literature on the epidemiology of cancers and the concept of radiomics in the care of cancer patients [49, 51, 52], we carefully examined original research articles with high co-citations, as shown in Table 4. The key findings and conclusions of these co-cited references are summarized in Supplementary Table 2. We conclude that the power of DL has been harnessed by researchers for applications in pathology and clinical radiology that alleviate the need to manually generate detailed features. As described in these references, AI has been applied to pathological diagnosis for detection and screening (e.g., detection of lymph node metastasis and histological subtyping) and for the prediction of clinical parameters (e.g., prognosis and gene mutations).
Radiomics is a translational area that has contributed greatly to the current body of knowledge on AI in oncology research, as shown in Table 4. Radiomics was originally described by Lambin P in 2011 [117], who explained that it involves identifying and analyzing large quantities of advanced quantitative image features from radiological images with the intention of developing mineable databases. Almost all aspects of oncology can benefit from the use of radiomics, from automated cancer screening to image-based signatures for precision oncology. A bibliometric analysis of radiomics in oncology research found that current research is focused primarily on AI algorithms and the use of radiomics to automate tumor segmentation and to classify and diagnose lesions [118]. This confirms the results in Fig. 5 showing that radiomics, particularly in relation to tumor segmentation, is the main component of the intellectual base in this field.
Table 6 highlights that references with high betweenness centrality represent potentially revolutionary sources that constitute key parts of the knowledge base for AI in oncology research. The first-ranking reference used DL-based models to accurately identify cancer subtypes and to diagnose cancer directly from medical images and histopathology. Using CT images of patients with lung disease, Anthimopoulos M et al. [119] developed a CNN capable of detecting and classifying textural patterns in the lung, such as micronodules, ground glass opacity, and reticulation with an average accuracy of 0.85 using deep neural networks.
In practical clinic-related matters, multi-feature fusion analysis is receiving much attention from pathologists. The integration of histopathological images with genomics can provide valuable information on cancer tissue architecture, which is typically compromised in molecular assays, leaving this valuable resource underused [120]. For example, in the second-ranking reference by Yuan Y et al. [121], SVM with a Gaussian radial basis kernel was used to integrate genomic data and pathological images and thus better describe and validate independent prognostic factors in estrogen receptor-negative breast cancer.
In the third-ranking reference, Cruz-Roa A et al. [122] developed a CNN-based classifier to detect the presence of invasive tumors in whole pathological images. Their study used 400 samples for training, and then 200 samples from the Cancer Genome Atlas dataset to validate the model [122]. The model achieved near-perfect detection of breast cancer at a microscopic level with a Dice coefficient of 75.86, a positive predictive value of 71.62%, and a negative predictive value of 96.77% [122].
Methods for detecting lesions are often hampered by the possibility of multiple false positives while being deficient in true positive results. In the fourth-ranking reference, a two-dimensional multi-view CNN was found to reduce false-positive results in the detection of pulmonary nodules [123]. Based on the LIDC-IDRI data set of 888 chest CT scans, the approach achieved sensitivity rates of 85.4% and 90.1% at one and four false positive lesions per scan, respectively [122, 124].
Radiomics is ideally characterized as a virtual biopsy based on non-invasive radiographic images. This provides an assessment of the tumor microenvironment, the determination of intra-tumoral heterogeneity, and enables dynamic monitoring. As such, this field is likely to address some of the key issues across the continuum of cancer care. The initial study labeled as “radiomics” was published in 2014. In the fifth-ranking article, Aerts HJ et al. [125] published an analysis of tumour phenotypes using radiomics from a data set of 1019 lung and head and neck cancers. Their analysis of 440 image features found a radiomic signature with shape and texture metrics that was associated with overall survival [125]. This radiomic signature was also positively correlated with gene expression [125].
As shown in Fig. 8, the ongoing citation burst detection for keywords highlight that the research focus has recently shifted to the micro and molecular levels, where there may be opportunities for AI technology, including tumour segmentation and precision oncology.
AI is a significant factor in the transformation of health care to precision medicine. It is reshaping precision oncology by attempting to integrate the massive amounts of data generated by multi-omics analysis with recent advances in high-performance computing and DL methods. As reported earlier in the study by Hanis TM et al. [37], the trending keywords include genomics and gene expression regulation, thus reflecting the increased popularity of genomics in AI and the cancer field. The applications for AI are therefore expanding and include approaches for the characterization of tumor genomics [20, 126].
Currently, tumor molecular data and clinical outcome data combine effectively for tumor subtyping. However, the association between mutations and clinical phenotypes remains to be clarified, presenting a major bottleneck in genomic medicine [127]. The literature on state-of-the-art disease states, effective drugs, and prognoses must be examined in order to link identified genomic mutations to those factors. Due to the enormous amount of cancer-related literature published annually, there are insufficient resources to conduct manual annotation. In addition, the volume of data that needs to be processed has increased dramatically, with up to 3 billion base pairs of information produced from a whole genome analysis. Consequently, the use of AI will become increasingly essential. In addition to single task learning, DL allows multitask learning whereby AI can learn a number of tasks simultaneously by sharing parts of the same model. During the training process, an appropriate optimizer algorithm minimizes the differences between predicted and actual values. A further benefit of DL is multimodal learning, which allows different types of data, such as sequences and chromatin accessibility, to be fused and used as inputs to the model. In this manner, AI is able to combine different types of data automatically. It is preferable to incorporate multilayered data for a complex disease such as cancer. In response to the increasing number of genomic databases, a greater need will emerge for tools to organize these large quantities of biological data so they can be used with AI methods.
This bibliometric analysis of the literature regarding AI in oncology over the last decade is an attempt to identify, evaluate, and visualize research trends from a qualitative, quantitative, and chronological perspective. The use of AI technology is a key element of the field of oncology, and its clinical implementation is expected to increase steadily. China and the USA were considered the dominant countries in terms of their scientific publication output compared to others. In spite of this, their involvement in micro (those of individual researchers), meso (institutional) and macro (national) networks indicated they had limited collaborations in this field. On the other hand, England, Saudi Arabia, Pakistan, India, Poland, Sweden, and Brazil all maintained strong collaborations throughout the world that resulted in several co-authored publications. To achieve a global goal of harnessing the largest amount of data and providing a collective scientific effort, research efforts should not be restricted to a limited geographical area. In this regard, Europe’s strong international research collaborations with others represents a good starting point, even though the geographic proximity and similar cultures of European countries likely provide a strong catalyst for intensive cooperation. This study found that radiomics, genomics, pathology, risk stratification, lesion detection, and therapy response were discussed extensively in the extant literature. Of note, most of the reported AI applications were in regard to pathological diagnosis, including detection and screening (e.g., detection of lymph node metastasis and histological subtyping), prediction of clinical parameters (e.g., prognosis and gene mutations), as well as diagnostic imaging and particularly radiomics. Breast and lung cancer were the most studied cancer types. The current hot topics uncovered by this analysis were the potential applications of AI in radiomics, or more precisely for tumour segmentation, and precision oncology. In future, ethical and private concerns must be taken into consideration due to the inherent issues raised by AI. Moreover, the potential impact of such technology should be considered for vulnerable populations affected by rare diseases, including cancers, which may be severe and potentially fatal, and for which genetic information may be of great significance. The present analysis found there were surprisingly few publications that specifically discussed these issues in relation to AI and cancer research.
The present study makes a unique contribution by analyzing the published documents on the topic of AI applications across the full spectrum of cancer research. As noted earlier, it is essential for international collaborations to continue to blossom in the field of AI because of the problem of generalizability. AI models are typically built using a limited dataset that is assumed to be representative of all past and future data across different institutions [128]. The generalizability of AI algorithms is further complicated by privacy concerns involving data-sharing, as well as other obstacles that prevent data sharing and multicentric collaborations, resulting in less inter- and intraobserver variability. The current study also provides valuable insights into successful entities (e.g., authors, institutions, or nations) with exceptional bibliometric profiles that have made outstanding contributions to the field, as well as their patterns of interaction. Researchers with an interest in this field can therefore take advantage of such networks for potential collaboration with the view to producing high-quality research. This is particularly the case during the current COVID-19 crisis, whereby productivity has been strongly affected by high case counts, physical distances, isolation, and lockdowns at workplaces. This outcome was largely disregarded in previous bibliometric research.
Our study has several limitations. In order to ensure optimal coverage of the required information, the WoSCC database was selected since it is the most commonly used and acceptable database for bibliometric or scientific research. This houses nearly 9000 of the world’s esteemed high-impact journals, as well as over 12,000 academic conferences [27, 129]. Additionally, WoSCC document labels are more precise than other databases that include citation data, such as Scopus [130]. It was intended to use both Scopus and WoSCC databases to extract bibliographic information on publications related to AI and cancer research. However, other analyses such as the co-citation analysis are hindered in CiteSpace due to the different structure of metadata between the Scopus and WoSCC databases. Reliance on a single database can nonetheless bias the findings. Subsequent comparative analyses could use several recognized databases in order to achieve the same goal, provided the performance of current visualization software is improved.
January 2012 was the starting date for collection of data required for this paper, and hence the analysis spanned a period of ten years only. It is important to note, however, that the role of AI in cancer research is evolving rapidly. A number of oncology sub-specialties have witnessed the application of AI in recent years, and the field continues to flourish. For example, Khairi SSM et al. [38] showed in their analysis that Wang H et al. [131] in 2014 were the first to describe DL for breast cancer using histopathology images. After 2017, other authors began to actively publish in this area. We have therefore incorporated literature from the last decade into this study in order to better present the latest trends and the rapid evolution of this landscape. It is however possible to extend this period in future comparative works in order to cover more relevant literature, as the use of a ten year period meant that some papers were not included.
HL and YD (Yang Deng) led the team and were responsible for all aspects of the project. TW, YD (Yu Duan) and TZ substantially contributed to the methods, data acquisition, results, and interpretation. TW, YD (Yang Deng) and WT participated in designing and writing the manuscript. TW, YD (Yu Duan), TZ and WT revised this manuscript critically for important intellectual content. HL and YD (Yang Deng) gave final approval of the manuscript. All authors contributed to the article and approved the submitted version.
Not applicable.
Not applicable.
This research received no external funding.
The authors declare no conflict of interest.
Publisher’s Note: IMR Press stays neutral with regard to jurisdictional claims in published maps and institutional affiliations.