
Academic Editor: Graham Pawelec
Background: There is a growing interest in how personality may be related to the risk of developing disease. Associations between personality and stroke have so far only been studied in relation to stroke mortality. However, many stroke survivors suffer severe impairment of quality of life due to sequelae such as aphasia, hemiparesis, depression and anxiety. In this study we assess the association between personality and risk of stroke, regardless of mortality. Methods: Using self-reported data on psychological factors, mental health and social support, proxies for the Big Five personality traits were developed for 482,535 participants in the UK Biobank. Logistic regression and Cox proportional hazard models, with 95% confidence intervals (CI), were used to estimate odds ratios (OR) and hazard ratios (HR) between each personality trait and stroke prevalence (N = 6793) and incidence (N = 3312), respectively. Models were adjusted for demographic, health-related, and lifestyle factors. Results: Diligence and sociability were associated with a lower risk of stroke incidence in the fully adjusted model (respectively: [HR = 0.92; 95% CI = (0.88, 0.96)], [HR = 0.93; 95% CI = (0.89, 0.97)]). However, nervousness, curiosity and warmth were not significantly associated with a risk of stroke incidence. Conclusions: Individuals with higher levels of diligence and sociability may be at a reduced risk of developing stroke. With respect to the debated role of neuroticism in relation to cardiovascular disease, we did not find evidence of an association between nervousness and risk of developing stroke.
Stroke remains a leading cause of death and disability worldwide [1]. More than half of stroke survivors are afflicted by serious sequelae such as aphasia, hemiparesis, depression and anxiety which can drastically impair the overall quality of life (QoL) [2, 3]. Several risk factors have been identified for stroke which can be split into several categories: (1) demographic factors, which include age, sex, ethnicity and socioeconomic status. (2) Health related factors such as hypertension, diabetes mellitus, high body mass index (BMI), high lipoprotein (a) and prior occurrence of cardiovascular disease (CVD) [4, 5, 6]. (3) Lifestyle related factors such as alcohol and tobacco use, physical activity, and sedentary time [7, 8, 9, 10, 11]. In addition to these factors, there is a growing selection of literature on the possible effects of personality on the risk of developing stroke. This research between personality and disease has been coined “personological epidemiology” [12].
The Five-Factor Model, also known as the “Big Five personality traits”, is perhaps the most robust and well-known method of characterizing a person’s psychological and behavioral dispositions [12, 13]. The model defines five superordinate bipolar factors, or personality traits: (1) extraversion, (2) agreeableness, (3) conscientiousness, (4) openness to experience, and (5) neuroticism. The five traits tend to remain stable throughout our lifetime and are present in over 50 cultures, which are the key aspects adding to the model’s broad applicability [14, 15]. Prior work has identified conscientiousness as a strong predictor for reduced all-cause mortality, while openness reduces CVD mortality in particular [16]. Neuroticism and extraversion have generated mixed results, with both positive and negative associations with general health effects [16]. However, agreeableness does not appear to have a strong association with health [16].
To date, personological epidemiological studies on stroke have primarily focused on stroke sequelae and post-stroke QoL. For example, neuroticism and individual facets of this trait have been associated with an increased risk for post-stroke depression and an overall reduced QoL [17, 18]. Additionally, stroke survivors with a strong degree of neuroticism have higher levels of fatigue and score lower on the Barthel scale measuring performance in activities of daily living [19]. On the other hand, low extraversion has been associated with an increased post-stroke apathy [18]. In relation to this, the type D (distressed) personality, which is characterized by low extraversion and high neuroticism, has lower scores for health promoting behaviours, higher post-stroke disability scores and lower QoL after stroke [20]. Unfortunately, studies on the association between personality and risk of developing stroke have been limited to cases of stroke mortality, thus excluding stroke morbidity that could potentially severely impact an individual’s QoL [21, 22, 23].
This study aims to examine potential associations between personality and stroke risk, regardless of mortality, both cross-sectionally and longitudinally, using the large-scale UK Biobank cohort (UKB) [24]. The exceptionally detailed UKB contains data from over 500,000 participants and follow-up data over the course of approximately 7 years. As neuroticism is the only Big Five personality trait that is included in the UKB, we aimed to identify phenotypes in the dataset that can be implemented as proxies to represent the other traits. Based on previous literature we expected to find a negative correlation between conscientiousness-like traits and stroke risk. Moreover, existing literature is unclear about the role of extraversion and neuroticism on stroke risk. We expected potential correlations between these traits and stroke risk but were uncertain whether these will be positive or negative. As a subgoal, we also performed a sex specific analysis in order to identify associations that are specific to females or males. This was of interest as none of the previously mentioned personological epidemiological stroke risk studies had assessed sex specific associations. Because personality remains relatively stable throughout one’s life, personality might be used to identify at-risk individuals at an early stage. This could be an important step into taking preventive measures earlier on in life. At the same time, identification of personality traits associated with stroke risk could support in the development of personality-targeted interventions.
UK Biobank (UKB) is a large scale long-term biomedical database and research resource consisting of 502,594 participants (aged 37–73 years). Its participants were recruited between 2006 and 2010 from 22 assessment centers throughout the United Kingdom (UK) [24]. A detailed description of the UKB can be found elsewhere [25]. Following the baseline assessment, participant data was updated using medical records, which include hospital records (National Care Record Service and the Scottish Morbidity record) and death registries (Office for National Statistics and Registrar General’s Office). Participants who had withdrawn consent (n = 106), had a history of myocardial infarction (n = 8412), angina pectoris (n = 8547), psychiatric (n = 3584) and personality (n = 1291) disorders or had missing stroke data (n = 14,576) were excluded. A detailed overview of the codes used to identify these conditions is available in (Supplementary Table 1). Finally, 482,535 participants were included in this study (Fig. 1).
 Fig. 1.
Overview of the study sample. A total of 502,594 participants were included in the UK Biobank cohort. After exclusion, 6793 stroke prevalent cases and 461,168 baseline controls were included in this study. The follow-up analysis included 3312 stroke incident cases and 457,856 controls.
The creation of psychological constructs is a complicated process. Flawed measurements may introduce uncertainty, which is particularly problematic if they do not exclusively measure the intended phenomenon [26]. However, simplified constructs can be useful in large datasets, like the UKB, to identify predictors for the relevant outcomes. In order to enhance the available data within the UKB, prior studies have created simplified psychological constructs using the available self-reported information, for example for loneliness and social isolation [27, 28]. These one- to three-point scales have been successfully used to replicate associations found using the corresponding validated constructs across various outcomes, such as stroke, excess mortality and self-harm [27, 28, 29, 30]. The added benefit is the great statistical power and longitudinal analysis the UKB provides. The UKB proxies for personality in this study were created in a similar fashion.
UKB proxies for personality were composed of data from questionnaires taken during baseline assessment. The questions were assessed for similarities to the five personality traits defined in the Big Five Inventory (BFI) [31]. Questions related to psychological factors, social support and mental health were linked to each personality trait proxy. This resulted in five proxies that were scored between 0 and 4 (sociability, diligence and curiosity) or 0 and 5 (warmth and nervousness) (Table 1, Ref. [31]). The questions were selected on a suitability basis, where available questions in the BFI were compared to the data available in the UKB. Some questions, or the inverse of thereof, have previously been used to compute a neuroticism score for participants [32]. Although we use some of these neuroticism-related questions to determine other proxies as well, we highlight that previous studies have shown correlations between various traits. For example, the superordinate “Stability” trait consists of a combination of agreeableness, conscientiousness and emotional stability (reversed neuroticism) [33, 34]. Regardless, we want to emphasise that while we attempt to approximate the big five personality traits using the limited available variables in the UKB, these proxies have not been validated, thus urging the reader to interpret the results with care. In cases where questions consisted of more than two possible answers (i.e., yes/no), dichotomization was applied in a way that suited the respective traits.
| Personality proxy | Facets of BFI |
UK Biobank questions | Code |
| SOCIABILITY (extraversion vs introversion) | Gregariousness (sociable) | Frequency of friend/family visit ( |
1031 |
| Assertiveness (forceful) | |||
| Positive emotions (enthusiastic) | |||
| Activity (energetic) | Guilty feelings (no) | 2030 | |
| Excitement-seeking (adventurous) | Frequency of tiredness/lethargy in last 2 weeks | 2080 | |
| Warmth (outgoing) | (not at all) | ||
| Leisure/social activities | 6160 | ||
| WARMTH (agreeableness vs selfishness) | Trust (forgiving) | Able to confide to ( |
2110 |
| Straightforwardness (not demanding) | |||
| 1 | Altruism (warm) | Irritability (no) | 1940 |
| Tender-mindedness (sympathetic) | Mood swings (no) | 1920 | |
| Modesty (not show-off) | Tense/‘highly strung’ (no) | 1990 | |
| Compliance (not stubborn) | Nervous feelings (no) | 1970 | |
| DILIGENCE (conscientiousness vs carelessness) | Competence (efficient) | Frequency of enthusiasm/disinterest in last 20 weeks (not at all) | 2060 |
| Achievement striving (thorough) | |||
| Self-discipline (not lazy) | |||
| Deliberation (not impulsive) | Fed-up feelings (no) | 1960 | |
| Dutifulness (not careless) | Risk taking (no) | 2040 | |
| Order (organized) | Worry too long after embarrassment (yes) | 2000 | |
| CURIOSITY (openness vs closedness to experience) | Ideas (curious) | Loneliness, isolation (no) | 2020 |
| Actions (wide interests) | |||
| Feelings (excitable) | |||
| Values (unconventional) | Suffer from ‘nerves’ (no) | 2010 | |
| Aesthetics (artistic) | Frequency of tenseness/restlessness in last 2 weeks ( |
2070 | |
| Fantasy (imaginative) | Risk taking (yes) | 2040 | |
| NERVOUSNESS (neuroticism vs emotional stability) | Anxiety (tense) | Tense/‘highly strung’ (yes) | 1990 |
| Angry hostility (irritable) | |||
| Depression (not contented) | Irritability (yes) | 1940 | |
| Self-consciousness (shy) | Frequency of enthusiasm/disinterest in last 2 weeks ( |
2060 | |
| Impulsiveness (moody) | Mood swings (yes) | 1920 | |
| Vulnerability (not self-confident) | Sensitivity/hurt feelings (yes) | 1950 | |
“Sociability” scale was based on four questions: (1) “How often do you visit
friends or family or have them visit you?” (1 point for visit frequency
“Warmth” scale was based on five questions: (1) “How often are you able to
confide in someone close to you?” (1 point for confiding frequency
“Diligence” scale was based on four questions: (1) “Over the past two weeks, how often have you had little interest or pleasure in doing things?” (1 point for not at all), (2) “Do you often feel ‘fed-up’?” (1 point for no), (3) “Would you describe yourself as someone who takes risks?” (1 point for no) and (4) “Do you worry too long after an embarrassing experience?” (1 point for yes).
“Curiosity” scale was based on four questions: (1) “Do you often feel
lonely?” (1 point for no), (2) “Do you suffer from ‘nerves’?” (1 point for
no), (3) “Over the past two weeks, how often have you felt tense, fidgety or
restless?” (1 point for
“Nervousness” scale was based on five questions: (1) “Would you call yourself
tense or ‘highly strung’?” (1 point for yes), (2) “Are you an irritable
person?” (1 point for yes), (3) “Over the past two weeks, how often have you
had little interest or pleasure in doing things?” (1 point for
The UKB Neuroticism score was created by Smith et al. [32] The score was derived from the twelve neurotic behavioural domains contained in the Eysenck Personality questionnaire (EPQ-N), and ranges from 0 to 12. In all cases, a higher score indicates a higher degree of the respective behaviour.
Stroke events were detected using the algorithmically-defined outcome variables developed by the UKB adjudication committee. These were created through linkage of hospital admission records from England, Scotland and Wales, national death registries and self-reported data. The variables contained information about the date of the first-known stroke event and have been used elsewhere [35]. Stroke events in these variables were recorded using the following International Classification of Disease (ICD)-10 codes: I60.X, I61.X, I63.X and I64.X; as well as the following ICD-9 codes from the Scottish Morbidity record: 430.X, 431.X, 434.X and 436.X. The follow-up times of the incident stroke events were counted from the baseline assessment date until the date of the first stroke event or, if there was no stroke incident event, until March 1, 2016.
The covariates with potential confounding effects on stroke prevalence and incidence were divided into three categories; demographic characteristics, health related measurements and lifestyle factors.
The baseline characteristics sex, age, ethnicity, and socioeconomic status were collected during the initial assessment. Ethnicity was defined as “white”, which included white, British white, Irish and any other white background, or as “other”, which included black, Asian, Pakistani, Indian, Mixed, Chinese and other ethnic groups. Townsend deprivation index (TDI) [36], calculated based on participants’ postal code and information from the national census output area, were used as a proxy for socioeconomic status.
Health related measurements were also recorded at baseline assessment. Weight
was measured with a Tanita BC-418MA body composition analyzer and height with
Seca 202 height measure. Body mass index (BMI) was derived from the weight and
height (kg/m
Lifestyle-related information was obtained using touchscreen questionnaires.
Smoking status was split into three categories (never, previous and current).
Alcohol intake frequency was also split into six categories (daily or almost
daily, three or four times a week, once or twice a week, one to three times a
month, special occasions only, never). Moderate-to-vigorous physical activity
(MVPA) score level was inferred from questions regarding weekly frequency and
daily duration (in minutes) of moderate physical activity and vigorous physical
activity. The international physical activity questionnaire (IPAQ) [37] was used
as guideline for processing these variables and to calculate the metabolic
equivalent per time (MET) score of MVPA (MVPA-MET). This MVPA-MET score was
computed using the following formula: MVPA-MET = [(Number of days/week of
moderate physical activity 10 + minutes
Descriptive statistics for categorical variables are presented as number
(percentage (%)) and for continuous variables as a mean (
After exclusions (Fig. 1), the study included 482,535 participants. Of these
participants, 6793 (1.41%) had a stroke before baseline assessment (prevalent
cases), and 14,574 (3.02%) had missing data on stroke prevalence and incidence.
Participants with prevalent stroke or missing stroke data were excluded from the
longitudinal analysis. Thus, the longitudinal analysis contained the remaining
461,168 participants, which included 3312 (0.72%) incident cases of stroke. The
dataset consisted of 55.2% female and 44.8% male participants, with a
respective mean age of 56.3 (
| Characteristics | Female (n = 266,496) | Male (n = 216,039) | |
| Age (years) (mean (SD)) | 56.3 (8.0) | 56.6 (8.2) | |
| Ethnicity (%) | |||
| White | 251,041 (94.2) | 203,038 (94.0) | |
| Other | 15,455 (5.8) | 13,001 (6.0) | |
| Blood pressure (mm Hg) | |||
| Systolic (mean (SD)) | 137.2 (20.3) | 142.8 (18.5) | |
| Diastolic (mean (SD)) | 80.7 (10.6) | 84.2 (10.5) | |
| Smoking status (%) | |||
| Never | 158,704 (60.0) | 106,850 (49.5) | |
| Previous | 83,082 (31.2) | 81,682 (37.8) | |
| Current | 23,262 (8.7) | 26,197 (12.1) | |
| Alcohol consumption (%) | |||
| Never | 24,847 (9.3) | 13,199 (6.1) | |
| Twice or less per week | 142,996 (53.7) | 90,591 (41.9) | |
| At least three times per week | 97,957 (36.8) | 111,567 (51.6) | |
| Body mass index (kg/m²) (mean (SD)) | 27.1 (5.2) | 27.8 (4.2) | |
| Socioeconomic status (SD) | |||
| Mean Townsend deprivation index score | –1.35 (3.0) | –1.29 (3.1) | |
| Diabetes (%) | 8,645 (3.2) | 12,367 (5.7) | |
| Drug use (%) | |||
| Antihypertensive drugs | 32 (0.01) | 75 (0.03) | |
| Lipid-lowering drugs | 9 (0.003) | 14 (0.006) | |
| Prevalent stroke (% of all strokes) | 2918 (43.0) | 3875 (57.0) | |
| Incident stroke during follow-up (% of all strokes) | 1409 (42.5) | 1903 (57.5) | |
The associations between the Big Five personality trait proxies and stroke
prevalence are illustrated in Fig. 2. Model I, adjusting for demographic
characteristics, showed that neuroticism [OR = 1.21; (95% confidence interval
(CI): 1.18; 1.24); (p = 2.98
 Fig. 2.
Odds ratios (OR) and hazard ratios (HR) for prevalent and incident stroke cases and each of personality trait proxies. ORs and HRs were obtained by performing logistic regression and Cox’s proportional hazard regression respectively. The three models adjusted for demographic characteristics, health-related measurements and lifestyle factors (see methods). The UKB variable Neuroticism is included to validate our related “Nervousness proxy”.
To examine potential sex-specific differences in the associations of the
personality traits and stroke prevalence, a sex-stratification was performed
(Fig. 3). In the fully adjusted model, females and males showed similar trends.
In females, both neuroticism [OR = 1.16; 95% CI = (1.10; 1.22); (p =
9.72
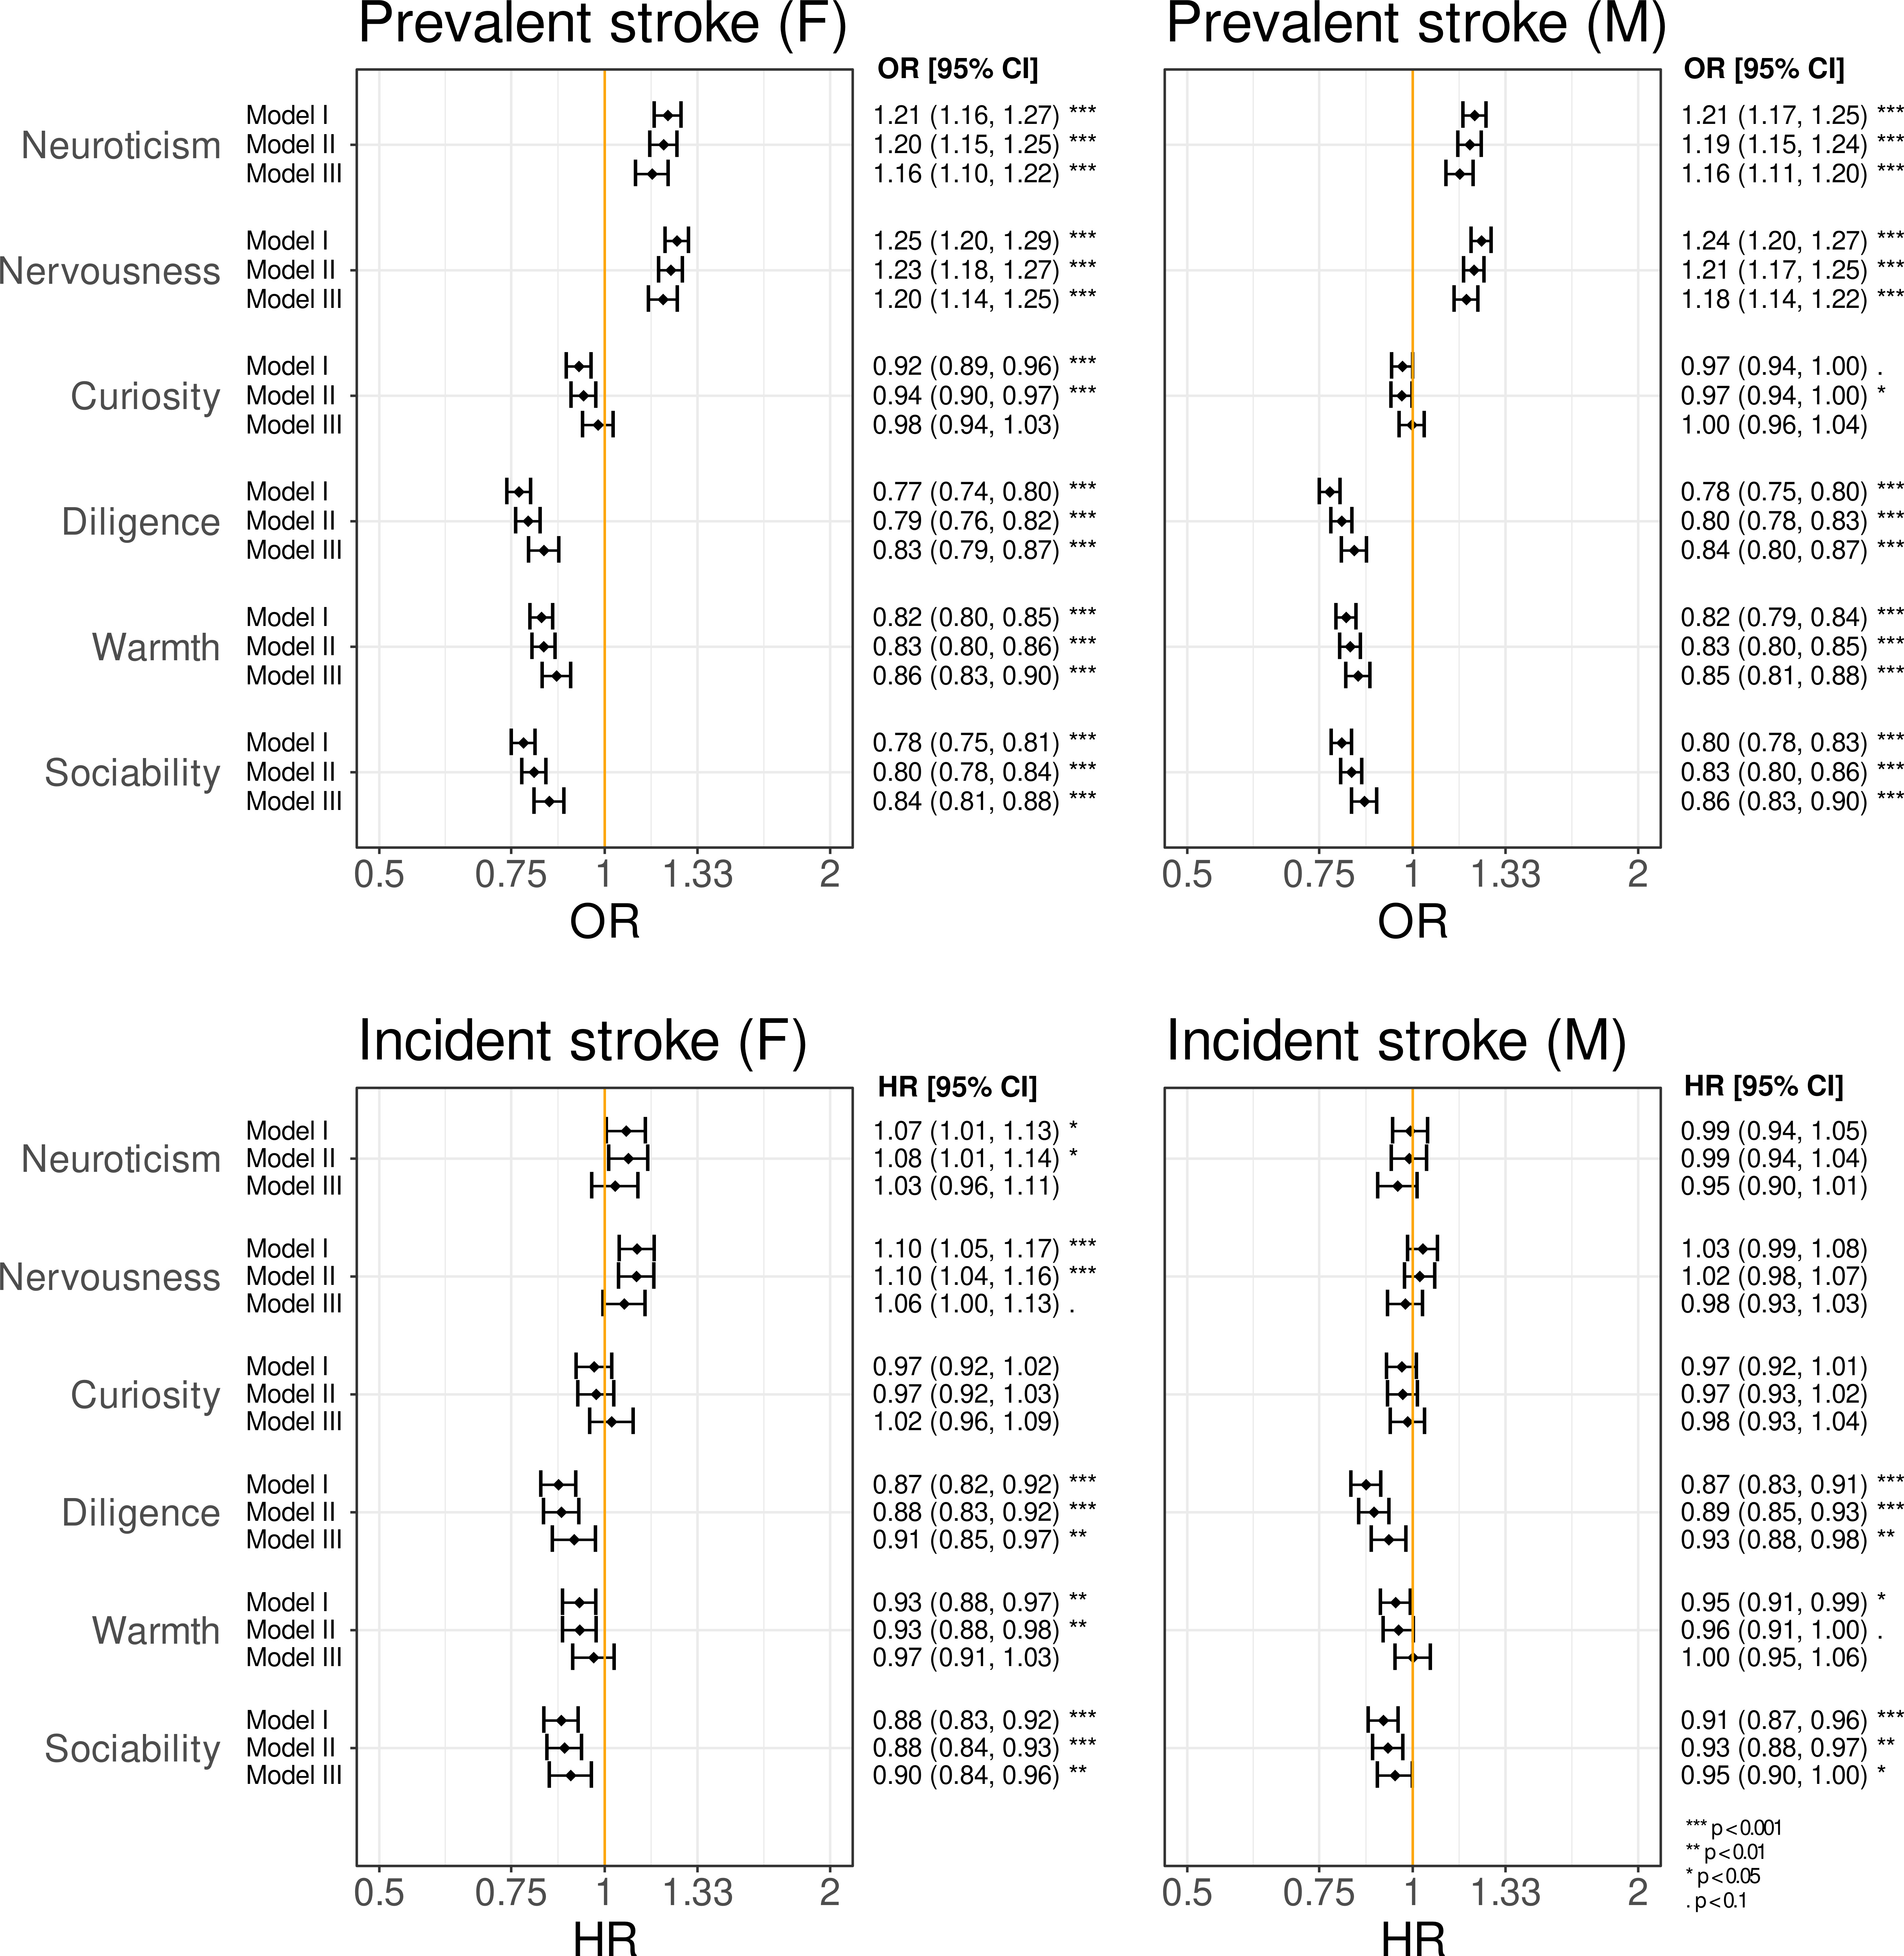 Fig. 3.
Odds ratios (OR) and hazard ratios (HR) for prevalent and incident stroke stratified by sex (female (F), male (M)). A notable difference, when compared to the non-stratified results, is that nervousness might pose a potential risk factor in stroke incidence in females but not in males.
The associations of the personality trait proxies with stroke occurrence after
baseline assessment (stroke incidence) are shown in Fig. 2. Model I, revealed
that neuroticism [HR = 1.03; 95% CI = (0.99; 1.07); (p = 0.226)] was
not significantly associated with the incidence of stroke. However, its proxy
nervousness [HR = 1.06; 95% CI = (1.02; 1.10); (p = 8.24
Sex-stratified analyses were conducted in order to assess sex specific differences between the associations of the personality proxies with stroke incidence (Fig. 3). In females, neither neuroticism [HR = 1.03; 95% CI = (0.96; 1.11); (p = 0.373)], nervousness [HR = 1.06; 95% CI = (1.00; 1.13); (p = 0.068)], curiosity [HR = 1.03; 95% CI = (0.96; 1.09); (p = 0.530)], diligence [HR = 0.91; 95% CI = (0.85; 0.97); (p = 0.006)], warmth [HR = 0.97; 95% CI = (0.91; 1.03); (p = 0.295)] or sociability [HR = 0.90; 95% CI = (0.84; 0.96); (p = 0.002)] show significant associations with stroke incidence. In males, neuroticism [HR = 0.95; 95% CI = (0.90; 1.01); (p = 0.137)], nervousness [HR = 0.98; 95% CI = (0.93; 1.03); (p = 0.407)], curiosity [HR = 0.98; 95% CI = (0.93; 1.04); (p = 0.564)], diligence [HR = 0.93; 95% CI = (0.88; 0.98); (p = 0.007)], warmth [HR = 1.00; 95% CI = (0.95; 1.06); (p = 0.972)] and sociability [HR = 0.95; 95% CI = (0.90; 1.00); (p = 0.049)] were also not significantly associated with stroke incidence.
To our knowledge, this is the first UK Biobank (UKB) study to investigate the effect of personality traits on the risk of experiencing non-fatal stroke events. We found that diligence and sociability were associated with a lower risk for stroke. However, no significant associations were observed between the remaining personality traits, including neuroticism, and the risk of developing stroke.
Personality is tightly interlinked with several health-related behaviours, such as exercise and alcohol consumption, which are also deemed strong determinants for stroke risk [7, 39, 40]. Thus, it is plausible that personality traits themselves can influence the risk of stroke throughout an individual’s lifetime. In both the cross-sectional and longitudinal analyses, diligence was associated with a lower risk for stroke. This parallels prior findings by Jokela et al. [23] where conscientiousness was protective against stroke mortality in the pooled results from US-based cohorts of approximately 25,000 participants. Conscientious individuals are often self-disciplined, cautious, persistent, and have been shown to be more physically active, have healthier eating habits, smoke less and engage in fewer injury prone behaviours (e.g., risky driving, violence) [41, 42]. As we accounted for all known conscientiousness-related behaviours that could affect stroke risk in UKB, with the exception of injury prone behaviours, it is plausible that high conscientiousness confers psychosocial or psychobiological protections against stroke [43, 44].
When it comes to extraversion, characterised by outgoing, talkative and energetic qualities, the general health related benefits are inconsistent between studies [16]. In the current analysis, the sociability proxy revealed a lower risk for both prevalent and incident stroke. However, neither Nakaya et al. [22] nor Shipley et al. [21] found effects of extraversion on stroke mortality in Japanese and British populations, respectively. In contrast, Jokela et al. [23] deemed extraversion to be a risk factor for stroke mortality. A possible explanation for these discrepancies may be the use of stroke mortality as the outcome, rather than the current approach including non-fatal stroke events. The inclusion of non-fatal stroke events results in more cases and, in turn, a higher statistical power to detect potential associations. The contradicting results may also be due to cultural differences between the study samples, as extraversion may lead to differing social effects in extraverted or introverted nations [45, 46]. According to Hans Eysenck, extraverts and introverts seek different levels of social interaction due to their differences in naturally occurring arousal levels [47, 48]. Social activity has been associated with positive cardiovascular effects, lower stroke risk, and higher overall survival rates in elderly [49, 50, 51, 52]. Thus, it is likely that the possible beneficial effects of extraversion are related to social behaviours.
Just as certain personality traits may be protective against stroke, the extent to which neuroticism has adverse health outcomes has been debated in the realm of stroke and cardiovascular disease [53]. Neuroticism, and its proxy nervousness, were significantly associated with an elevated prevalence of stroke, but not with the incidence of stroke in the fully adjusted model. Previous work has reported neuroticism to be a risk factor for coronary heart disease, but this has not been established for stroke [21, 22, 23]. Given that neuroticism, which encompasses strong negative affect and social inhibition, may increase in response to traumatic events [54], it may be of more interest after a stroke has occurred [55, 56]. Indeed, high neuroticism has been linked with decreased QoL after stroke, fewer health promoting behaviours, and increased risks of post-stroke depression, fatigue and apathy [17, 18, 19, 20].
The strengths of this study included the extensive data contained in the UKB, including demographic information, official medical records, lifestyle information, various health and anthropomorphic measurements and personality related questionnaires. Particularly, the official medical records allowed us to reliably identify stroke cases, but also participants with other conditions such as diabetes or certain psychological disorders. The UKB consisted of information from over half a million participants and contained 3312 confirmed cases of stroke incidence over a median follow-up time of 7 years. This provided high statistical power and the possibility to perform additional sex-specific analyses. In addition, while prior studies focused primarily on stroke mortality our study included stroke morbidity as well. Finally, using proxies for all Big Five personality traits allowed us to cover various aspects of human personality, albeit in a fairly broad manner.
One of the limitations of this study was the inference of the Big Five personality traits using proxies. Although great care was taken into the development of these proxies, their association to the defined Big Five personality traits has not been extensively verified. However, the construction of the proxies followed those of other established short-form personality trait questionnaires [57]. For example, the Midlife Development Inventory [58] and the Big Five Inventory [59], consist of 4 to 5 questions to characterise each trait. Although some neuroticism related variables were utilized for all the proxies, their usage has been adapted (i.e., by using the inverse answer option). By combining these adapted variables with other relevant variables, we believe the proxies approximate the respective traits. The broadness of the Big Five personality traits can be considered another limitation of the study. Nevertheless, it allowed us to pinpoint conscientiousness-like and extraversion-like traits as protective factors against stroke, thus suggesting future studies to focus on these traits. Finally, a limitation within the UKB cohort is the high prevalence of the white ethnicity (~94%).
To conclude, analysis of over 3300 stroke cases within the UK Biobank revealed that diligent and sociable individuals were associated with a lower risk of stroke. The potential protective effects of diligence and sociability were not fully explained by health or lifestyle factors alone. Clarifying which particular facets of conscientiousness and extraversion may influence the risk of stroke, could improve support programs and help prevent the devastating effects of stroke.
BFI, big five inventory; BMI, body mass index; CI, confidence interval; CVD, cardiovascular disease; DBP, diastolic blood pressure; EPQ, Eysenck personality questionnaire; HR, hazard ratio; ICD, international classification of disease; MET, metabolic equivalent per time; MVPA, moderate-to-vigorous physical activity; OR, odds ratio; QoL, quality of life; SBP, systolic blood pressure; SD, standard deviation; TDI, Townsend deprivation index; UK, United Kingdom; UKB, UK Biobank.
MJTR, ADD, GR and HBS designed the research study. MJTR performed the research. ADD, GR and HBS provided help and advice on methodology. MJTR analysed the data and wrote the manuscript. All authors contributed to editorial changes in the manuscript. All authors read and approved the final manuscript.
The UKB study was approved by the North West Multi-Centre Research Ethics Committee, the Regional Ethics Committee of Uppsala, Sweden and all participants provided written informed consent (approved UKB application no. 25308 and 30172).
We thank the participants of UK Biobank that contributed to this valuable resource.
GR was supported by Svenska Sällskapet för Medicinsk Forskning (Postdoctoral fellowship 2019), and HBS was supported by grants from AFA Insurance Foundation (160345) and Swedish Research Council (VR 2014-02912).
The authors declare no conflict of interest.
Publisher’s Note: IMR Press stays neutral with regard to jurisdictional claims in published maps and institutional affiliations.