
Academic Editor: Mateusz Maciejczyk
Background: This report aims to detail the use of the
phosphorescence oxygen analyzer for in vitro investigation of thymic
responses to pharmaceutical agents, in particular immunosuppressants and
immunomodulators. Sirolimus (a highly specific inhibitor of the ‘molecular target
of rapamycin’, mTOR) and ozanimod (an agonist of the sphingosine 1-phosphate
receptor, recently approved for treatment of multiple sclerosis and ulcerative
colitis) are used for this purpose. Methods: Thymic fragments from mice
were placed in glass vials containing phosphate-buffered saline, bovine albumin,
and Pd(II) meso-tetra (sulfophenyl) tetrabenzoporphyrin. The vials were sealed
from air, and the cellular oxygen consumption was monitored as function of time.
Results: The decline of dissolved oxygen concentration with time
(d[O
This study reports on the effects of sirolimus (in vitro study) and ozanimod (in vivo and in vitro studies) on thymocyte respiration. It details the procedure of measuring thymocyte respiration (including proper sample collection and processing). It also promotes the assay (by applying proper experimental conditions) as a surrogate biomarker for studying the mode-of-action and cytotoxicity of immunosuppressants.
The thymus is a primary tissue for giving rise to self-tolerant effector T cells [1]. This organ is particularly sensitive to environmental (e.g., reactive oxygen species and immunotoxins) and biological (e.g., aging) variables, which could result in ‘thymic involution’. Derangements in such states include a declined output of the naïve T cells and degenerations of the thymic structure [2]. Consequently, the reduction in circulating T cells with age has been linked to susceptibilities to infection, autoimmunity, and neoplasm. Importantly, the use of antioxidants that target mitochondria (the main source of oxidative stress) may delay thymic involution [3].
The term ‘cellular respiration’ infers to the reactions that result in oxygen reduction in cytochrome oxidase, which is the main metabolic pathway that drives ATP synthesis. Thus, mitochondrial respiration provides insight into cellular function on the whole. In this report, we describe the use of our phosphorescence oxygen analyzer to measure cellular mitochondrial respiration in thymic fragments from mice (referred to as, ‘thymocyte respiration’) [4]. This technique was recently used to investigate various animal models of human diseases [5, 6, 7], and it can be applied to investigate the thymus. The method allows measuring the direct effect of compounds, such as immunosuppressants (e.g., sirolimus) on thymocyte respiration [8, 9]. It also allows such measurements after in vivo treatments of animals with a specific immunomodulator (e.g., ozanimod). Both types of experiments are reported in this study as examples.
Previous in vitro studies have shown that sirolimus lowers the rate of cellular respiration [8, 9]. These results support the findings that mTOR controls the flux of nutrients into the mitochondria [10, 11]. Consistently, in vivo treatment with sirolimus results in thymic cortex involution due to apoptosis; this process, however, is reversible [9]. It remains to be seen whether thymocyte respiration can be used in pre-clinical studies as a surrogate biomarker for studying the mode-of-action and cytotoxicity of immunosuppressants.
Ozanimod is a recently approved drug for treatment of multiple sclerosis (U.S. Food and Drug Administration [FDA], 2020) and ulcerative colitis (FDA, 2021) [12]. This potent immunosuppressant is an agonist of the sphingosine 1-phosphate receptors 1 and 5 [13]. These G protein-coupled receptors are targeted by sphingosine-1-phosphate, and are fundamental for modulating immune cells, mainly lymphocyte trafficking from lymphoid tissues [14].
The Pd phosphor Pd(II) meso-tetra (sulfophenyl) tetrabenzoporphyrin sodium salt
(C
C57BL6 mice (typically, 8 to 16 weeks old) were housed at 22 °C with
60% humidity and 12-h light-dark cycles. Rodent chow and filtered water were
provided ad libitum. Sodium pentobarbital (90
The thymus was quickly removed with a sterile scalpel and immersed in
ice-cold phosphate-buffered saline (PBS; 137 mM NaCl, 2.7 mM KCl, 4.3 mM
Na
Ozanimod was given by oral gavage at 0.6 mg/kg/day (0.57
The previously described (home-made) phosphorescence oxygen analyzer was used to
monitor thymocyte respiration [4, 5, 6, 7, 15, 16, 17, 18]. The principle of measurements was
based on oxygen quenching the phosphoresce of the Pd phosphor. Briefly, the above
listed Pd phosphor (absorption maximum, 625 nm; phosphorescence maximum, 800 nm)
was used as an oxygen sensor. The decay rate (1/
It is worth noting that the high noise at the start of runs (air-saturated solutions) reflects the diminutive phosphorescence that reaches the photomultiplier tube (PMT), as dissolved oxygen quenches the light. By contrast, the low noise at the end of runs (oxygen-depleted solutions) reflects the augmentative phosphorescence that reaches the PMT. It is important, however, to realize that this phenomenon does not affect an accurate determination of the rate when a thymic fragment is present.
Data were analyzed on SPSS version 19 statistical package (SPSS Inc., New York, USA), using the nonparametric (2 independent samples) Wilcoxon test.
Fig. 1 shows a typical experiment involving thymocyte respiration. First, we
establish the ‘drift rate’ in the reaction mixture (PBS + albumin + Pd phosphor)
without thymic tissue. This ‘noise level’ was
 Fig. 1.
Thymocyte respiration. Representative runs from five separate
experiments are shown. Panel (A) shows the reaction mixture without thymic tissue
(drift rate). In Panels (B–C), the reaction mixtures contained a fragment of the
thymus. In Panel C, the reaction mixture also contained 1.0 mM potassium cyanide.
Cyanide inhibited thymocyte respiration, confirming oxygen was consumed in the
mitochondrial respiratory chain. Additions of glucose (10 mM) and glucose oxidase
(0.1 mg/mL) are shown. Glucose oxidase catalyzes the reaction: D-glucose +
O
The overall rate of thymocyte respiration (mean
Runs similar to the above were then performed in the presence of 270
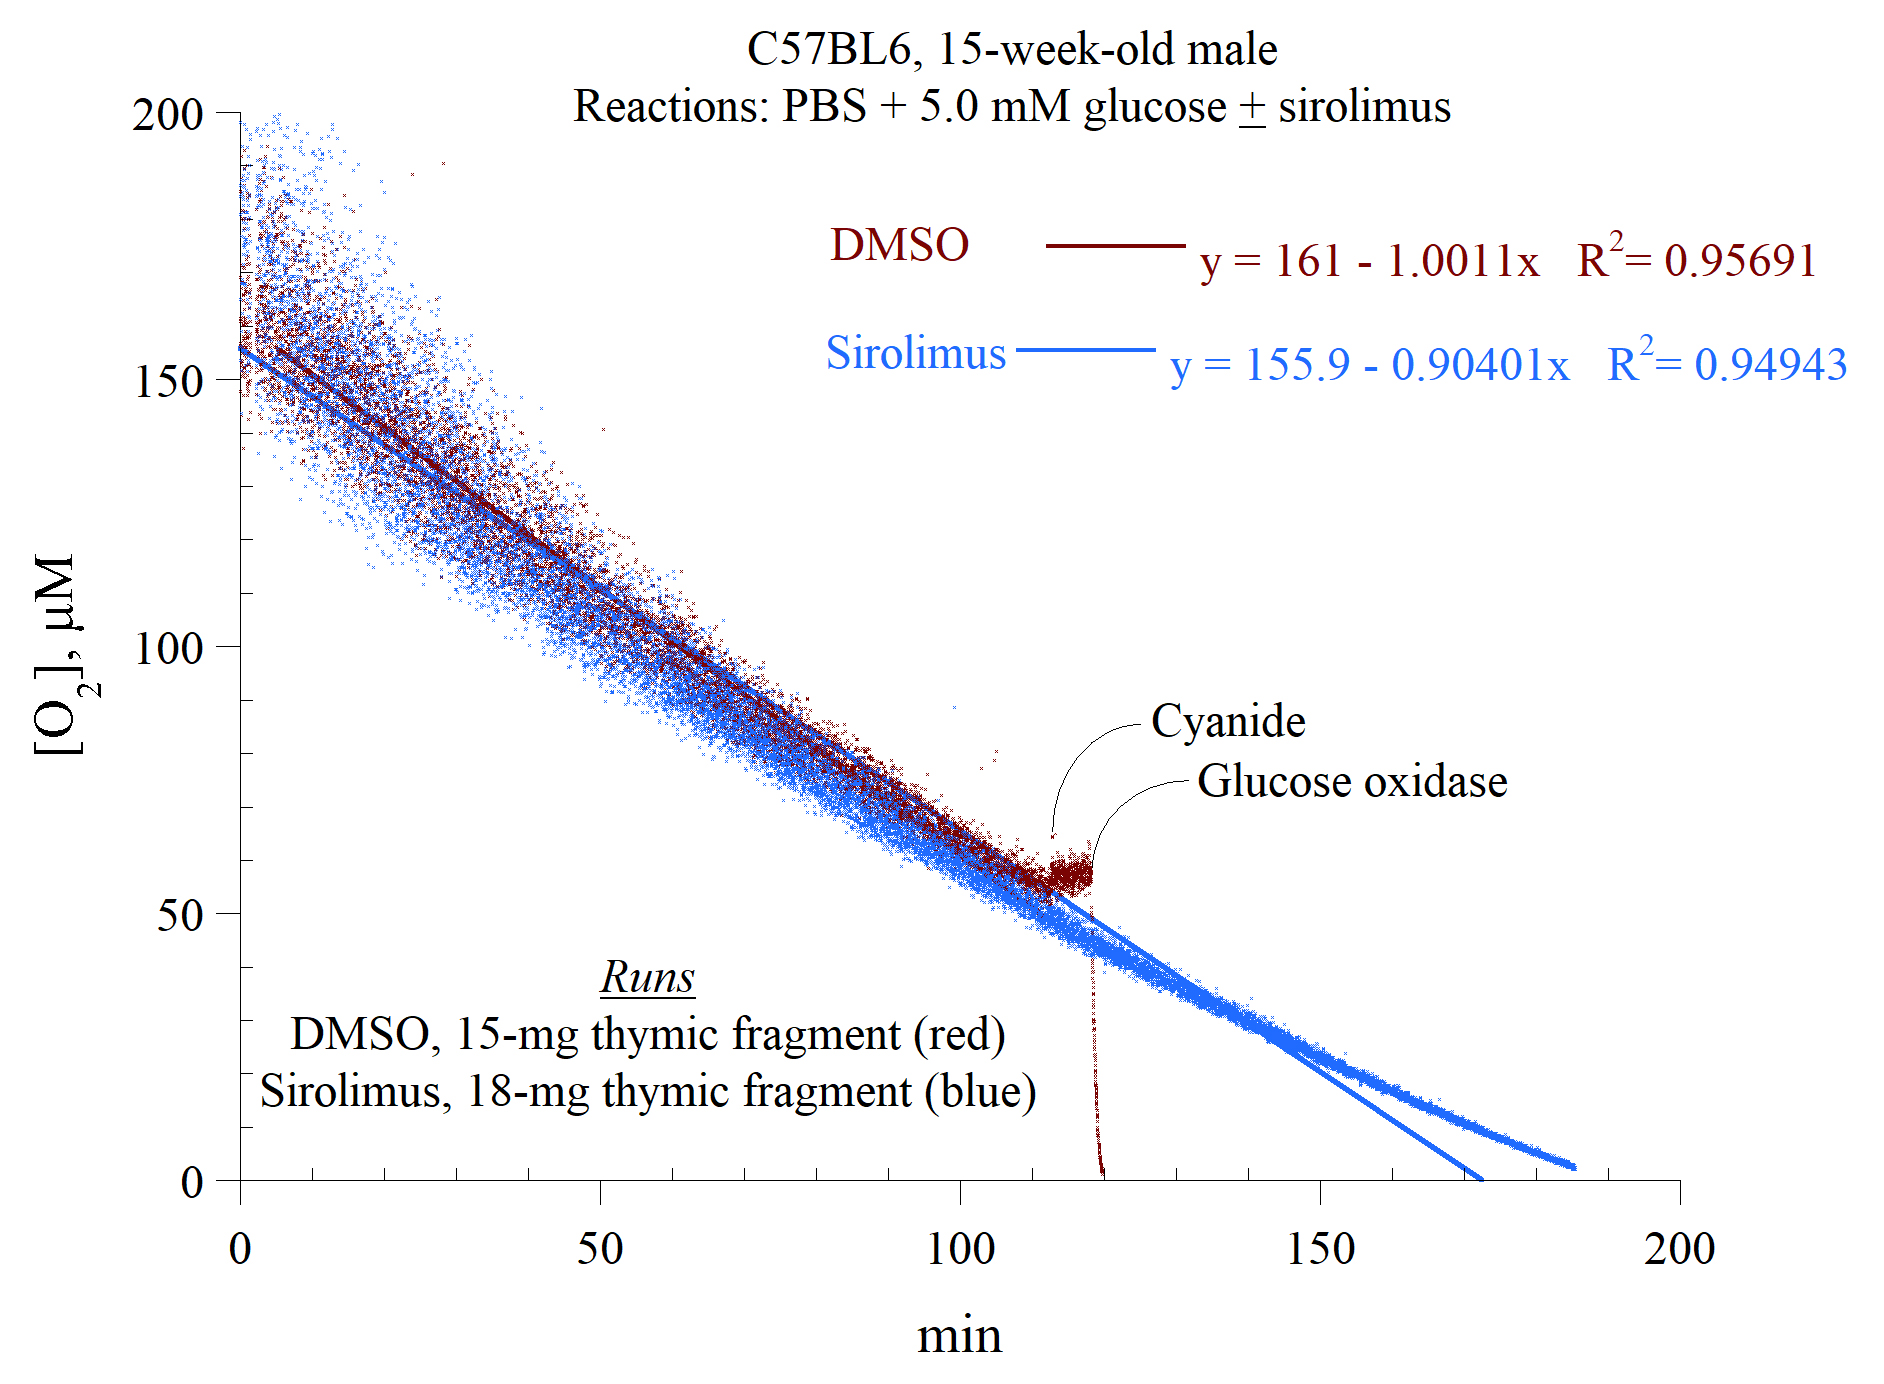 Fig. 2.
In vitro effects of sirolimus on thymocyte respiration.
The experimental conditions were as described in the legend to Fig. 1.
Representative runs from at least six separate experiments are shown. The lines
are linear fits. The rate of thymocyte respiration (
Fig. 3 shows an inhibitory effect of ozanimod on thymocyte respiration, similar
to that of sirolimus. The runs were in the presence of 0.68
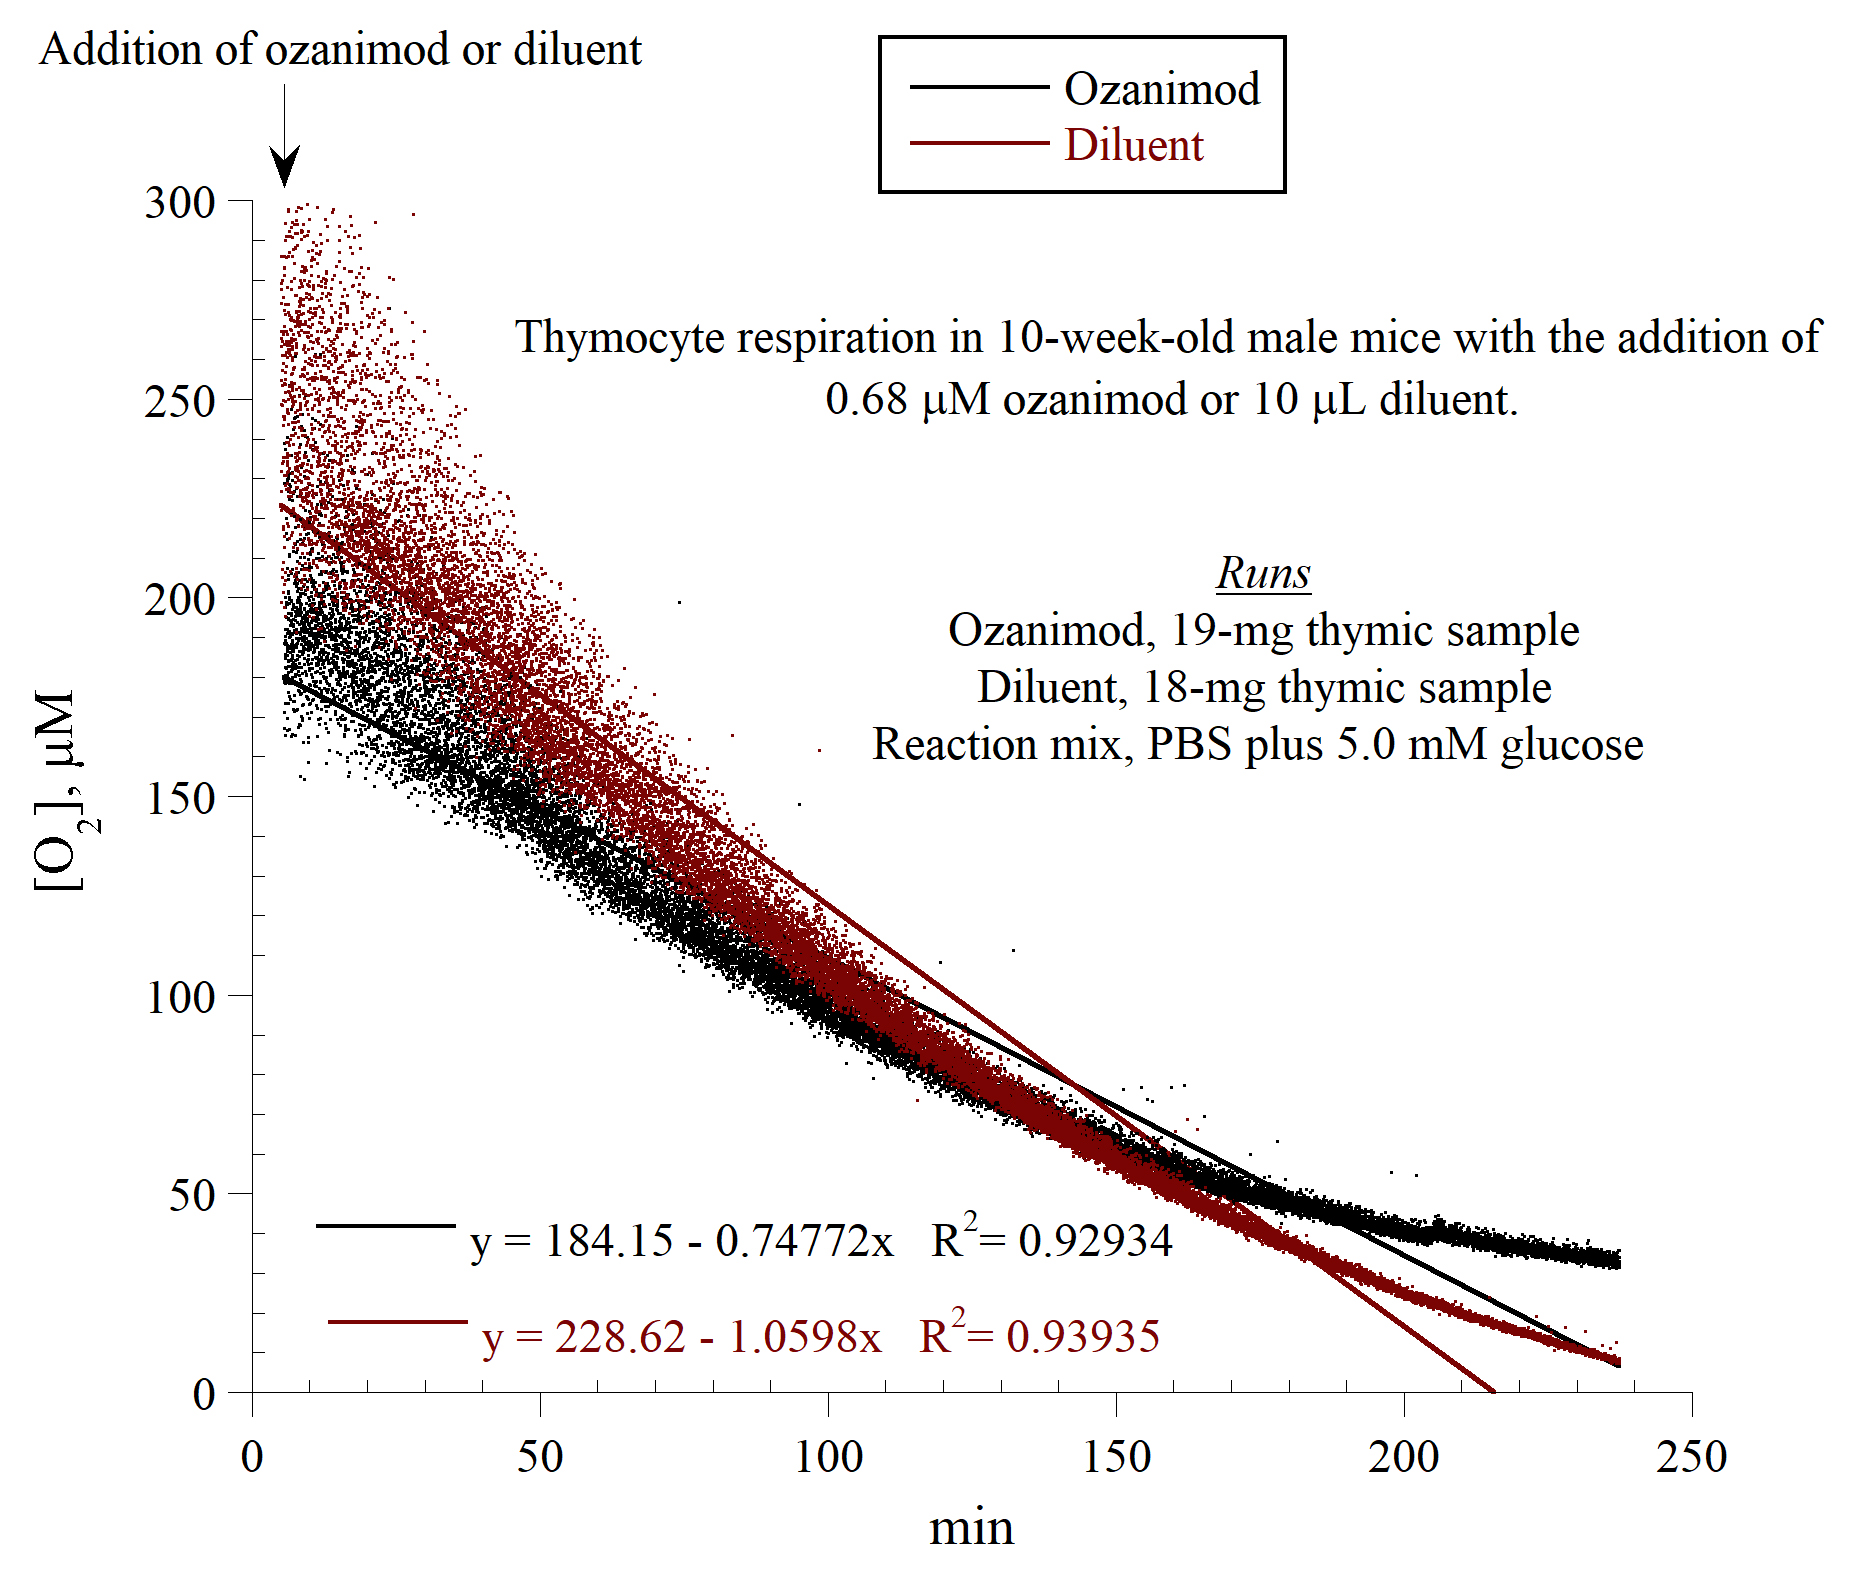 Fig. 3.
In vitro effects of ozanimod on thymocyte respiration.
The experimental conditions were as described in the legend to Fig. 1.
Representative runs from three separate experiments are shown. The rate of
thymocyte respiration (
We then examined the effects of an in vivo treatment with ozanimod (0.6
mg/kg/day, or 0.57
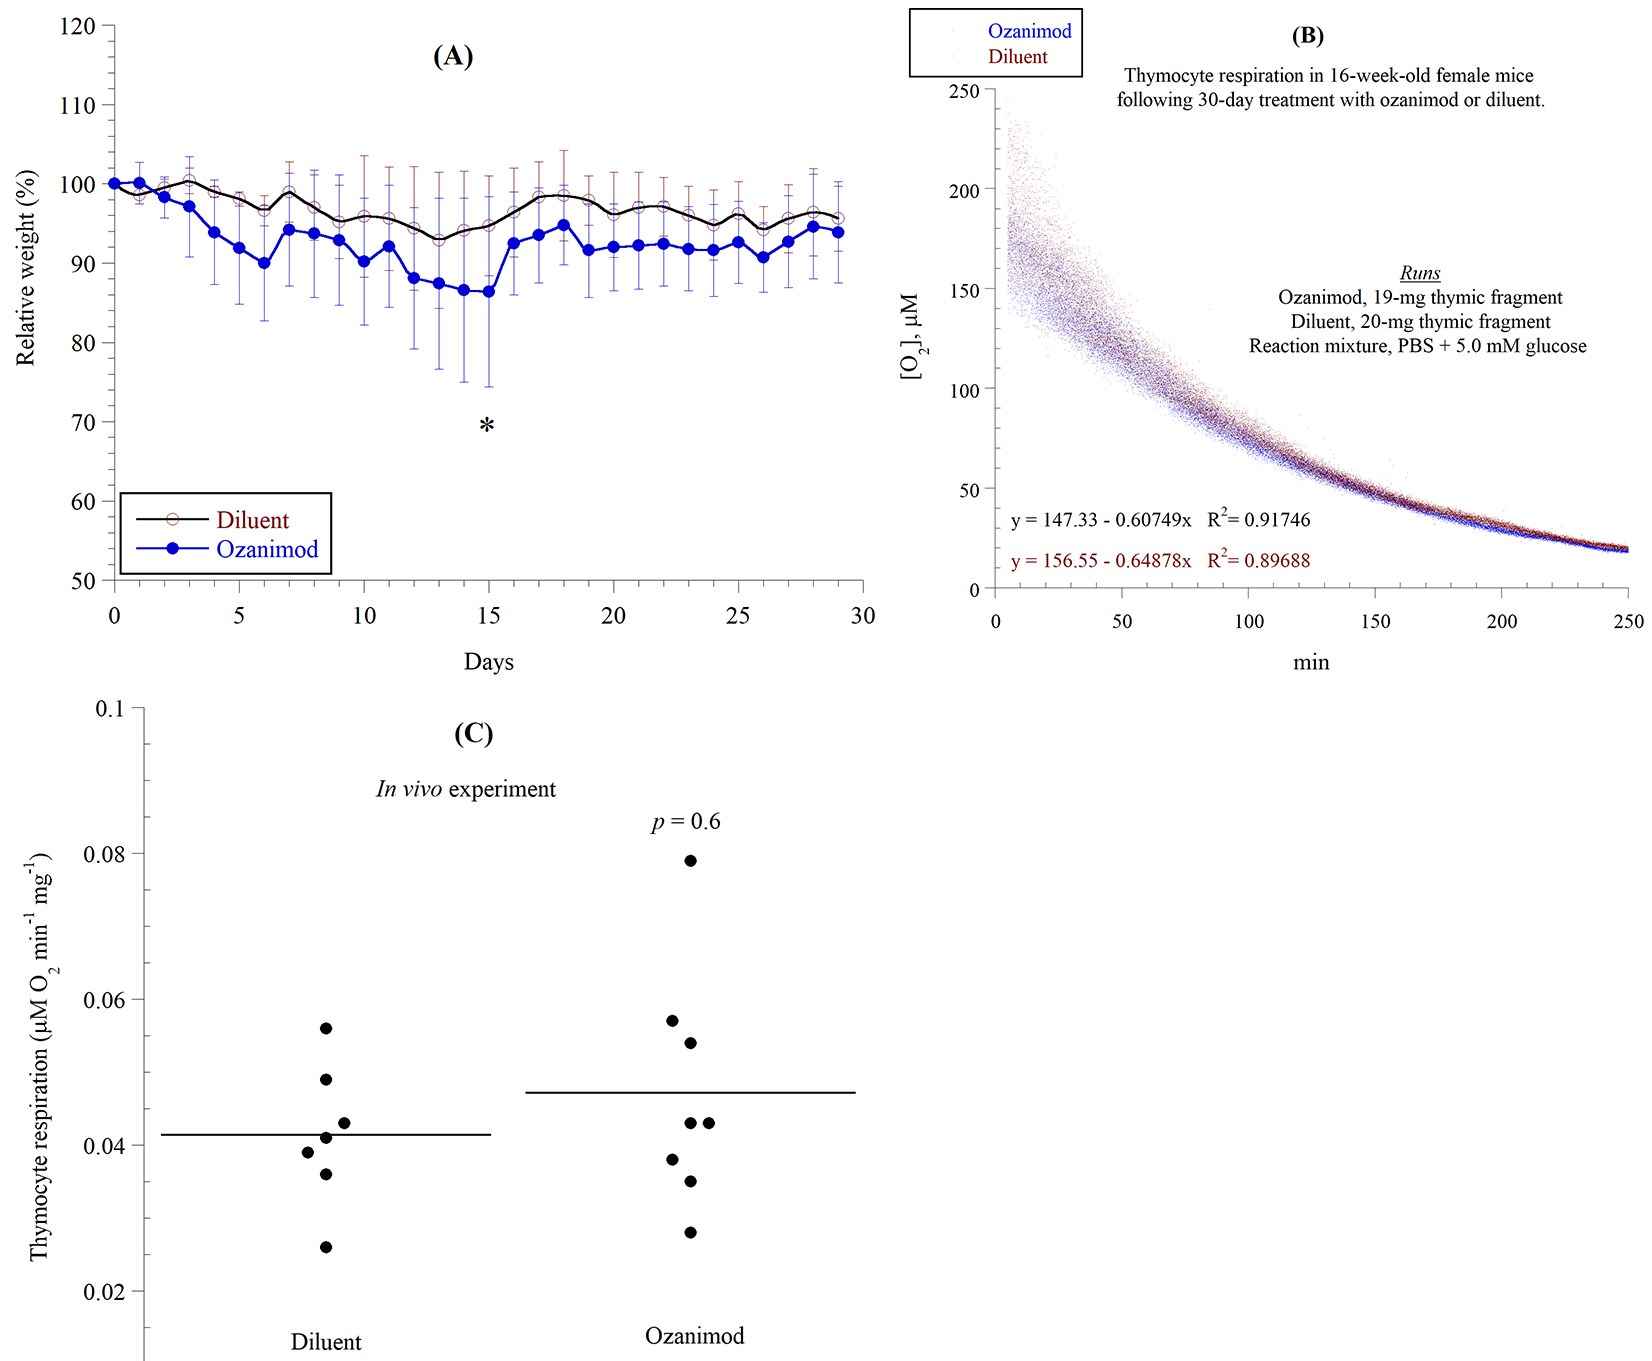 Fig. 4.
In vivo effects of ozanimod on thymocyte respiration.
C57BL6 female mice (16-week-old) were given daily ozanimod (0.6 mg/kg, or 1.36
mmol/kg) by oral gavage for 30 consecutive days. Control mice received the
diluent (10
We show here that the phosphorescence oxygen analyzer can be used to monitor thymocyte respiration in the presence of immunotoxins, or following an in vivo treatment with such compounds. This technique has been used previously in various tissues and with various types of compounds [4, 5, 6, 7, 9, 17, 18], but this is the first report of studying the effects of an agonist of the sphingosine 1-phosphate receptors (ozanimod) on the thymus.
In the in vivo study, there was no difference in the rate of thymocyte
respiration between ozanimod and its diluent (using 0.57
Assessing thymocyte respiration offers an easy functional assay for monitoring vital metabolic pathways. As previously shown, this technique is appropriate for various animal models of immune diseases [5, 6, 7], as well as for chemical compounds (toxins) that affect immunity [9, 17, 18]. Other lymphoid tissues, such as circulating or infiltrating lymphocytes, lymph nodes, and spleen can be studied in a similar way. Importantly, the assay can detect apoptosis, as this process typically activates the mitochondrial cell death pathway [17, 18]. The use of thymocyte cytoprotective agents, such as the thiol compounds (e.g., N-acetylcysteine, sodium methanethiolate, 2-mercaptoethylamine, 2-[(3-aminopropyl)amino]ethanethiol dihydrogen phosphate [WR-2721], and 2-[(3-Aminopropyl)amino]ethanethiol [WR-1065]) can be tested in conjunction with the immunotoxin(s).
It is important to note that the thymus is known to commence an age-related involution, evident by a lower output of T cells [19, 20]. Therefore, selecting the proper age for these studies is crucial. To minimize potential age and gender variations, these experiments should be performed in age-matched mice (preferably littermates). Nevertheless, in a preliminary experiment, the difference between the rate of thymocyte respiration in mice 44 to 77 days of age (n = 7) and mice 133 to 173 days of age (n = 7) was insignificant (p = 1.0).
Currently, the T cell receptor excision circles (TREC, pieces of DNA generated during T-cell receptor gene rearrangements in the thymus) serve as a functional biomarker for thymopoiesis and peripheral T cell homeostasis [21, 22]. TREC measurements can be applied only after an in vivo treatment with immunotoxin(s). Additional limitations of TREC results include its rapid intracellular degradation (disposition) and being diluted by proliferation of peripheral T cells [23]. Nevertheless, the TREC assay can complement the above described measurements of thymocyte respiration.
This study describes the use of thymocyte respiration to investigate the effects of immunotoxins on thymic fragments from mice. This functional assay is proposed as a surrogate biomarker for studying the mode-of-action and cytotoxicity of immunosuppressants. At this point, there is no established level of reduction in thymocyte respiration that signifies cytotoxicity. A dose-response reduction in the rate of thymocyte respiration rate, however, could provide a better insight into such effects.
Not applicable.
All data generated or analysed during this study are included in this published article.
A patent application on the development and use of phosphoresce oxygen analyzer is pending (Primary Investigator: Abdul-Kader Souid).
DMSO, dimethyl sulfoxide; mTOR, molecular target of rapamycin; TREC, T cell receptor excision circles.
All authors contributed to the study conception and design. Material preparation, data collection and analysis were performed by [MA, MH, and FA]. The first draft of the manuscript was written by [A-KS] and all authors commented on previous versions of the manuscript. All authors read and approved the final manuscript.
Ethics approval: The study was approved from the UAE University Animal Research Ethics Committee (Ref. ERA-2019-6026). Consent to participate: Not applicable.
Not applicable.
This study was funded by the College of Medicine & Health Sciences UAE University (31M470, PI: Dr. Mariam Alshamsi).
The authors declare no conflict of interest.
Publisher’s Note: IMR Press stays neutral with regard to jurisdictional claims in published maps and institutional affiliations.