
Academic Editors: Massimo Conese and Lorenzo Guerra
Background: Cystic fibrosis (CF) is an autosomal recessive hereditary
disease that leads to the production of thickened mucus in the lungs, favouring
polymicrobial infections, such as chronic lung infections with the bacterial
opportunistic pathogen Pseudomonas aeruginosa. Method: A
biofilm model in combination with an adapted sampling and GC-MS analysis method
were applied to in vitro studies on different variables influencing the
composition of the extracellular volatile metabolome of P. aeruginosa.
Results: A significant influence on the metabolome could be demonstrated
for the culture medium as well as the atmosphere during cultivation (aerobic or
anaerobic). Furthermore, a significant influence of the mucoid
(alginate-overproducing) phenotype of the bacterium on quantity and composition
of volatile organic compounds could be observed. Based on the results a solid
culture medium was developed to simulate the nutrient conditions in the lungs of
a CF patient. The extracellular volatile metabolome of bacterial strains
P. aeruginosa ATCC 10145, PAO1 and FRD1 was characterized under CF-like
conditions. Conclusions: Bacterial strain-dependent metabolites were
identified. When P. aeruginosa PAO1 and FRD1 clinical isolates were
compared, 36 metabolites showed significant variations in intensities. When the
clinical isolates were compared with the reference strain (P. aeruginosa
ATCC 10145), 28 metabolites (P. aeruginosa PAO1) and 70 metabolites
(P. aeruginosa FRD1) were determined whose peaks showed significant
deviation (p
Cystic fibrosis (CF) is an autosomal recessive hereditary disease. The underlying cause are mutations in the cystic fibrosis transmembrane conductance regulator (CFTR) gene that encodes a transmembrane channel regulating anion transport [1]. CFTR dysfunction causes the blockage of chloride transport channels across epithelia in the affected organs so that the osmotic balance via the epithelia cannot be maintained. In the respiratory tract, this leads to the secretion and deposition of a highly viscous mucus that impairs mucociliary clearance of inhaled microorganisms. The mucus provides a favourable nutrient source for microorganisms. The CF airway microbiome consists of complex microbial communities [2] and progress of the disease is characterized by the colonization and infection of the respiratory tract with pathogenic microorganisms [1, 3]. P. aeruginosa is one of the most common opportunistic bacterial pathogens in CF patients. With increasing age of CF patients a higher frequency of chronic infection with P. aeruginosa can be observed. The persistence of P. aeruginosa is due to the occurrence and growth in biofilms and the formation of biofilm-like cell aggregates inside the mucus [4]. P. aeruginosa can actively penetrate the mucus where hypoxic or anoxic conditions prevail, and where the bacteria switch from aerobic respiration outside the mucus to growth via anaerobic respiration with nitrate as the terminal electron acceptor (denitrification) [5, 6]. Biofilm formation is the major survival mechanism of P. aeruginosa because biofilms show protection against innate and adaptive immune defence mechanisms of the patient and increased tolerance to antibiotics. Although CF patients infected with P. aeruginosa are usually treated with antibiotics, a chronic bacterial infection can hardly be prevented. The main cause of premature death of CF patients is failure of lung function due to chronic bacterial infections [1, 3, 7].
Through adaptive processes of P. aeruginosa in chronically infected CF airways diverse non-mucoid and mucoid phenotypes emerge. P. aeruginosa can produce at least three distinct exopolysaccharides, namely Psl, Pel, and alginate, that can be expressed in the P. aeruginosa aggregates from CF airways [8]. In mucoid strains O-acetylated alginate is the primary exopolysaccharide that is overproduced as a major exopolysaccharide component of the biofilm matrix. Biofilms of mucoid P. aeruginosa variants are of clinical importance in chronic infections because alginate slime layers result in enhanced protection of the bacteria against host immune defences and antibiotics compared to biofilms of non-mucoid bacteria.
Typically, infections of the lung with microbial pathogens are diagnosed by cultivation of respiratory samples such as expectorated or induced sputum, oropharyngeal swabs and bronchoalveolar lavage [9]. However, these methods have been described as disadvantageous due to the invasive approach, the high expenditure of time and the poor specificity and sensitivity [10, 11, 12, 13]. Alternatives are time-saving culture-independent molecular methods such as PCR-based techniques. Another approach proposed may be the clinical application of the extracellular volatile metabolome analysis. The non-invasive examination of metabolic volatile organic substances (mVOCs) in exhaled breath has been proposed as an alternative diagnostic method to identify bacterial pathogens [14, 15]. However, this requires a preliminary examination of the metabolome of the relevant bacterial pathogens under CF-equivalent conditions.
In recent years, various studies of the intra- and extracellular metabolome of different P. aeruginosa strains have been published as summarized in the review of Mielko et al. [16]. Various extracellular volatile metabolites of P. aeruginosa were detected under laboratory conditions. Volatile metabolites of P. aeruginosa identified included acetic acid, acetaldehydes, acetones, 2-butanones, 2-nonanones, 1-undecenes, 2,4-dimethyl-1-heptenes, ethanol, 1-decanol, hydrogen sulphides, dimethyl sulphides, dimethyl disulphides, dimethyl trisulphides, methanethiol and hydrogen cyanides [15, 17, 18, 19, 20, 21]. Bos et al. [14] reported the disadvantage of the limited comparability of the studies published so far, with respect to the different experimental conditions, such as the variation of bacterial strains (genomic variation), cultivation conditions (culture medium, incubation time, and growth temperature), bacterial growth phases, duration of headspace sampling, VOC pre-concentration methods and type of chemical analysis [14].
In vitro studies of volatile organic compounds produced by P. aeruginosa were commonly conducted on planktonic cultures in liquid growth media such as LB broth or various media mimicking the nutritional conditions of CF airways such as synthetic CF sputum medium [22] or artificial sputum medium (ASM) in various modifications [23, 24].
Based on a standardized methodology, which the authors have published previously [25], the study shown here aims to investigate the influence of cultivation conditions on the metabolome of P. aeruginosa. The extracellular metabolome of three strains of P. aeruginosa, strain ATCC 10,145 (type strain), strain PAO1 (an acute infection isolate) and strain FRD1 (a chronic infection isolate) cultivated under aerobic and anaerobic conditions were analysed and compared. Furthermore, the influence of the culture medium on the extracellular volatile metabolome was investigated and a culture medium was developed to mimic real conditions as much as possible Using this medium and the previous studies, bacterial biofilms of P. aeruginosa were cultured in the laboratory under conditions approximating those in a CF lung. Finally, an analysis of the extracellular volatile metabolome was performed under these conditions.
In this study, three strains of P. aeruginosa were used for biofilm cultivation, including type strain P. aeruginosa ATCC 10145 (DSM 50071), wild-type strain P. aeruginosa PAO1 originally isolated from a wound infection [26] and mucoid (alginate-overproducing) strain P. aeruginosa FRD1 (mucA22 mutation) isolated from the sputum of a CF patient [27].
Three agar media were employed for biofilm cultivation. As a non-selective
complex growth medium, LB agar was used (35 g L-1 LB agar composed of (per L) 10
g tryptone, 5 g yeast extract, 5 g NaCl and 15 g agar, pH 7.0
For simulating growth conditions in the mucus of CF airways, Artificial Sputum
Medium (ASM) was used as a solid agar medium based on the formulation of liquid
ASM described by Sriramulu et al. [23] and Kirchner et al.
[24]. ASM agar without (ASM) and with added KNO
Biofilms were grown as confluent bacterial lawns on the surface of the agar
media as an in vitro biofilm model of P. aeruginosa described
before [25]. In brief, single colonies of cultures grown overnight at 37
For biofilm analysis, biomass was scraped from the agar surface using a sterile
metal spatula, and suspended in 2 mL deionized water. The suspensions were
vortexed for 2 min to disperse the biofilm cells. Serial dilutions of the
suspensions were prepared in deionized water. For determination of total cell
counts in the biofilm suspensions, bacteria were stained with the fluorochrome
4’,6-diamidino-2-phenylindole (DAPI). 1 ml of DAPI solution (25
Headspace sampling of the biofilm cultures was performed by TFME using
commercial PDMS films (0.35 mm
The loaded sorption films were analysed by direct coupling of a thermodesorption
system (TDS 3, Gerstel GmbH & Co. KG, Mühlheim a.d.R., Germany) incl.
autosampler (TDS-A2, Gerstel GmbH & Co. KG, Mühlheim a.d.R., Germany) with a
gas chromatograph (Agilent 6890 GC, Agilent Technologies Inc., Waldbronn,
Germany) and a quadrupole mass spectrometer (Agilent 5975 MSD, Agilent
Technologies Inc., Waldbronn, Germany). Adsorbed analytes were desorbed in the
TDS at 200
The data obtained from the TD-GC-qMS analyses, (Agilent MSD Chemstation data
format) were first converted into Agilent MassHunter data format using MassHunter
GC/MS Translator software (Agilent Technologies Inc., Santa Clara, USA).
Subsequently, a conversion into the “.abf” data format was carried out using the
software Reifycs Analysis Base File Converter (Reifycs Inc., Tokyo, Japan). This
enables feature analysis using MS-DIAL (version 4.18, RIKEN, Wako, Japan), which
performs deconvolution and annotation of the data. The parameters used for
deconvolution, feature analysis and annotation are listed in
Supplementary Table 1 . The identification of the analytes based on the
obtained EI-MS spectra was performed by using MS databases. The metabolomics
specific GC-MS database MassBank of North America (MoNA) by Oliver Fiehn was used
and analytes with a similarity score of
The statistical evaluation of the deconvoluted data was carried out with a standardized workflow. For this purpose, a peak intensity cut-off of 1000 counts and a similarity score cut-off of 70% was applied. Missing values were not refilled. To reduce the dimensionality of the data and to identify differe nces and similarities, non-supervised Principal Component Analysis (PCA) was performed using SIMCA software (Version: 16.0.2.10561; Satorius AG, Göttigen, Germany).
PCA is an algorithm that helps to reduce dimensionality while retaining most of the variance of the data that contains useful information and is frequently used in omics. Each principal component is identified by the direction and the amount of variance in the data and is a linear combination of the original variables. Each sample can then be represented by relatively few principal components instead of thousands of metabolites. For example, in Fig. 1a, the PC1 axis is explaining the variance between both samples groups which is the growth under aerobic or anaerobic conditions and on the PC2 axis, the variance within each of the sample groups is explained. For further information regarding the interpretation of a PCA, we recommend the publication of Ringnér [28]. Scores and loadings as well as the variance are calculated. Potentially interesting metabolites were further statistically analyzed by parametric significance test (t-test; two-sided distribution and heteroscedastic). The significance was evaluated using the p-value and classified into three significance levels, 0.001, 0.01 and 0.05.
 Fig. 1.
Graphic representation of the evaluation for the differentiation
of cultivation conditions ((aerobic (blue) vs. anaerobic (red) for the bacterial
strains P. aeruginosa FRD1 and P. aeruginosa PAO1 using PCA and
t-test. The biofilms were cultured aerobically on LB medium and
anaerobically on LBN medium for 48 h at 37
With the described materials and methods, both microbiological and analytical sample preparation is possible. The methods used for the characterization of the bacterial biofilms, for the sample preparation using polydimethylsiloxane (PDMS) sorbent films and for the analysis of the extracellular volatile metabolites are described.
In general, research on the extracellular volatile metabolome of P. aeruginosa can be divided into five areas, (1) identification and differentiation of bacterial strains, (2) analysis of metabolic changes due to external factors, (3) identification of unknown metabolites, (4) identification of metabolic profiles using genome structure [16], and (5) effector function of volatiles in intermicrobial interactions such as the recently reported growth inhibition of the fungus Aspergillus fumigatus, relevant in CF airway infections, by P. aeruginosa volatiles [29]. Bos et al. [14] have already criticized the lack of comparability of published metabolome studies on different bacterial pathogens. Especially metabolome studies in the context of a disease, such as CF, should be performed in vitro under conditions like those in the human body. This necessity is due to the variability of the metabolome of bacteria to different external influences, such as nutrient deficiency and oxygen concentration. Furthermore, P. aeruginosa is a bacterium that is particularly well adapted to different environmental conditions and is capable of changing the phenotype , e.g., development from a non-mucoid to a mucoid variant during chronic CF airway infections [3]. In the following the influence of the phenotype and growth conditions on the metabolome of P. aeruginosa is shown.
An in vitro agar plate biofilm model was used throughout the study. The
biofilms of P. aeruginosa were grown as confluent bacterial lawns
directly on the surface of three different solid agar media, unsupplemented (LB,
PIA, ASM) and supplemented with 100 mM KNO
In the present study, monitoring of aerobically and anaerobically biofilm growth
at 37
Under anaerobic conditions no growth was observed on unsupplemented agar media,
while addition of KNO
Koehler et al. [25] have shown that oxygen availability (aerobic vs.
anaerobic growth) affects the metabolome of biofilms of the type strain
P. aeruginosa ATCC 10145. In the present study, the investigation of the
influence of oxygen availability was extended to two different clinical isolates
of P. aeruginosa with two different phenotypes, the non-mucoid strain
P. aeruginosa PAO1, and the mucoid strain P. aeruginosa FRD1.
The analysis of mVOCs was performed by using the in vitro model
described by Koehler et al. [25] on biofilms grown at 37
Eight biological replicates (biofilm cultures) were used to analyse the mVOCs. The mVOCs of the bacterial strains in the presence or absence of oxygen were identified from the deconvoluted TD-GC-qMS data using the spectra database MONA. In order to differentiate the composition of the atmosphere during cultivation (aerobic and anaerobic) by means of two main components, a PCA was performed. For this purpose, score plots that display the samples according to their position on the PC1 and PC2 (Fig. 1a,1c) as well as loading plots (Fig. 1b,1d) that show the position of the putatively identified metabolites were generated. Furthermore, the significance of the variation in the peak intensity of the metabolites under aerobic and anaerobic conditions was determined using a t-test. The mean values of the signal intensity, the associated standard deviations and the confidence level are shown in form of bar charts in Fig. 1e-l.
The score plots of the PCA showed a clear separation between the aerobic and
anaerobic growth conditions (Fig. 1a,1c) with many associated metabolites (Fig. 1b,1d). In general, the data suggest a massive change in the volatile metabolome
depending on oxygen availability during biofilm growth. Moreover, many of these
metabolites were significantly different by parametric t-test
(p values
These results support the hypothesis that the choice of aerobica vs. anaerobic cultivation conditions has a significant influence on the volatile metabolome of P. aeruginosa.
Because of this influence, in vitro studies of the extracellular volatile metabolome in the context of a bacterial infection in a human disease must adapt the cultivation condition to the disease. Thus, for the in vitro investigation of the metabolome of P. aeruginosa in the context of a respiratory infection, a CF disease respectively, a microaerophilic or anaerobic cultivation must be chosen, so that from the in vitro generated results to the real conditions in the lungs of a CF patient can be concluded.
In addition to the cultivation atmosphere, the phenotype of the bacteria may have a significant effect on the metabolome. In cystic fibrosis, the mucoid phenotype is dominant in chronic infections, whereas in initial infections, especially in younger CF patients, non-mucoid strains in the lungs are dominant [3]. A statistical and comparative study of the non-mucoidstrain P. aeruginosa PAO1 (acute infection isolate) and mucoid strain P. aeruginosa FRD1 (chronic infection isolate) was performed to get more information whether the phenotype has an influence on the extracellular volatile metabolome of P. aeruginosa. Cultivation in the in vitro biofilm model was performed under anaerobic conditions using the complex LB medium supplemented with potassium nitrate as described by Koehler et al. [25]. Eight biological replicates were investigated per bacterial strain.
The comparison of the two phenotypes using a PCA is shown in Fig. 2a. A distinction between the two phenotypes is not possible by means of two main components, since the scatter of results in the scores plot is large (0.2–20, blue dots) for the mucoid strain P. aeruginosa FRD1. In contrast, the scatter of results for the strain P. aeruginosa PAO1 is small (2–6, red dots), but the results for the mucoid strain are partly within the range for the non-mucoid strain P. aeruginosa PAO1. Furthermore, the substance classes are not grouped according to the two phenotypes (Fig. 2b). Therefore, differentiation of the two phenotypes cannot be done at the substance class level. However, the influence of the phenotype, for example the formation of alginate (mucoid phenotype) on the molecular level cannot be excluded. For this purpose, the peak intensities of the identified metabolites were compared with each other and their significance was determined using the t-test. Using the example of six metabolites, the difference in mean peak intensities is shown in Fig. 2, with the significance of the difference in peak intensity varying for the selected metabolites.
 Fig. 2.
Comparison of the two strains P. aeruginosa FRD1 (blue)
and PAO1 (red) with mucoid and non-mucoid phenotype, respectively, by PCA,
statistical evaluation by t-test. Cultivation in the in vitro
biofilm model was performed under anaerobic conditions using LB medium
supplemented with potassium nitrate for 48 h at 37
The peak intensities of certain metabolites were significantly increased in the mucoid phenotype compared to the non-mucoid phenotype (see Fig. 2a–e). However, the opposite trend could be observed for certain metabolites (see Fig. 2f–h). For example, a 4-fold higher peak intensity was observed for benzaldehyde in mucoid strains. The example of the metabolite dimethyl disulphide shows that a significant reduction of peak intensity can also occur in the mucoid phenotype compared to the non-mucoid phenotype. The peak intensity of the mucoid phenotype is reduced by a factor of 13. In total, a significant difference in peak intensity was found for 28 metabolites. The statistical comparison of the mVOCs between the two phenotypes revealed three metabolites whose difference in peak intensity was a confidence level of p = 0.001. Eleven metabolites had a confidence level of p = 0.01 and fourteen metabolites had a confidence level of p = 0.05. A list of these metabolites is shown in Supplementary Table 4. Previously, secondary electrospray ionization-mass spectrometry (SESI-MS) was applied to produce fingerprints of the P. aeruginosa strains PAO1 and FRD1 directly from the breath of infected mice [37]. It was demonstrated that SESI-MS was capable of differentiating infected versus uninfected mice as well as infections caused by strain PAO1 versus FRD1. In addition, comparison of the in vivo volatiles with in vitro volatiles from liquid laboratory cultures showed that only 25–34% of peaks were shared between the in vivo and in vitro fingerprints [37].
In summary, the investigation of the influence of the mucoid phenotype of the bacterium P. aeruginosa on its metabolism showed that at the level of substance classes as well as two main components, no distinction was possible in this study. However, differences could be detected at the molecular level. It was shown that, in addition to the cultivation conditions (aerobic and anaerobic), the mucoid phenotype of the bacterial strain must be taken into account in metabolome studies.
In addition to the influencing variables already studied and discussed, the culture medium could have an impact on the extracellular volatile metabolome of P. aeruginosa. In most metabolome studies published on P. aeruginosa the full medium LB-Lennox and bacteria selective growth media are used [14]. Such selective culture media contain only the substances that the respective bacterium needs to grow. Additionally, these culture media contain chemicals that suppress the cultivation of other bacteria. The Pseudomonas isolation (PIAN) agar is such a P. aeruginosa specific medium. In order to investigate the influence of the culture medium on the metabolome of P. aeruginosa in the context of CF disease two clinical strains P. aeruginosa PAO1 and P. aeruginosa FRD1 were cultivated under anaerobic conditions on both culture media (LBN and PIAN medium). Potassium nitrate was added to both culture media to ensure anaerobic cultivation. Five biological replicates of the strain P. aeruginosa FRD1 and three biological replicates of the strain P. aeruginosa PAO1 were grown on PIAN medium. The detected extracellular volatile metabolites were compared with those of eight biological replicates of the two strains cultivated on LBN medium. To exclude the influence of the phenotype described in chapter 3.1.2, the comparison of the extracellular volatile metabolites was performed exclusively between cultures with the same phenotype, e.g., FRD1 on LBN vs. FRD1 on PIAN.
The scores and loading plots obtained by performing a PCA are presented in Fig. 3a–d. From these results a significant differentiation of the cultivation on both culture media is possible using two main components. To differentiate between the two culture media, only the first principal component is necessary, which explains 84% of the variance for strain P. aeruginosa PAO1 and 60% for strain P. aeruginosa FRD1. The second principal component only describes the scatter within the group. For PAO1 this principal component describes 91% variance and for FRD1 79%. Based on the high values, the qualitative observation of the differentiation between the two culture media by means of PCA can be confirmed quantitatively. Considering the corresponding loadings plots, the detected extracellular volatile metabolites can be assigned to the nutrient medium.
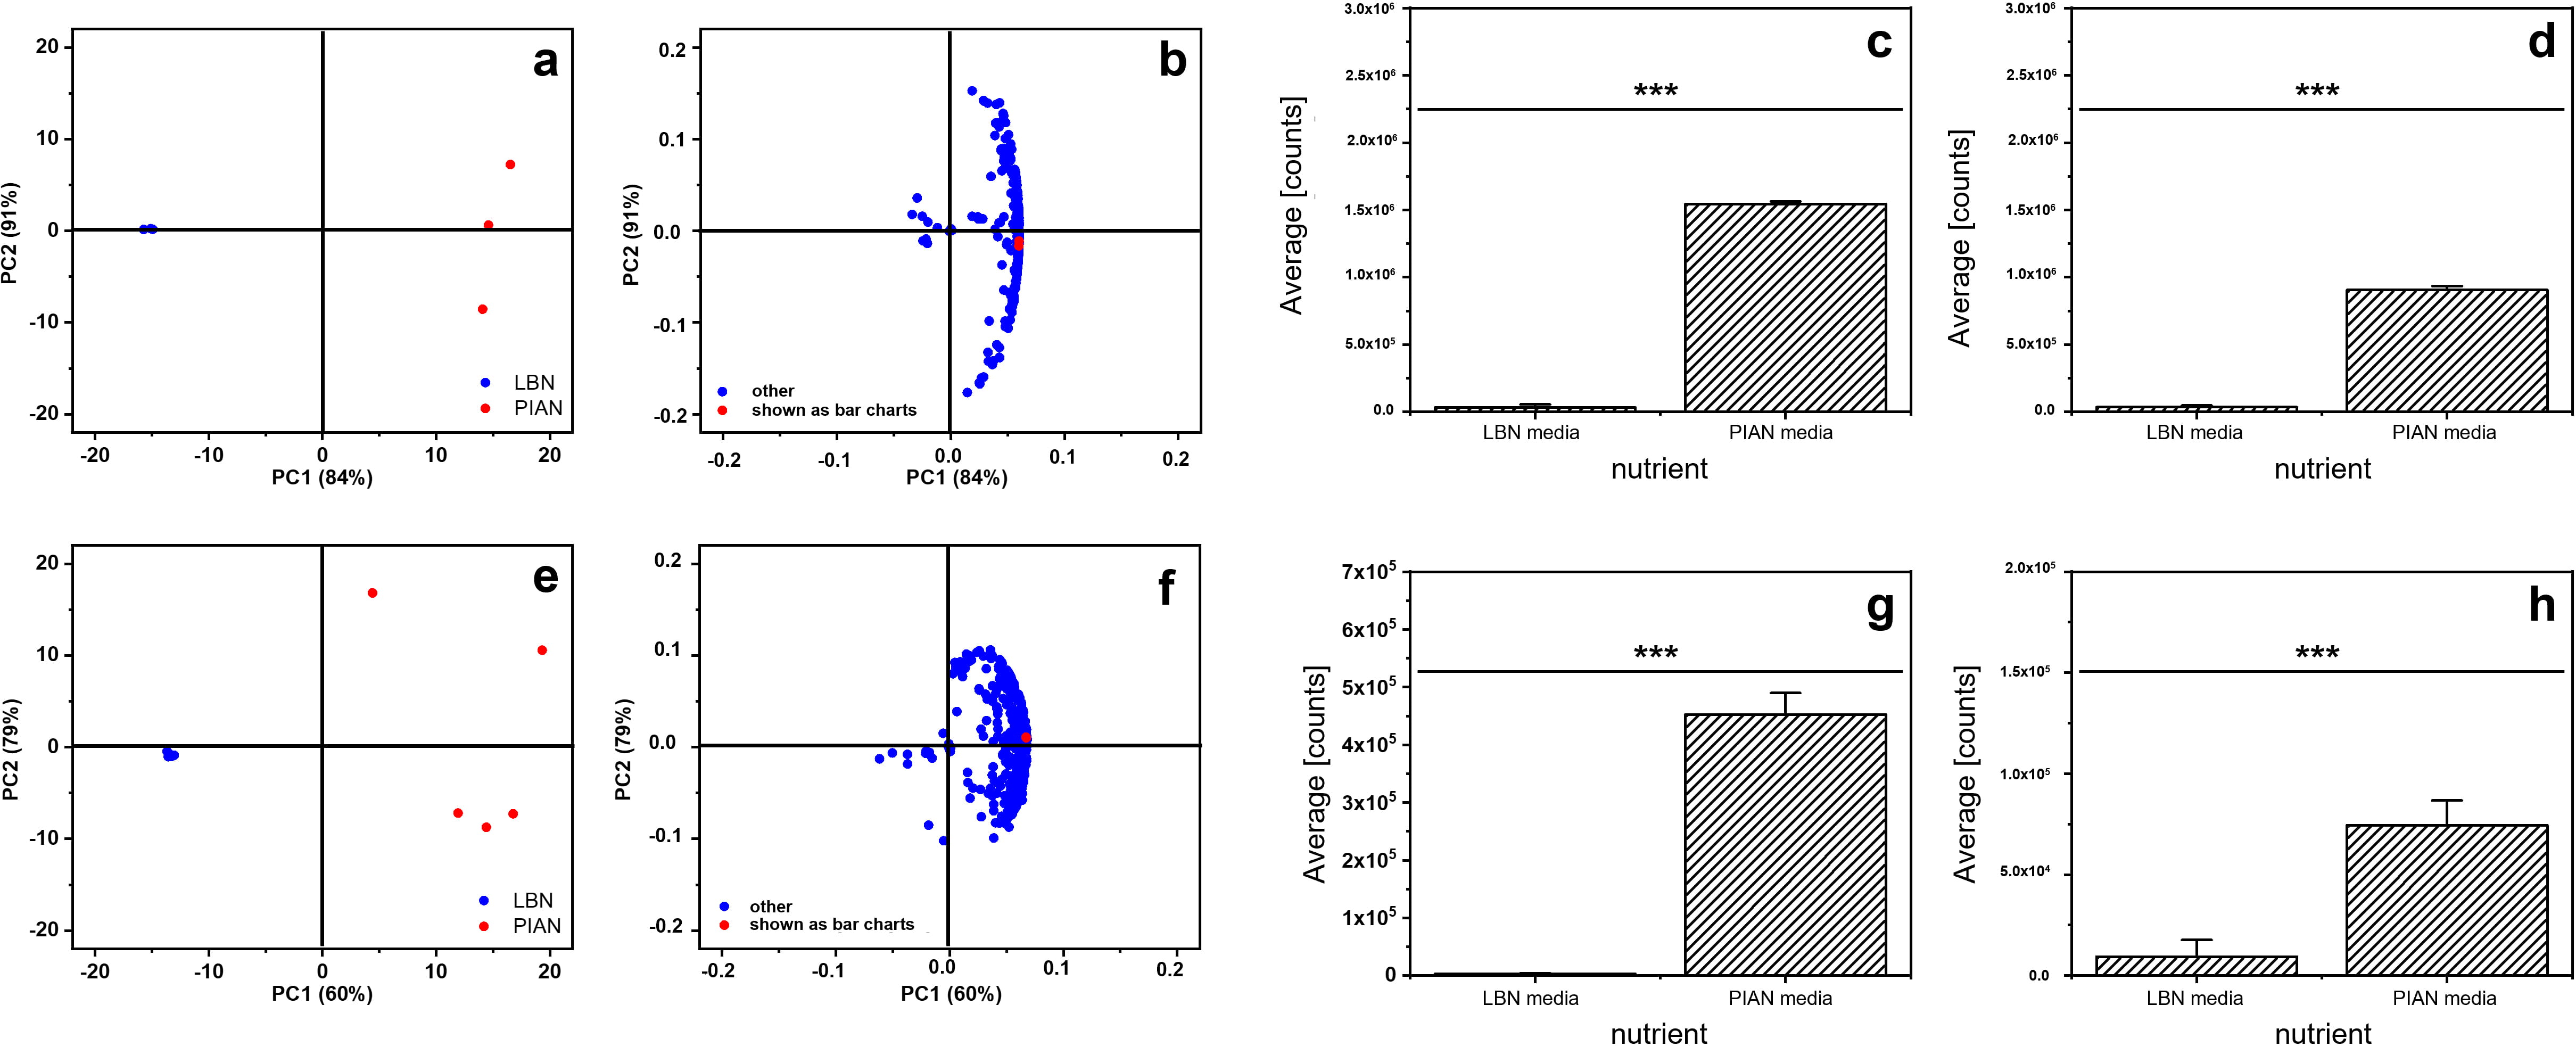 Fig. 3.
Comparison of two different culture media (LBN: blue; PIAN: red)
in a cultivation of the two strains P. aeruginosa PAO1 (a, b) (n = 5) as
well as FRD1 (e, f) (n = 3) under anaerobic conditions in an in vitro
biofilm model by PCA. Cultivation in the in vitro biofilm model was
carried out under anaerobic conditions in LB medium supplemented with potassium
nitrate and in the Pseudomonas isolation agar supplemented with potassium
nitrate. The bacteria were cultivated for 48 hours at 37
Furthermore, the variance between the biological replicates in the LBN medium for the cultivation of P. aeruginosa FRD1 (see Fig. 3e) as well as for P. aeruginosa PAO1 (see Fig. 3a) is small. A higher variance for both bacterial strains as well as a significantly larger number of extracellular volatile metabolites is achieved by cultivation on PIAN medium. A t-test was used to investigate the differentiation of both cultivation media at the molecular level. Fig. 3c–f show two substances for each of the two bacterial strains, whose mean peak intensity is significantly higher when cultivated on PIAN medium (confidence level: p = 0.001).
For the detection of the metabolites 2-nonanone and 1-octanol, a higher signal intensity was observed when using PIAN agar (Cultivation of P. aeruginosa FRD1, with a statistical significance of 99.9%) (Fig. 3g,3h). Similarly, higher signal intensities were detected for 1-hexadecanol and pentadecane (cultivation of P. aeruginosa PAO1 on PIAN agar) with the same statistical significance (Fig. 3c, 3d). Overall, significance analysis of culturing P. aeruginosa FRD1 on LBN and PIAN agar revealed 102 metabolites with a significant difference in signal intensity. 21 metabolites could be assigned to the significance level p = 0.001, 33 metabolites to the significance level p = 0.01, and 48 metabolites to the significance level p = 0.05.
The analysis for the bacterial strain P. aeruginosa PAO1 revealed 123 metabolites with a significant difference in signal intensity. 25 metabolites could be assigned to the significance level p = 0.001, 54 metabolites to the significance level p = 0.01 and 44 metabolites to the significance level p = 0.05. An overview of the determined metabolites of the two investigated bacterial strains is given in the supplement (P. aeruginosa FRD1: Supplementary Table 5; P. aeruginosa PAO1: Supplementary Table 6).
First, this analysis shows that the culture medium has a significant influence on the extracellular volatile metabolome, due to the high number of metabolites with significantly different signal intensities. On the other hand, due to the similar number of metabolites with significant difference in signal intensity, it was shown that the influence of the culture medium is independent of the mucoid phenotype of the bacterium. Analogous to the results of the investigation of the influence of the mucoid phenotype, a difference can be detected on the molecular level.
The extracellular volatile metabolome of the two clinical strains P. aeruginosa FRD1 as well as PAO1 and the reference strain P. aeruginosa ATTC 10145 was investigated. The in vitro metabolome investigations of the bacterial strains were performed under CF-like conditions using the solid ASM described above. The mVOCs of three biological replicates of each bacterial strain were identified after deconvolution and feature analysis by the GC-EI-MS specific metabolomics database MoNA. Following data processing and peak identification, the statistical evaluation of the metabolites was carried out performing a PCA following the identification of specific metabolites by evaluating the resulting score and loading plots (see Fig. 4).
 Fig. 4.
Comparison of the available P. aeruginosa strains (Fig. A: blue = ATCC 10145; red = PAO1; black = FRD1) by means of their extracellular volatile metabolites. The three bacterial strains were cultivated under anaerobic conditions and on ASMN agar using the in vitro biofilm model. Comparison was performed using unsupervised PCA. Fig. 4A shows the scores and the loadings plot. In the loadings plot, the metabolites are labeled, which are shown as bar graphs in Fig. 4B (a–l). a = benzophenone, b = tetradecane, c = toluene, d = 2-ethylhexanal, e = 3-methoxypropylamine, f = trans-2-dodecenyl acetate, g = 1-hexadecanol, h = pentadecane, i = methyl benzoate, j = 2-octanone, k = isoprene, l = 1-decanol. * = 0.05; ** = 0.01; *** = 0.001.
Differentiation between the investigated strains of P. aeruginosa is possible by the first two principal components, as can be seen from the scores plot in Fig. 4A. Cumulatively, these two principal components explain a variance of 98 %. Furthermore, the first principal component is suitable to explain the difference between the strains P. aeruginosa ATCC 10145 and PAO1 and the strain P. aeruginosa FRD1. For explaining the difference between P. aeruginosa ATCC 10145 and P. aeruginosa PAO1 the second principal component can be applied. The variance between the replicates of one strain, except for the replicates of P. aeruginosa PAO1, is low compared to cultivation on the other culture media used (see Fig. 4a). In the replicates of the strain P. aeruginosa PAO1, only one outlier can be detected. This outlier could be caused on the one hand by irregularities in the analysis or on the other hand by deviation in the sample preparation. The biological variance must also be considered in the discussion, but since only technical replicates were analysed, this can be assumed to be low. Despite this outlier, a clear differentiation between the bacterial strains with the first two principal components as well as an identification of bacterial strain-selective metabolites using the loadings plot (see Fig. 4A,4b) is possible. Based on the scores and loadings plot, it can be assumed that the difference between the bacterial strains P. aeruginosa ATCC 10145 and FRD1 as well as between P. aeruginosa PAO1 and FRD1 is significantly larger than between P. aeruginosa ATCC 10145 and PAO1. This can be explained by the differentiation of the mentioned strains already in the first principal component as well as the number of identified features, shown in the loadings plot (see Fig. 4A,4b). An evaluation of this observation can be carried out with the help of a significance analysis. For this purpose, the variance of the peak intensity of the identified features between all strains was tested using a t-test (two-sided distribution, heteroskedastic). By means of the significance analysis, a total of 70 metabolites could be identified that show a significant difference (at least 95%) in peak intensities between the strains P. aeruginosa FRD1 and ATCC 10145 (see Supplementary Table 7). Analogous to the qualitative observation from the scores and loadings plot, the number of metabolites with a significant difference in peak intensity decreases significantly when comparing the bacterial strains P. aeruginosa FRD1 and PAO1 (36 metabolites) and P. aeruginosa ATCC 10145 and PAO1 (28 metabolites). In addition to the decrease in total metabolites, the proportion of metabolites with the greatest significance (p = 0.001; 99.9%) in the total number also decreases. Both this quantitative and qualitative comparison using scores and loadings plot reveals that P. aeruginosa ATCC 10145 and PAO1 are more similar to each other in their extracellular volatile metabolome than P. aeruginosa FRD1. This can be attributed to the different phenotype. Furthermore, it can be observed that the difference of P. aeruginosa FRD1 to P. aeruginosa ATCC 10145 is higher than to P. aeruginosa PAO1. This could be explained by different origins of the strains (P. aeruginosa ATCC 10145 as a neotype strain of P. aeruginosa and P. aeruginosa PAO1 as originally a clinical isolate). P. aeruginosa PAO1 was originally isolated from a burn wound of a patient and was thus exposed to environmental influences. These environmental influences may have led to mutations that made the P. aeruginosa PAO1 strain resistant to such influences, resulting in the presence of different genes despite the same mucoid phenotype, thereby diverging the phenotypes between the two bacterial strains. Although Kavanagh, who first used P. aeruginosa ATCC 10145 in 1947 [38], did not provide any information on the date of origin or the origin of the bacterial strain [38]. Due to this lack of information regarding the original isolation of P. aeruginosa ATCC 10145, the explanation is based exclusively on theoretical considerations.
On the molecular level, for example, some molecules of the substance class of methyl ketones (e.g., 2-octanone, 2-hexanone, etc.) could be identified (see Supplementary Table 7). Forney et al. [39, 40] have described the formation of methyl ketones from n-alkanes in bacteria in two publications. Furthermore, Thijsse et al. [41] found that P. aeruginosa strains accumulate methyl ketones, such as 2-hexanone. This was supported by the research results of Robinson et al. [42]. 2-Hexanone and other methyl ketones have already been identified as volatile metabolites in several studies of the metabolome of P. aeruginosa [14, 18, 43, 44, 45]. Methyl ketones, such as 2-nonanone [17], have also been detected in CF sputum. However, as Bos et al. [14] report, methyl ketones can also be produced by other bacteria such as S. aureus. Since S. aureus is also a CF-relevant pathogen, the influence of other CF-relevant pathogens must also be taken into account when analysing the extracellular volatile metabolome of P. aeruginosa in the context of respiratory infections in CF disease.
The influence of all investigated parameters on the extracellular volatile metabolome were demonstrated by the presented results. The influence of oxygen availability and the culture medium is particularly significant. However, at the molecular level, which is important for diagnosis by breath analysis, an influence of the mucoid phenotype is also detectable. Therefore, cultivation of bacterial biofilms under microaerophilic, anaerobic conditions is necessary for robust in vitro metabolomic studies of bacterial lung infections in CF disease. In addition, it must be determined in advance which infection status is to be investigated so that the phenotype of the bacterium can be selected accordingly. The use of a culture medium that best simulates the (nutrient) conditions in the CF lung and mucus is advantageous. Such a culture medium is the artificial sputum medium (ASM).
The investigation of extracellular volatile metabolites of three different strains of the bacterium P. aeruginosa have shown that when cultivating the bacterial strains under CF-like conditions, metabolites can be identified whose intensities are significantly increased or decreased compared to the other strains. For example, the following metabolites for the anaerobic cultivation of the mucoid phenotype on artificial sputum medium using the in vitro biofilm model have been detected: benzophenone, tetradecane, toluene, 2-ethylhexanal, 3-methoxypropylamine, trans-2-dodecenyl acetate, 1-hexadecanol, pentadecane, methyl benzoate, 2-octanone, isoprene, 1-decanol.
A differentiation of the bacterial strains by the extracellular volatile metabolome could be possible by two principal components of a PCA. Of great importance in CF disease is the bacterial strain P. aeruginosa FRD1 due to its mucoid phenotype. Mucoid bacterial strains of P. aeruginosa are isolated significantly more often in chronic lung infections, and resistance to antibiotics is significantly increased in such bacteria. To eradicate mucoid bacterial strains, such as P. aeruginosa FRD1, early identification of the bacterial strain is necessary. It is possible that the extracellular volatile metabolites identified in this study can be used for such early identification. With regard to CF, it is limiting that only monocultures and CF-like conditions were investigated in this study. A validation of the determined metabolites can be carried out, e.g., by analysing mVOCs of CF-typical bacteria as mono- and co-cultures under CF-like conditions. In this way, non-P. aeruginosa selective metabolites as well as deviations in the behaviour of the peak intensities could be determined.
With the presented method volatile metabolites of P. aeruginosa as well as different bacteria could be determined as biomarkers. These biomarkers may be detected by a non-invasive “at-bedside” breath target analysis method to detect severe lung infections with P. aeruginosa of CF patients at an early stage.
TK, JW, UT and OJS conceived and designed research study. TK and ML conducted experiments. TK analyzed the data. SWM provided help and advice on performed statistical evaluation. TK wrote the manuscript. All authors contributed to editorial changes in the manuscript. All authors read and approved the final manuscript.
Not applicable.
Not applicable.
This research was funded by German Research Foundation, GZ SCHM 1699/25-1
The authors declare no conflict of interest.