
†These authors contributed equally.
Academic Editor: Rivka Ofir
Background: This study aimed to investigate the mechanisms of acute rejection for vascularized composite allotransplantation (VCA) using microRNAs (miRNAs) differential expression in a VCA animal model. Methods: Brown Norway rats were used as transplant donors and Lewis rats as VCA receptors. The changes were divided into different stages before and after transplantation in Lewis rats, and all appearance changes were recorded. Also, histological evaluations were performed on all recipients, and the expression of microRNAs was analyzed when acute immune rejection occurred. Then, we used GO and KEGG Pathway enrichment analyses to predict miRNA targets. Finally, differentially expressed miRNAs were detected by RT-qPCR. Results: Compared to pre-operation, 22 miRNAs were differentially expressed after operations. Among them, nine were upregulated, and 13 were downregulated in skin tissues. The RT-qPCR results revealed that rno-miR-340-5p and rno-miR-21-5p were significantly upregulated and enriched in the PI3K-Akt signaling pathway. Moreover, rno-miR-145-5p and rno-miR-195-5p were significantly downregulated, and most of their target genes were enriched in the Hippo signaling pathway. The histological evaluations showed that, after VCA, the skin tissue presented severe acute rejection. Conclusions: The miRNAs rno-miR-340-5p, rno-miR-21-5p, rno-miR-145-5p, and rno-miR-195-5p were significantly regulated during VCA acute rejection, when the four miRNAs analyses were done on skin biopsies. These miRNAs might be potential biomarkers for objective, early, and minimally invasive rejection diagnosis.
For some end-stage patients, organ transplantation can be a life-saving choice. In recent decades, the use of immunosuppressive drugs significantly improved the overall survival rate of solid organ transplant recipients [1, 2]. However, compared with other organ transplantation types, vascularized composite allotransplantation (VCA) has a higher incidence of acute rejection [3]. Moreover, few studies are available on why the VCA acute rejection process occurs and how it is regulated.
MicroRNAs (miRNAs) are single-stranded noncoding RNAs with 19–25 nucleotides [4]. They are stably present in various tissues and blood. Also, miRNAs can bind to the 3’ or 5’ untranslated region of a target messenger RNA (mRNA), thereby inhibiting its function or leading to its degradation, finally regulating the occurrence and development of many diseases [5]. Recently, many miRNAs have been related to the activation and regulation of the innate immune system and inflammatory responses [6, 7]. Additionally, some reports have shown that the expression of miRNAs in plasma changes during acute rejection after organ transplantation, including heart or kidney [8, 9]. Other studies have reported that plasma miRNA-146a and miRNA-155 can be potential acute rejection biomarkers after VCA [10]. Also, this research team continued to select several differentially expressed miRNAs in plasma for histological diagnosis [11].
However, regarding VCA acute rejection, there is no study with its whole transcriptome sequence and screening differentially expressed miRNAs. Therefore, in the present study, we aimed to evaluate miRNA changes during acute rejection in VCA model rats.
The VCA model was constructed using a rodent hindlimb allograft model. The Shanghai Sippr-BK Laboratory Animal Co. Ltd. (Shanghai, China) provided male Lewis and male Brown Norwegian (BN) rats (200–250 g) for this study. Two different receptors received one hindlimb from the same donor. The ethics committee of the Ninth People’s Hospital, affiliated with the Shanghai Jiao Tong University School of Medicine, approved all animal procedures. This work followed the guidelines of the Laboratory Animal Manual of the NIH Guideline for the Care and Use of Laboratory Animals.
Before operations, rats were anesthetized by continuous inhalation of isoflurane, and operations were performed as previously described [12]. Briefly, the two hind limbs of donor rats were dissected for the femoral vessels and related nerves, then amputated in the middle of the thigh. Before amputation, the limbs were perfused with cold heparinized Ringer’s lactate solution, then stored in the same solution until transplantation. Each hind limb harvested was transplanted in situ to isolated recipient rats. The femur was fixed with an 18G intramedullary needle. and the dorsal muscle and skin were sutured with a 3-0 silk thread. Then the femoral artery, vein, and sciatic nerves were anastomosed with a 12-0 nylon thread under an operating microscope. After confirming that the anastomotic vessels were unobstructed, the ventral muscles and skin were sutured with a 3-0 silk thread (Fig. 1). Motor and sensory functions were not evaluated in the current study.
 Fig. 1.
Surgical procedures. (A) Prepare the donor site for amputation. (B) Amputation. (C) Prepare the receptor. (D) Perform vascular anastomosis. (E, F) Close muscles and skin.
Male BN rats were used as allograft donors and transplantations were performed on male Lewis rats. The preoperative skin tissue of rats was used as the control. The postoperative skin tissue comprehended the experimental group and was used to analyze the primary mechanisms of acute immune rejection.
Pre- and post-operation changes and special conditions observed in rats were recorded daily. Rats were sacrificed after the 7th day. Sterilized scissors were used to collect the skin of each experimental rat. Skin tissue pieces were collected from each rats. Removed skin tissue specimens were divided into two parts and stored. Half of the skin specimen was cut into pieces and frozen in liquid nitrogen for further use. The other half was placed in an EP tube and stored on dry ice for molecular detection. Each skin sample was marked with a corresponding label.
First, fixed skin tissue samples were embedded in paraffin, sectioned (4–5
The Hiseq Single-End sequencing was used in the present study. First splices were removed and cuts were performed according to the sequence quality. The original sequence was searched using a 5 base length as the window. When the average sequencing base quality in the window was lower than 20, the front end of the window was truncated and discarded. Filtered sequences were further used. Then, the number of clean reads (total reads) with a sequence length of 18–36 nt was counted. Identical sequences in each sample were duplicated and the sequence abundance was assessed. These sequences were called unique reads and were used for subsequent analyses.
The miRNA levels were evaluated using sequencing counts and normalized as counts per million of total aligned reads (CPM). Differentially expressed miRNAs were screened based on count values. Hierarchical clustering and Volcano plots were generated using R or Perl environments for statistical computing and graphics.
MiRNAs can bind to target sites mainly through complementary pairing. To analyze
miRNA binding in animals, we predicted the target genes of differentially
expressed miRNAs using miRanda and the 3’ UTR sequence of mRNAs of the species as
the target sequence. Top GO was used for GO enrichment analysis. During this
analysis, the list of and the number of miRNA target genes of each term were
calculated using differential miRNA target genes annotated by GO term. Then, the
p-value was calculated by the hypergeometric distribution method (the
standard for significant enrichment as p-value
First, we assessed the RNA quality, and then total RNA was reverse transcribed
into cDNAs (PrimeScript TM 1st stand cDNA Synthesis Kit). Briefly, the reverse
transcription reaction system 1 was added to the test tube in ice. Then, 10
Data are presented as means
The cumulative number of recipients with visual skin changes is shown in Fig. 2. The allogeneic hind limb transplantation led to increasingly worsening edema and swelling within a few days. Erythema and blisters appeared on the 7th day after transplantation. On the 10th day, large erythema and blister areas appeared, and skin keratolysis was observed. On the 14th day, all transplanted hind limbs gradually became blackened and necrotized upward from the fingertip.
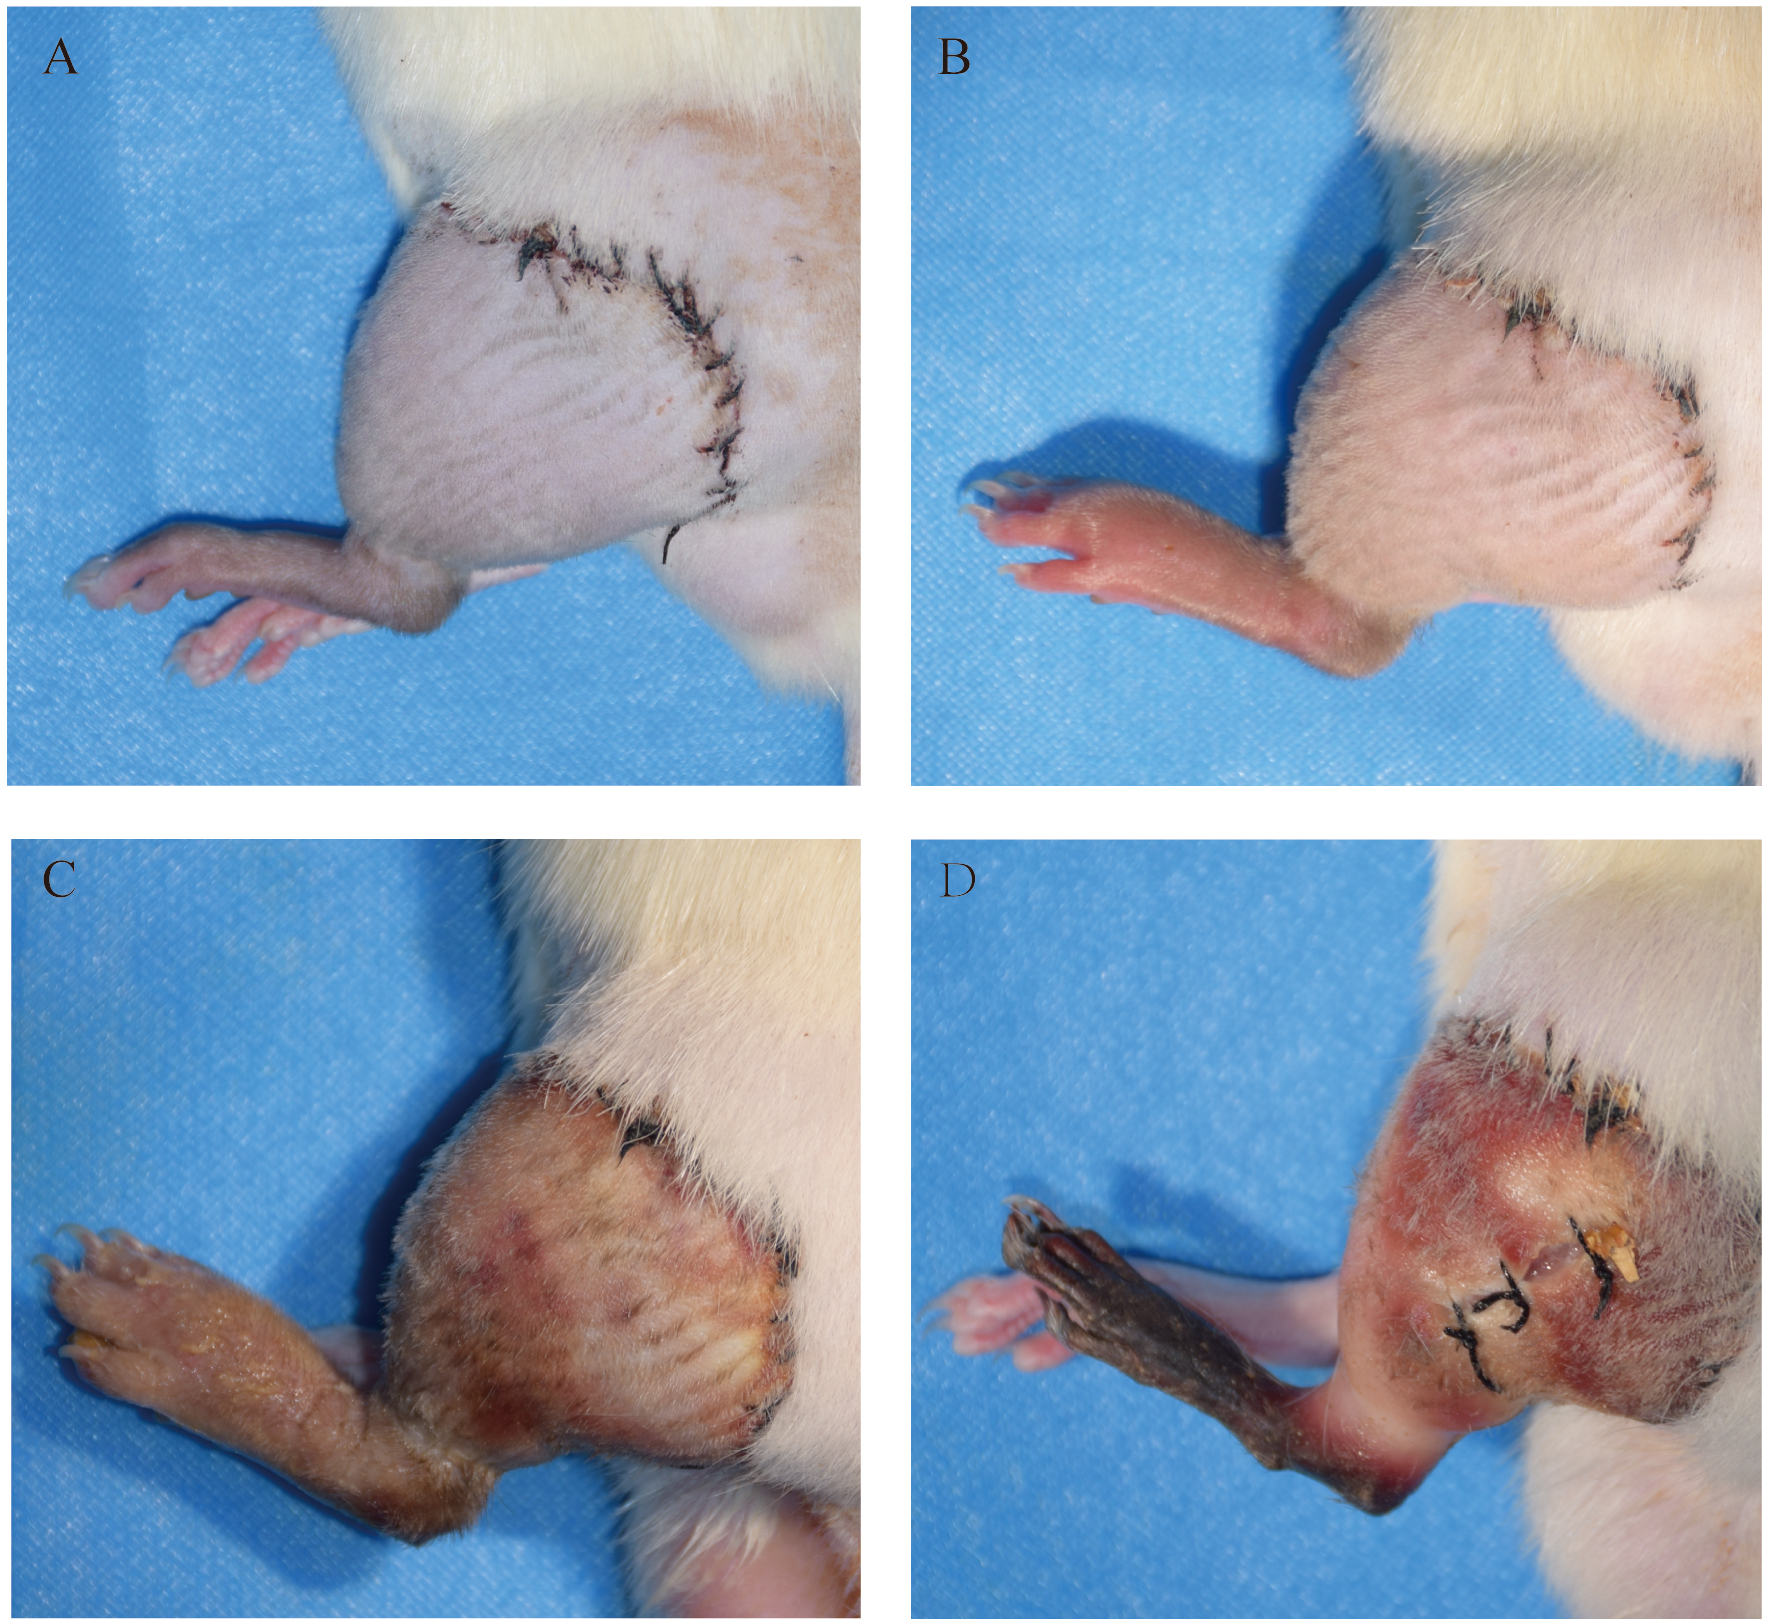 Fig. 2.
Allograft images at post-operative days 3 (A), day 7 (B), day 10 (C) and day 14 (D).
On the 7th day, early epidermis changes, necrosis, keratinization, epidermal thickening, lymphocyte infiltration, and basal cell vacuolation were observed in the upper dermis of post-transplant samples. Therefore, Grade I rejection occurred on the 7th day after transplantation. On the 10th day, the HE staining showed mixed slight cell infiltration, increased basal cell vacuolation, and that the epidermis fell off. On the 14th day, the skin edema was severe, and mixed cell infiltration and cell necrosis reached Grade III rejection (Fig. 3 and Table 1). The grading was based on the classification system of Büttemeyer et al. [13].
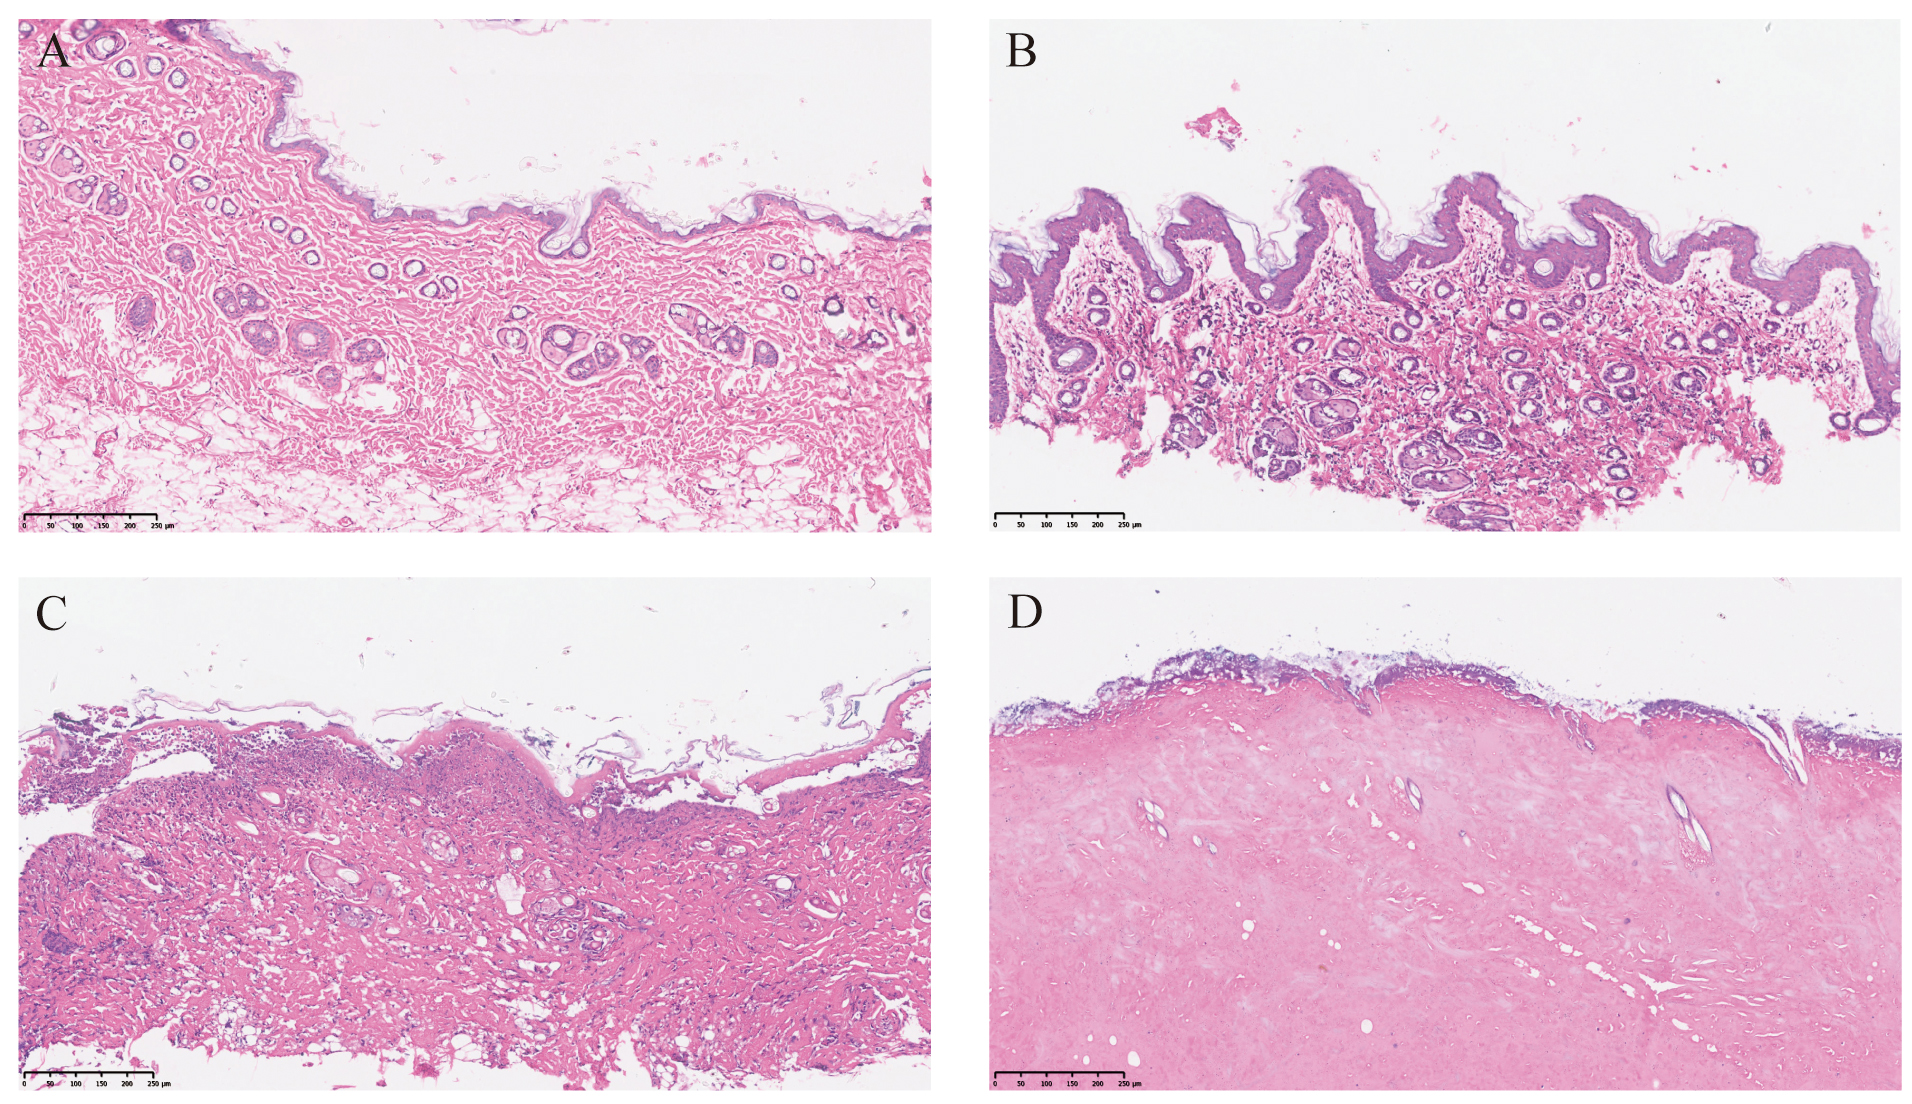 Fig. 3.
Hematoxylin and eosin staining of skin samples. Allograft skin
tissues at days 0 (A), day 7 (B), day 10 (C) and day 14 (D). Bar; 250
| Day 3 | Day 7 | Day 10 | Day 14 | |
| Grade 0 | 1 | |||
| Grade I | 2 | 2 | ||
| Grade II | 1 | 2 | ||
| Grade III | 1 | 3 |
The miRNA-seq was used to identify miRNA expression levels in control and experimental groups. Precise sample extraction, detection, and quality control processes were performed to control the sample quality through all steps. Then, the miRNA density distribution was used to investigate their expression pattern in the sample. Overall, most miRNAs were averaged expressed, and low and high miRNAs expressions accounted for a small part of the total. The miRNA expression characteristics in each sample are presented in Fig. 4A.
 Fig. 4.
Screening differentially expressed miRNA. (A) The horizontal line in the middle of the box is the median. The upper and lower edges of the box are 25% and 75% respectively, and the upper and lower limits are 10% and 90% respectively. The external shape is kernel density estimation. (B) Differential expression miRNA clustering. Horizontal represents miRNA, and each column is a sample. Red represents high expression miRNA and green represents low expression miRNA. (C, D) Trend analysis. The gray line in the figure shows the expression pattern of genes in each cluster, and the blue line represents the average expression of all genes in the cluster in the sample. (E) Volcano diagram of differentially expressed genes. The abscissa is –log10 (p-value) and the ordinate is –log10 (p-value). The two vertical dashed lines in the figure are twice the expression difference threshold; The horizontal dotted line is p-value = 0.05 threshold. The red dot indicates the up-regulated genes, the blue dot indicates the down-regulated genes, and the gray dot indicates the nonsignificant differentially expressed genes.
We used the “heatmap” R package for bidirectional cluster analysis of all miRNAs and samples. Clustering was performed according to the expression level of the same miRNA in different samples and the expression pattern of different miRNAs in the same sample. The Euclidean method was used to calculate the distance, and the hierarchical clustering longest distance method (complete linkage) was used for clustering (Fig. 4B).
The hierarchical clustering divided differential genes into various expression patterns. These genes were divided into different clusters (the gene expression trend in the same cluster is similar) to obtain gene clustering results. The clustering of upregulated and downregulated miRNAs is shown in Fig. 4C,D, respectively. Moreover, the Volcano plots provided a quick visual identification of the miRNAs displaying large and statistically significant magnitude changes (Fig. 4E). The tRF & tiRNA selection criteria included a higher FC, lower q-value, and higher CMP. After summarizing the original data, 22 differentially expressed miRNAs were selected (9 significantly upregulated and 13 significantly downregulated) (Table 2).
| ID | BaseMean-pre | BaseMean-post | log2FoldChange | p-value | Regulation |
| rno-miR-142-5p | 607.7350535 | 20846.13996 | 5.100193949 | 4.04073E-06 | Up |
| rno-miR-146a-5p | 4257.447789 | 22377.83468 | 2.394009703 | 0.014551208 | Up |
| rno-miR-150-5p | 685.9368241 | 3050.408248 | 2.152854724 | 0.013889396 | Up |
| rno-miR-16-5p | 2315.252696 | 12261.92583 | 2.404944014 | 0.029899796 | Up |
| rno-miR-21-5p | 134232.8018 | 3857194.518 | 4.844742739 | 9.68976E-06 | Up |
| rno-miR-3068-3p | 190.345222 | 851.6295895 | 2.16160772 | 0.01817161 | Up |
| rno-miR-340-5p | 731.1696561 | 4309.081037 | 2.559102126 | 0.013146273 | Up |
| rno-miR-425-5p | 299.5530556 | 2163.664109 | 2.852593096 | 0.010611057 | Up |
| rno-miR-451-5p | 808.8197018 | 8849.762591 | 3.451748708 | 0.001476382 | Up |
| rno-let-7b-5p | 11966.75571 | 3135.567548 | –1.932233575 | 0.034061084 | Down |
| rno-miR-100-5p | 22339.55589 | 3253.964067 | –2.779330281 | 0.001942897 | Down |
| rno-miR-125a-5p | 2917.416179 | 620.9017359 | –2.232254336 | 0.017164991 | Down |
| rno-miR-125b-2-3p | 992.4256572 | 221.1078847 | –2.166208561 | 0.02065144 | Down |
| rno-miR-125b-5p | 6963.711548 | 1541.142527 | –2.175856154 | 0.017261722 | Down |
| rno-miR-127-3p | 10921.39714 | 530.8676479 | –4.362661393 | 0.000227024 | Down |
| rno-miR-145-3p | 770.6204841 | 156.1568219 | –2.303024939 | 0.012479141 | Down |
| rno-miR-145-5p | 1823.94205 | 225.9399707 | –3.013048469 | 0.001068252 | Down |
| rno-miR-152-3p | 31358.13349 | 9363.154506 | –1.74377312 | 0.042792695 | Down |
| rno-miR-195-5p | 1330.00309 | 204.4803286 | –2.701395632 | 0.003009653 | Down |
| rno-miR-196a-5p | 1150.462541 | 218.8798351 | –2.394003057 | 0.008217532 | Down |
| rno-miR-196b-5p | 1149.408863 | 280.4985988 | –2.03482661 | 0.020797481 | Down |
| rno-miR-379-5p | 6844.839945 | 723.2646587 | –3.242421244 | 0.000549802 | Down |
Moreover, miRNAs can bind to target sites mainly through complementary pairing. To analyze miRNAs bindings in rats, we used miRanda to target the 3’ UTR sequence of their mRNAs. Target genes were predicted for differentially expressed miRNA sequences.
The GO enrichment analysis was performed using Top GO. During analysis, the list
and the number of miRNA target genes were calculated for each term using the
differential miRNA target genes annotated by GO. Then, the p-value was
calculated using the hypergeometric distribution method (the standard for
significant enrichment was p-value
 Fig. 5.
Bioinformatic prediction. Bubble Diagram of GO enrichment analysis in up-regulated (A) and down-regulated (B) miRNA. (C–H) Up-regulated gene ontology DAG enrichment map of biological process (C), molecular function (D) and cell component (E). Down-regulated gene ontology DAG enrichment map of biological process (F), molecular function (G) and cell component (H). Each node represents a GO term, and branches represent inclusion relations. The function range defined from top to bottom is becoming smaller and smaller. The box represents the GO term with the enrichment degree of TOP10, and the darker the color, the higher the enrichment degree. (I, J) Histogram of KEGG pathway enrichment results in up-regulated (I) and down-regulated (J) miRNA. The abscissa is the name, and the ordinate is –log10 (p-value) of each pathway.
According to the GO analysis results, the enrichment degree was measured by the rich factor, FDR value, and the number of miRNA target genes enriched in the GO term. The rich factor refers to the ratio. The larger the rich factor, the greater the enrichment degree. The general FDR value range was 0–1. The closer it is to zero, the more significant the enrichment is. The first 20 GO term entries with the lowest FDR values (most significantly enriched) were selected for display (Fig. 5A,B).
The enrichment analysis results provided direct acyclic diagrams of the three GO ontologies (CC, MF, and BP). In this diagram, the closer the root node, the more general the GO term. Besides, the GO term branching down is the term annotated at a more precise level. By default, the program sets the top 10 GO terms with the highest significance as squares, and the other terms as circles; The darker the color, the more significant the GO term. The colors from light to dark are: colorless, light yellow, dark yellow, and red (Fig. 5C–H). Additionally, the KEGG pathway enrichment analysis was carried out according to the target gene results. The top 20 pathways with the smallest p-value (most significantly enriched) were selected for display (Fig. 5I,J).
GO and KEGG analysis were performed on 9 up-regulated and 13 down-regulated miRNAs. The ontology covers three domains: Biological Process, Cellular Component, and Molecular Function. Up-regulated miRNAs were mainly concentrated in Cell Periphery and Plasma Membrane. Fig. 5B indicates that down-regulated miRNAs were mainly concentrated in Cell Periphery and play a role in Cellular Response to Stimulus, Multicellular Organismal Process and Signaling (Fig. 5B).
Pathway analysis is a functional analysis whereby genes are mapped to KEGG pathways. Up-regulated miRNAs were mainly enriched in PI3-AKT signaling pathway (Fig. 5I). The Hippo pathway had the highest enrichment score in down-regulated miRNA (Fig. 4D). Therefore, we focused on this path. Among them, Hippo pathway not only had the most enriched genes, but also had a high degree of enrichment; accordingly, it became the focus of our follow-up experiments.
Finally, we verified the expressions of rno-mir-340-5p, rno-mir-21-5p,
rno-mir-145-5p and rno-mir-195-5p by RT-qPCR (Fig. 6). The designed primer
sequences are shown in Table 3 and their relative expression levels were analyzed
by t-tests with a p
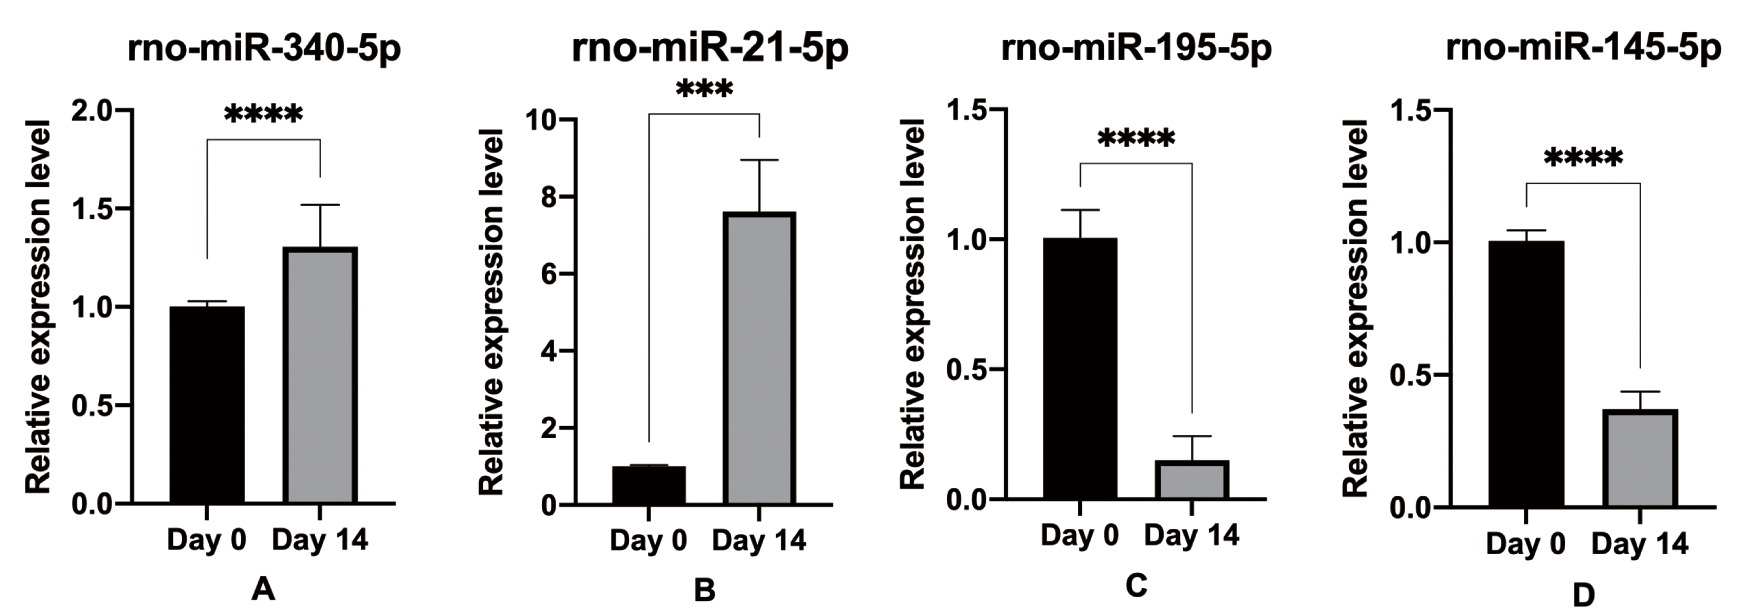 Fig. 6.
Validation of the four selected miRNAs using RT-qPCR
verification. Compared with the day 0th, (A,B) rno-miR-340-5p and rno-miR-21-5p
were up-regulated; (C,D) rno-miR-145-5p and rno-miR-195-5p were down-regulated.
The data were normalized using the mean
| Gene_ID | Primer | Sequences |
| rno-miR-340-5p | rno-miR-340-5p_s | CCTGTTGTCTCCAGCCACAAAAGAGCACAAT |
| ATTTCAGGAGACAACAGG AATCAG | ||
| rno-miR-340-5p_R | GCGCTTATAAAGCAATGAGA | |
| miRNA-F | CAGCCACAAAAGAGCACAA T | |
| rno-miR-21-5p | rno-miR-21-5p_s | CCTGTTGTCTCCAGCCACAAAAGAGCACAAT |
| ATTTCAGGAGACAACAGG TCAACA | ||
| rno-miR-21-5p_R | GCGCTAGCTTATCAGACTGA | |
| miRNA-F | CAGCCACAAAAGAGCACAA T | |
| rno-miR-145-5p | rno-miR-145-5p_s | CCTGTTGTCTCCAGCCACAAAAGAGCACAAT |
| ATTTCAGGAGACAACAGG AGGGAT | ||
| rno-miR-145-5p_R | GGTCCAGTTTTCCCAGGA | |
| miRNA-F | CAGCCACAAAAGAGCACAA T | |
| rno-miR-195-5p | rno-miR-195-5p_s | CCTGTTGTCTCCAGCCACAAAAGAGCACAAT |
| ATTTCAGGAGACAACAGG GCCAAT | ||
| rno-miR-195-5p_R | GCGCTAGCAGCACAGAAAT | |
| miRNA-F | CAGCCACAAAAGAGCACAA T | |
| U6 | RAT-miRNA-U6-F | CTCGCTTCGGCAGCACA |
| RAT-miRNA-U6-R | AACGCTTCACGAATTTGCGT |
Compared with other organ transplantations, VCA has a higher acute rejection rate, but most rats can achieve long-term survival through timely treatment [12]. However, VCA mild rejection can damage many normal tissues, leading to dysfunction and even graft loss. Therefore, early diagnosis and timely treatment are crucial for acute rejection. At present, rejection is mainly evaluated by subjective examination and blood indexes. These methods are not enough to directly reflect the current graft state and can not accurately predict the future development trend.
Moreover, miRNAs are non-coding RNAs that can be used as biomarkers of immune responses, in vivo index regulation, and tumor development [14, 15]. Also, it has been reported that there is a difference in the expression of plasma miRNAs in acute rejection induced by VCA in rats [16]. According to the published papers, the expression of miRNA in the plasma of the receptor was detected. After the animal model was successfully constructed, FK506 was injected intramuscularly every day. After a period of treatment, samples were taken to detect the expression of miRNA in plasma. What they studied was the immune rejection after treatment. This is different from our research direction. We did not treat the rats, and the research focused on the immune rejection before treatment. Secondly, the previous studies were all aimed at the detection of known miRNAs, and the kit was used for detection, with limited scope. The TaqMan miRNA reverse transcription kit has been used to detect the expression of known miRNAs in the skin and other tissues [11]. However, the miRNAs detected by these methods are very limited, and whether other miRNAs are important has not been fully clarified. We were aiming at whole genome sequencing, and the number of miRNAs detected were large, so more useful information could be obtained. So as to guide prevention and treatment Therefore, we used miRNA-seq to detect miRNAs during VCA acute immune rejection.
The expression of some miRNAs in VCA immune rejection has been previously summarized in a review [17]. The roles of rno-mir-142-5p and rno-mir-146a-5p have been confirmed, consistent with our current results. Besides these miRNAs, we also found that many new miRNAs are important during acute rejection, such as rno-miR-150-5p, rno-miR-16-5p, rno-miR-21-5p, rno-miR-3068-3p, rno-miR-340-5p, rno-miR-425-5p, rno-miR-451-5p, rno-let-7b-5p, rno-miR-100-5p, rno-miR-125a-5p, rno-miR-125b-2-3p, rno-miR-125b-5p, rno-miR-127-3p, rno-miR-145-3p, rno-miR-145-5p, rno-miR-152-3p, rno-miR-195-5p, rno-miR-196a-5p, rno-miR-196b-5p, and rno-miR-379-5p. We screened four miRNA according to their differential expression and predicted the number of target genes. The RT-qPCR results verified that rno-mir-340-5p and rno-mir-21-5p were upregulated, and rno-mir-145-5p and rno-mir-195-5p were downregulated. Previously, rno-mir-340-5p has been reported as significantly upregulated in the plasma of a mouse allogeneic transplantation model [18]. Besides, rno-mir-145-5p can help in the diagnose of renal transplantation rejection [19]. The results of our allograft rat models further confirmed their performance in animal models, which might lead to reliable biomarkers for human organ allotransplantation detection.
Furthermore, rno-mir-340-5p and rno-mir-21-5p presented many target genes enriched in the PI3K-Akt signaling pathway, which is closely related to corneal transplantation rejection. Additionally, rno-mir-340-5p plays a role in the progression of osteosarcoma through the PI3K Akt pathway [20]. However, the mechanisms of rno-mir-340-5p/PI3K-Akt have been rarely reported. Whether rno-mir-340-5p and its most abundant target gene regulate VCA acute immune rejection via the PI3K-Akt signaling pathway needs further exploration. Herein, we also found that rno-mir-145-5p and rno-mir-195-5p were significantly downregulated and enriched in the Hippo signaling pathway. However, little is known about the role of the Hippo signaling pathway in immune rejection. Loss of Hippo tumor suppressor activity and hyperactivation of Yap are commonly observed in cancers [21]. Tumor and liver-related Hippo’s research has been very in-depth. In the future, we can focus on its immunity mechanisms.
This study also has some limitations. First, we verified the expression of only four miRNAs. More miRNAs should be verified, and the combination of different miRNAs should be analyzed to improve the specificity and sensitivity to detect rejection status. Second, we only used rat miRNAs were used in this study. Although rats share many genes with humans, they are not the same. Hence, clinical specimens should be used to detect human miRNAs in the future to assist in clinical diagnosis and treatment.
The miRNAs rno-miR-340-5p, rno-miR-21-5p, rno-miR-145-5p, and rno-miR-195-5p were significantly regulated during VCA acute rejection, when the four miRNAs analyses were done on skin biopsies. These miRNAs are potential biomarkers for objective, early, and minimally invasive rejection diagnosis.
The data that support the findings of this study are available on request from the corresponding author.
YF and SW performed the research. YF and SW designed the research study. BS, LY and JC contributed essential reagents or tools. XL, YX and HL helped to analyze the data. YZ was responsible for some data visualization. YF wrote the article. SL and JZ revised the article. All authors read and approved the final manuscript.
No human studies were carried out by the authors for this article. All animal procedures were approved by the ethics committee of the Ninth People’s Hospital Affiliated with the Shanghai Jiao Tong University School of Medicine (SH9H-2020-A310-1).
Thank you to all members of the JZ’s, SL’s and LY’s teams for our special support.
This research was funded by a grant from National Science and Technology Major Projects of China, grant number 2018ZX10303502, Postdoctoral Science Foundation, grant number 2019T120347 and Natural Science Foundation of China, grant number 82002065.
The authors declare no conflict of interest.
Publisher’s Note: IMR Press stays neutral with regard to jurisdictional claims in published maps and institutional affiliations.