
Academic Editor: Yoh Dobashi
Background: Currently, individual clinical prognostic variables are
used sequentially with risk-stratification after TNM staging in clinical practice
for the prognostic assessment of patients with NSCLC, which is not effective for
estimating the collective impact of multiple individual variables on patient
outcomes. Here, we developed a clinical and PET/CT volumetric prognostic (CPVP)
index that integrates the prognostic power of multiple clinical variables and
metabolic tumor volume from baseline FDG-PET, for use immediately after
definitive therapy. Patients and methods: This retrospective cohort
study included 998 NSCLC patients diagnosed between 2004 and 2017, randomly
assigned to two cohorts for modeling the CPVP index using Cox regression models
examining overall survival (OS) and subsequent validation. Results: The
CPVP index generated from the model cohort included pretreatment variables
(whole-body metabolic tumor volume [MTVwb], clinical TNM stage, tumor histology,
performance status, age, race, gender, smoking history) and treatment type. A
clinical variable (CV) index without MTVwb and PET/CT volumetric prognostic (PVP)
index without clinical variables were also generated for comparison. In the
validation cohort, univariate Cox modeling showed a significant association of
the index with overall survival (OS; Hazard Ratio [HR] 3.14; 95% confidence interval [95% CI] = 2.71 to
3.65, p
Accurate prediction of survival in patients with non-small cell lung cancer (NSCLC) is essential for recommending initial therapy. Common pretreatment prognostic variables include tumor-node-metastasis (TNM) staging [1, 2, 3], whole-body metabolic tumor volume (MTVwb) [4, 5, 6, 7, 8, 9, 10, 11, 12, 13], pre-treatment Eastern Cooperative Oncology Group (ECOG) performance status (PS) [14, 15, 16, 17], histologic subtype [17, 18], age [17, 18, 19, 20], race [18], gender [17, 18] and smoking history [20]. A second opportunity for prognostic assessment of patients arises after completion of initial therapy for future patient management. At that time, the initial treatment type the patients received was found to be important prognostic variable [21]. Effective treatment targets on the actionable oncogenes such as EGFR and ALK has provided new improving survival significantly among patients harboring the corresponding driver mutation [22, 23, 24]. However, currently, individual clinical prognostic variables are used sequentially after TNM staging with risk-stratification in clinical practice, which is not effective for estimating the collective impact of multiple individual prognostic variables on survival after initial therapy.
We previously developed the PVP index by combining the prognostic value of three variables, whole-body metabolic tumor volume (MTVwb), initial clinical TNM stage and patient age, for NSCLC patient risk assessment at baseline prior to treatment [25, 26]. The PVP index provides a way to integrate the prognostic power of multiple prognostic variables. However, a prognostic index that integrates the prognostic power of multiple recognized baseline prognostic variables and an initial treatment type variable for prognostic assessment of NSCLC patients after initial therapy is not available in clinical practice. Such a prognostic index is clinically needed as it may influence patient follow-up planning and considerations for adjuvant therapy in some individuals. It may facilitate personalized discussions with patients and their families regarding expectations for the survival.
In this study, we developed a broadly integrated index, clinical and PET/CT volumetric prognostic (CPVP) index, for improved prognostic assessment after initial NSCLC treatment.
This study was approved by our university’s Institutional Review Board (IRB protocol 16770A initially approved 2/10/2009, and IRB protocol 17-0877 initially approved 9/13/2017) and was compliant with the Health Insurance Portability and Accountability Act. The need for individual patient consent was waived. The study patients were selected from a total of 3070 patients with lung cancer including NSCLC, pulmonary neuroendocrine tumor and carcinoid tumor treated at our university medical center from January 2004 to May 2017. The inclusion criteria were: (1) having a pretreatment (baseline) whole-body PET/CT scan, (2) absence of known brain metastases, and (3) presence of FDG-avid tumor detected visually by radiologists. Patients with non-FDG-avid NSCLC were excluded from the study. Patients with pulmonary neuroendocrine tumor and carcinoid tumor were excluded based on the 2015 World Health Organization Classification of Lung Tumors [27]. Patient selection for the study is depicted in Fig. 1. A total of 998 NSCLC patients were included in the analysis. The patients’ health information including treatment type, tumor histology, age, race, gender, smoking history, and comorbidities were compiled by our institution’s Cancer Registry and verified by the authors. The Charlson comorbidity index without tumor weights (CCI) [28] was calculated. As all patients had NSCLC, tumor weights were not assigned to the cancer diagnosis [29]. Clinical TNM stage was assigned by the authors according to the AJCC (American Joint Committee on Cancer) 8th edition of TNM staging system [30] using data from the clinical history, physical examination, contrast enhanced CT studies, and whole-body PET/CT scans. Tumor pathology type was coded by our University Cancer Registry using the ICD-0-3 and the 2022 Solid Tumor Rules (cancer.gov), 3rd edition [31]. Pre-treatment PS score was evaluated by our oncology colleagues before initial treatment [32].
 Fig. 1.
Flow diagram illustrating study patient inclusion and exclusion. Of the 3070 patients with lung cancer including NSCLC, pulmonary neuroendocrine tumor and carcinoid tumor diagnosed and treated at our institution from 2004 to 2017, 1423 patients had baseline FDG PET/CT for the diagnosis and staging of the tumor. 54 patients were excluded due to presence of brain metastasis at time of PET/CT, 24 patients were excluded because the patients’ tumor was not FDG avid, 317 patients were excluded because no ECOG performance status available in the patients’ medical record, 30 patients with pulmonary neuroendocrine tumor and carcinoid tumor were excluded.
The PET/CT imaging protocol and measurement of whole-body metabolic tumor volume have been described previously [33, 34, 35]. The FDG PET/CT scans of 517 patients (51.8%) were performed with a scanner (Reveal HD, CTI, Knoxville, TN, USA) [33]. FDG PET/CT scans of another 243 patients (24.4%) were acquired on a Siemens mCT scanner (Siemens Healthcare, Knoxville, Tennessee, USA) [35]. Two-hundred and thirty-eight patients obtained FDG PET/CT scans with adequate diagnostic quality judged by radiologists from outside hospitals (23.8%, scanned from June 2006 to March 2017) were also included in this study. In our medical center, whole-body FDG PET/CT scans were performed in accordance with the National Cancer Institute guidelines [36].
Two board-certified radiologists with experience in PET/CT imaging used the PET-edge tool of MIM software [37] (MIM Software Inc., Cleveland, OH) to measure the MTVwb and the SUVmaxwb, defined as the total MTV and the maximum SUV respectively of all visible tumors in the whole-body scan as previously described [33].
Overall survival (OS) was the primary endpoint, which was calculated as the time from the baseline PET/CT scan to the date of death from any cause. Surviving patients were considered censored on the date of last contact. Patient survival status was determined using the Social Security Death Index and through clinical follow-up.
Patients were randomly assigned to either a modeling or validation cohort. Patient and tumor characteristics were compared between the two cohorts using Pearson Chi-squared tests for all categorical variables, and student t-tests for normally distributed continuous variables including natural log transformed MTVwb, age and natural log transformed SUVmaxwb. Two-sample Wilcoxon rank-sum (Mann-Whitney) test was performed for non-normally distributed CCI. Log rank tests were performed for stage by stage survival comparison between the two cohorts.
The method for the formulation of the CPVP index is same as we previously described by our group for developing PVP index with exception for different variable numbers [25, 26]. There were a total 11 prognostic variables available in our database for the development of the CPVP index model including nine variables used in the CPVP index model and two other variables (CCI and SUVmaxwb). These variables have been shown to be associated with NSCLC prognosis [12, 13, 17, 18, 19, 20, 21, 26, 38]. We initially developed five candidate models with different numbers of the prognostic variables (5, 7, 9, 10 and 11 variables). The CPVP index model was then selected among the five candidate models based on their prognostic power as measured by C-statistic and parsimony of the models. CPVP index model selected from the candidate models contained nine variables (pre-treatment MTVwb, treatment type, clinical TNM stage, tumor histology, age, PS, race, gender, and smoking history). The CCI and SUVmaxwb were not included in the CPVP index as they had no significant prognostic contribution to the CPVP index model.
For constructing the CPVP index model, we used a multivariate Cox proportional
hazards regression model to obtain hazard ratios (HRs) and regression
coefficients for the ln(MTVwb) (natural log transformed MTVwb), NSCLC treatment
type (with 3 groups: surgical, non-surgical, and no cancer-specific therapy),
clinical TNM stage (with 3 groups: stage I or II, III, and IV), tumor histology
(with four groups: adenocarcinoma, squamous cell carcinoma, large cell carcinoma,
and not otherwise specified), age, PS (with 3 groups: 0, 1, and
The CPVP index was validated for its prognostic value and compared with the CV
index, PVP index and their individual independent variables in the validation
cohort. For the validation purpose, the detailed NSCLC treatment types of eight
groups (surgery only, surgery and chemotherapy, surgery and radiotherapy, surgery
and chemo- and radio-therapy, chemotherapy only, radiotherapy only, chemo- and
radio-therapy, and no cancer-specific therapy), and detailed clinical TNM stage
(IA, IB, IIA, IIB, IIIA, IIIB, IIIC, IVA, and IVB) were used in the analyses
because the detailed forms of the variables were more prognostic than those
included in the CPVP index equation and they are used in clinical practice.
Schoenfeld residuals were used to test the proportional hazards assumption. The
discriminatory power of the CPVP index was compared against the CV index, PVP
index and separately against each of its independent variables as determined by
the C-statistic, specifically Gönen and Heller’s K concordance statistic,
which is a quantitative measure of accuracy of statistical models [39]. A higher
C-statistic value for a model indicates greater discriminative power, with a
value of 1.0 indicating perfect discrimination. C-statistic values between 0.7
and 0.8 indicate moderate predictive power for a model, while values between 0.6
and 0.7 indicate weak predictive ability [40]. The C-statistics were compared
between models using a z-test of 500 bootstrapped iterations. We used Stata
Version 14 (Stata Corp., College Station, TX) for all statistical analyses, with
statistical significance defined at p
The patient and tumor characteristics of both modeling and validation cohorts are described in Table 1. There was no significant difference between the modeling and validation cohorts in any of the variables used for generating the index or in clinical outcomes including overall and stage-by-stage comparison of OS between two cohorts. In total, 703 (70.4%) patients died before the end of the study period, and 295 patients were censored, with a median follow-up of 72.4 months (interquartile range = 45.5–101.8) for censored patients.
| Variables | Total patients | % | Modeling group | Validation group | p-value | ||
| All patients | 998 | 100 | 495 | 503 | |||
| Treatment |
|||||||
| Surgery | 0.713 | ||||||
| Surgery only | 242 | 24.2 | 122 | 120 | |||
| with chemo | 105 | 10.5 | 48 | 57 | |||
| with XRT | 19 | 1.9 | 10 | 9 | |||
| with Chemo/XRT | 107 | 10.7 | 59 | 48 | |||
| No surgery | |||||||
| Chemo only | 168 | 16.8 | 78 | 90 | |||
| XRT only | 103 | 10.3 | 54 | 49 | |||
| Chemo/XRT | 186 | 18.6 | 95 | 91 | |||
| No cancer-specific therapy | 68 | 6.8 | 29 | 39 | |||
| TNM stage | 0.323 | ||||||
| Stage IA/B | 238/82 | 23.8/8.2 | 118/45 | 120/37 | |||
| Stage IIA/B | 43/100 | 4.3/10.0 | 20/54 | 23/46 | |||
| Stage IIIA/B/C | 140/92/40 | 14.0/9.2/4.0 | 73/44/22 | 67/48/18 | |||
| Stage IVA/B | 136/127 | 13.6/12.7 | 53/66 | 83/61 | |||
| Histology | 0.085 | ||||||
| Adenocarcinoma | 543 | 54.4 | 265 | 278 | |||
| SCC | 283 | 28.4 | 154 | 129 | |||
| Large cell carcinoma | 37 | 3.7 | 20 | 17 | |||
| *NOS | 135 | 13.5 | 56 | 79 | |||
| ECOG performance status | 0.203 | ||||||
| 0 | 300 | 30.1 | 141 | 159 | |||
| 1 | 540 | 54.1 | 266 | 274 | |||
| 2–4 | 158 | 15.8 | 88 | 70 | |||
| Race | 0.831 | ||||||
| White | 515 | 51.6 | 251 | 264 | |||
| Black | 444 | 44.5 | 225 | 219 | |||
| Others** | 39 | 3.9 | 19 | 20 | |||
| Gender | 0.386 | ||||||
| Female | 542 | 54.3 | 262 | 280 | |||
| Male | 456 | 45.7 | 233 | 223 | |||
| Smoking | 0.653 | ||||||
| Never# | 94 | 9.4 | 48 | 46 | |||
| Current | 329 | 33.0 | 169 | 160 | |||
| Prior | 575 | 57.6 | 278 | 297 | |||
| ln(MTVwb) (mL, X |
3.15 |
3.16 |
3.15 |
0.979 | |||
| Age (years, X |
67.4 |
67.0 |
67.9 |
0.148 | |||
| SUVmaxwb (X |
11.3 |
11.6 |
11.0 |
0.239 | |||
| CCI [median (range)] | 1 (0–8) | 1 (0–8) | 1 (0–8) | 0.261 | |||
| Notes: CCI, Charlson comorbidity index; Chemo/XRT, chemoradiation; MTVwb,
whole-body metabolic tumor volume; N, number of patients; NOS, not otherwise
specified; SCC, Squamous cell carcinoma
* Two patients with adenosquamous and three patients with sarcomatoid were
included in the group. **Others race includes Asian, Hawalian and Pacific
islander, and unknown (in 6 patients in Total cohort); #two patients the smoking
history was unknown included in the Never category; SD, standard deviation.
| |||||||
For the modeling cohort the HRs and regression coefficients, of the variables for the development of the CPVP index are listed in Table 2. We included all the nine variables listed in the Table 2 in the model, including race and gender variables which were not statistically significant in the multivariate cox regression model. This is because the literature suggested that these are important predictors for lung cancer survival, and all the variables were statistically significantly associated with overall survival in the univariate Cox regression model.
| HR | ||||
| ln(MTVwb) | 1.21 | 0.191 (0.109–0.272), | ||
| Treatment | ||||
| Surgery | 1.0 (Reference) | 0 | ||
| No Surgery | 1.71 | 0.539 (0.241–0.837), | ||
| No cancer-specific therapy | 3.34 | 1.204 (0.748–1.661), | ||
| TNM stage | ||||
| Stage I + II | 1.0 (Reference) | 0 | ||
| Stage III | 1.25 | 0.228 (–0.089–0.546), 0.15 | ||
| Stage IV | 2.05 | 0.715 (0.379–1.05), | ||
| Histology | ||||
| Adenocarcinoma | 1.0 (Reference) | 0 | ||
| SCC | 1.26 | 0.235 (–0.015–0.486), 0.066 | ||
| LCC | 0.87 | –0.144 (–0.752–0.463), 0.642 | ||
| NOS | 1.00 | 0.001 (–0.346–0.348), 0.01 | ||
| Age | 1.02 | 0.017 (0.005–0.029), 0.004 | ||
| ECOG performance status | ||||
| 0 | 1.0 (Reference) | 0 | ||
| 1 | 1.08 | 0.082 (–0.183–0.349), 0.542 | ||
| 1.36 | 0.304 (–0.027–0.635), 0.072 | |||
| Race | ||||
| White | 1.0 (Reference) | 0 | ||
| Black | 1.02 | 0.018 (–0.215–0.252), 0.879 | ||
| Others | 0.76 | –0.280 (–0.964–0.403), 0.421 | ||
| Gender | ||||
| Female | 1.0 (Reference) | 0 | ||
| Male | 1.03 | 0.033 (–0.188–0.255), 0.768 | ||
| Smoking | ||||
| Never | 1.0 (Reference) | 0 | ||
| Current | 1.68 | 0.521 (0.063–0.979), 0.026 | ||
| Prior | 1.73 | 0.548 (0.102–0.995), 0.016 | ||
Using the regression coefficients, the CPVP index was formulated as follows:
CPVP index = 0.191 * In(MTV) + 0.539 * I (No surgery) + 1.204 * I (No
cancer-specific therapy) + 0.228 * I (TNM = III) + 0.715 * I (TNM = IV) + 0.235 *
I (Squamous cell carcinoma) – 0.144 * I (Large cell carcinoma) + 0.001 * I
(Histologic subtype not otherwise specified) + 0.017 * Age + 0.082 * I (PS = 1) +
0.304 * I (PS
The indicator function for categorical variables I(
As shown in Table 3, univariate Cox regression analysis in the validation cohort
revealed a significant association of OS with the CPVP index (HR = 3.14, 95% CI
= 2.71–3.65, p
| Variables | N | HR (95% CI) | p-Value | C | |
| CPVP index | 503 | 3.14 (2.71, 3.65) | 0.72 | ||
| PVP index | 503 | 4.00 (3.25, 4.91) | 0.70 | ||
| CV index | 503 | 3.17 (2.67, 3.76) | 0.68 | ||
| ln(MTV |
503 | 1.51 (1.41, 1.62) | 0.69 | ||
| Treatment | 0.67 | ||||
| Surgery | |||||
| Surgery only | 120 | (reference) | |||
| with chemo | 57 | 1.09 (0.72, 1.68) | |||
| with XRT | 9 | 1.51 (0.65, 3.50) | |||
| with Chemo/XRT | 48 | 1.25 (0.80, 1.98) | |||
| No surgery | |||||
| Chemo only | 90 | 5.37 (3.83, 7.50) | |||
| XRT only | 49 | 2.17 (1.43, 3.30) | |||
| Chemo/XRT | 91 | 4.17 (2.97, 5.83) | |||
| No cancer-specific therapy | 39 | 5.23 (3.44, 7.96) | |||
| TNM stage | 0.66 | ||||
| IA | 120 | (reference) | |||
| IB | 37 | 1.21 (0.75, 1.96) | |||
| IIA | 23 | 1.40 (0.80, 2.43) | |||
| IIB | 46 | 1.72 (1.12, 2.64) | |||
| IIIA | 67 | 2.14 (1.47, 3.12) | |||
| IIIB | 48 | 3.21 (2.14, 4.83) | |||
| IIIC | 18 | 3.76 (2.09, 6.75) | |||
| IVA | 83 | 3.09 (2.18, 4.39) | |||
| IVB | 61 | 7.84 (5.38, 11.41) | |||
| Tumor histology | 0.55 | ||||
| Adenoc | 278 | (reference) | |||
| SCC | 129 | 1.14 (0.89, 1.46) | |||
| LCC | 17 | 1.38 (0.78, 2.43) | |||
| NOS | 79 | 1.90 (1.44, 2.52) | |||
| Age | 503 | 1.01 (1.00, 1.02) | 0.015 | 0.54 | |
| ECOG PS | 0.58 | ||||
| 0 | 159 | (reference) | |||
| 1 | 274 | 1.52 (1.20, 1.93) | |||
| 70 | 2.72 (1.96, 3.80) | ||||
| Race | 0.023 | 0.54 | |||
| White | 264 | (reference) | |||
| Black | 219 | 1.34 (1.09–1.65) | |||
| Others | 20 | 1.06 (0.59–1.91) | |||
| Gender | 0.71 | 0.50 | |||
| Female | 280 | (reference) | |||
| Male | 223 | 1.04 (0.85–1.28) | |||
| Smoking | 0.47 | 0.51 | |||
| Never | 46 | (reference) | |||
| Current | 160 | 1.23 (0.82–1.87) | |||
| Prior | 297 | 1.28 (0.86–1.90) | |||
| Notes: Adenoc, adenocarcinoma; C, Gönen and Heller’s K concordance
statistic; CCI, Charlson comorbidity index; CI, confidence interval; CPVP index,
clinical and PET/CT volumetric prognostic index; CV index, clinical variable
index; HR, hazard ratio; ln(MTVwb) is natural log-transformed whole-body
metabolic tumor volume; LCC, Large cell carcinoma; N, number of patients; NOS,
not otherwise specified; PVP index, PET/CT volumetric prognostic index; SCC,
Squamous cell carcinoma
p = 0.006 for CPVP index vs. PVP index. p = 0.002 for CPVP
index vs. ln(MTVwb).
| |||||
The Kaplan-Meier OS based on quartiles of the CPVP index (Fig. 2A), clinical TNM
stage (Fig. 2B) and the quartiles of CV index (Fig. 2C) in the validation cohort
showed an association of these metrics with OS (all p
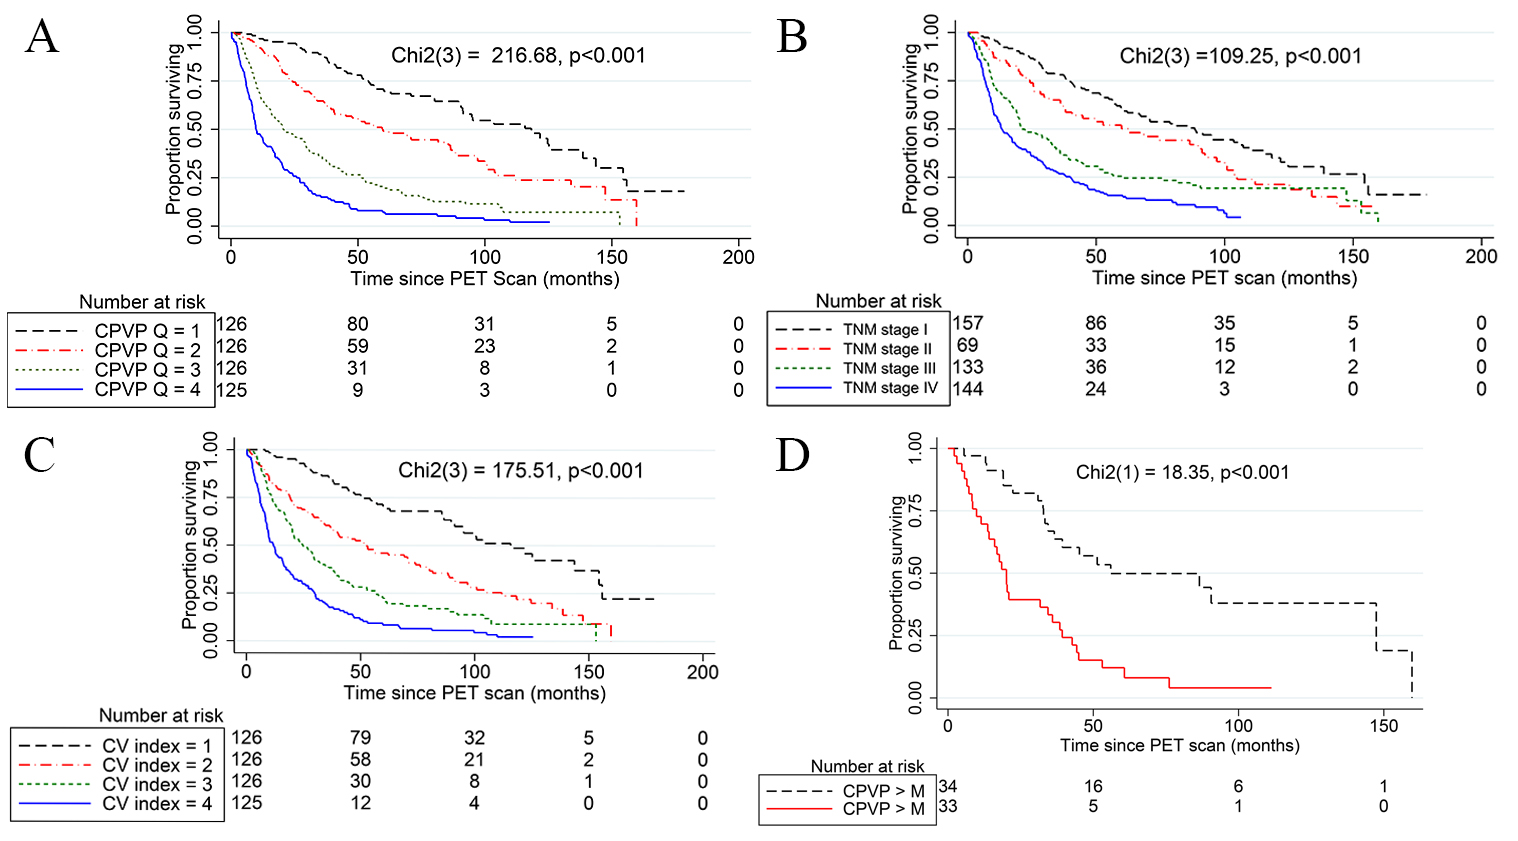 Fig. 2.
Kaplan-Meier survival analysis and Log Rank test. (A) Kaplan-Meier curves show the significant association of the quartiles of the CPVP index (CPVP Q) with OS. The black dash, red dash-dot, green short-dash, and blue solid curves indicate the 1st, 2nd, 3rd and 4th quartiles of the CPVP index, respectively. The median OS of the 1st, 2nd, 3rd and 4th quartiles of the CPVP index was 115.8 months, 56.0 months, 20.8 months, and 9.8 months respectively. (B) Kaplan-Meier curves show the significant association of clinical TNM stage with OS. The black dash, red dash-dot, green short-dash, and blue solid curves indicate the clinical TNM stage I, II, III and IV, respectively. (C) Kaplan-Meier curves show the significant association of the quartiles of the clinical variable index (CV index Q) with OS. The black dash, red dash-dot, green short-dash, and blue solid curves indicate the 1st, 2nd, 3rd and 4th quartiles of the CV index, respectively. (D) The Kaplan-Meier curves of patients with clinical TNM stage IIIA NSCLC divided by the median CPVP index of the TNM sub-stage (3.05) show significant association of CPVP index with patients’ overall survival. Black dash and red solid lines indicate CPVP index less than the median and greater than the median of the stage IIIA patients, respectively. M represents the median of CPVP index in stage IIIA patients.
In this study, we developed a new instrument, the CPVP index, for individualized prognosis assessment of patients who have completed initial therapy for NSCLC. We have shown that the CPVP index has a significantly greater prognostic power than its individual independent variables, CV index and PVP index. The greater prognostic power of the CPVP index compared to the CV index indicates that the addition of the MTVwb from baseline whole-body PET/CT studies makes the model perform significantly better than if this PET measurement was not included. The greater prognostic power of the CPVP index than that PVP index is likely related to the inclusion of six clinical variables (treatment type, tumor histology, PS, race, gender, and smoking history).
The CPVP index has a higher C-statistic value than previously reported nomograms for prognosis of NSCLC (C-statistic values range from 0.60 to 0.70) [41, 42, 43, 44, 45]. The new CPVP index also demonstrated a higher C-statistic value than our previously reported PVP index for NSCLC (C-statistic value = 0.71). The improvement is likely due to the integration of multiple prognostic variables as the index is the summation of the hazard of death from any cause associated with the prognostic variables included in the index [25]. Kaplan-Meier curves for the validation cohort divided by the quartiles of the CPVP index also demonstrated better separation of the patient groups with different survival probability than those divided by clinical TNM stage.
We believe that our new CPVP index can help clinicians to estimate NSCLC patient prognosis at an early stage after treatment by further differentiating risk in a quantitatively more accurate and practically more efficient way. This helps inform decision making about adjuvant therapy and helps patients and their families have a clearer idea about prognosis. The index also may be used in situations where quantitative risk assessment is needed, such as in clinical trials, where the CPVP index can be used to match the patients with similar prognosis for post-treatment intervention. The FDG PET/CT scans for this study cohort were performed with different scanners, and in some patients, the scans were obtained at outside institutions. Therefore, the FDG PET/CT scanners used in this study were heterogeneous and mimic real world situations, suggesting that the model developed based on this cohort may be generalized to other centers.
In addition, Kaplan-Meier curves for the validation cohort divided by the
quartiles of the CPVP index also demonstrated better separation of the patient
groups with different survival probability than those divided by clinical TNM
stage. The median OS of the 1st, 2nd, 3rd and 4th quartiles of the CPVP index was
121.7 months, 59.6 months, 20.9 months, and 9.8 months, respectively. The
Kaplan-Meier curves of patient groups with clinical TNM stage IIIA NSCLC divided
by the median CPVP index of the TNM stage show significant survival difference in
the patient groups within the same TNM stage IIIA. Therefore, we believe our new
CPVP index can help clinicians to develop more effective post-treatment follow-up
strategies at an early stage after initial treatment by further differentiating
risk. One way to use CPVP index for patient follow-up is that we may use the
quartiles of CPVP index and their estimated OS in the validation cohort to follow
the NSCLC patients. If the CPVP index of a patient is
This study has some limitations. First, this is a retrospective study within a single academic institution. Validation with data from other institutions is needed to further establish the prognostic value of the CPVP index. Second, the study is limited by a relatively small sample size. This prevented us from formulating the CPVP index with more than three clinical TNM-stage groups. Similarly, some of the individual treatment type, tumor histology subtype and PS sub-groups also had relatively few patients. In addition, there were 135 cases (13.5%) whose tumor histological subtype is unknown. Third, the study is also limited by not being able to include genetic testing, new therapeutic methods such as targeted therapy and immune therapy. In addition, in the future the TNM staging system may be updated. With the advancement of genetic testing, more effective therapeutic methods and updating TNM staging system in NSCLC, the CPVP index needs to be updated by including these variables.
The CPVP index for NSCLC patients has moderately strong prognostic power and is more prognostic than its individual prognostic variables and other indices. It provides a practical tool for quantitative prognostic assessment after initial treatment and therefore may be helpful for the development of individualized treatment and monitoring strategy for NSCLC patients.
CCI, Charlson comorbidity index; CPVP index, clinical and PET/CT volumetric prognostic index; CV index, clinical variable index; FDG, fluorodeoxyglucose; HR, hazard ratio; ln(MTVwb), natural log-transformed whole-body metabolic tumor volume; NSCLC, non-small cell lung cancer; PET/CT, Positron Emission Tomography - Computed Tomography; PS, Eastern Cooperative Oncology Group (ECOG) performance status; PVP index, PET/CT volumetric prognostic index.
LL—Validation, Investigation, Writing-Original Draft. JZ—Investigation. MKF—Conceptualization, Investigation and Writing - Review & Editing. DA—Writing - Review & Editing. JXZ—Conceptualization, Methodology, Writing - Review & Editing. YP—Conceptualization, Methodology, Validation, Formal analysis, Investigation, Writing - Original Draft and Funding acquisition.
The informed consent was waved for all participants. The institutional review board of the University of Chicago approved the study on 2/10/2009 and 9/13/2017, IRB protocol 16770A an d 17-0877.
We thank Kristen Wroblewski, Biostatistician, from Department of Public Health Sciences, University of Chicago, Chicago, IL, USA, for helping in statistical analysis; and Bill C. Penney for editorial assistance. Thanks to all the peer reviewers for their opinions and suggestions.
This research was funded by the National Cancer Institute of the National Institutes of Health, USA, grant number R21 CA181885. This research was funded by the Youth Medical Talents-Medical Imaging Practitioners Program of China, grant number SHWRS(2020)_087. This research was funded by the Natural Science Foundation of Shanghai of China, grant number 21ZR1458900.
The authors declare no conflict of interest.