
Academic Editor: Igor Lavrov
Background: Neurons have specialized structures that facilitate information transfer using electrical and chemical signals. Within the perspective of neural computation, the neuronal structure is an important prerequisite for the versatile computational capabilities of neurons resulting from the integration of diverse synaptic input patterns, complex interactions among the passive and active dendritic local currents, and the interplay between dendrite and soma to generate action potential output. For this, characterization of the relationship between the structure and neuronal spike dynamics could provide essential information about the cellular-level mechanism supporting neural computations. Results: This work describes simulations and an information-theoretic analysis to investigate how specific neuronal structure affects neural dynamics and information processing. Correlation analysis on the Allen Cell Types Database reveals biologically relevant structural features that determine neural dynamics—eight highly correlated structural features are selected as the primary set for characterizing neuronal structures. These features are used to characterize biophysically realistic multi-compartment mathematical models for primary neurons in the direct and indirect hippocampal pathways consisting of the pyramidal cells of Cornu Ammonis 1 (CA1) and CA3 and the granule cell in the dentate gyrus (DG). Simulations reveal that the dynamics of these neurons vary depending on their specialized structures and are highly sensitive to structural modifications. Information-theoretic analysis confirms that structural factors are critical for versatile neural information processing at a single-cell and a neural circuit level; not only basic AND/OR but also linearly non-separable XOR functions can be explained within the information-theoretic framework. Conclusions: Providing quantitative information on the relationship between the structure and the dynamics/information flow of neurons, this work would help us understand the design and coding principles of biological neurons and may be beneficial for designing biologically plausible neuron models for artificial intelligence (AI) systems.
Neurons are classified structurally according to the branching patterns of their dendrites and axons: a multipolar neuron has several dendrites and an axon, a bipolar neuron contains a dendrite and an axon, a pseudo-unipolar neuron has an axon that splits into two branches, and a unipolar neuron possesses only a single axon [1]. The multipolar neurons constitute the most prevalent type in the vertebrate central nervous system and are regarded as responsible for high-order computations while bipolar and pseudo-unipolar neurons play important roles in the sensory system. Unipolar neurons have only a limited role for vertebrates, although they are the dominant type in invertebrates.
Even for the same type of neurons in the same region of the brain, the dendritic structures of neurons are diverse [2, 3, 4, 5, 6, 7], leading to different dynamics of action potentials [8, 9, 10]. Neurons whose dendritic structures consist of many branches [8] with a high degree of asymmetry [9] tend to generate high-frequency regular spikes or burst-firing. Neurons whose apical dendrites are either too large or too small are less likely to burst upon either somatic or dendritic stimulation [10]. Subcellular structures are also strongly correlated with neuronal dynamics. For example, spines, which are tiny and highly motile membrane protrusions, are the primary structure for synapse formation that greatly affects neural dynamics and computations. They are morphologically classified into filopodia, thin, stubby, mushroom, and branched types, each exhibiting different physicochemical properties [11, 12]. Rich dynamics in creation, type-transition, translocation, and clustering of spines would influence the synaptic transmission and learning. The axon initial segment (AIS), the proximal portion of the axon beginning at the emergence of the axon from the soma (the axon hillock) and ending at the onset of the myelin sheath, is responsible for initiating action potentials [13]. Moreover, changes in structural properties of AIS (which usually occurs in time scales of hours to days [14]) fine-tune the spiking behavior of neurons: if the AIS locates distally from the soma, the somatic voltage threshold [15, 16] and the width of the action potential decrease [16].
The strategies for neuron modeling are diverse, ranging from simple integrate-and-fire (IF) modeling [17, 18, 19], Hodgkin-Huxley type biophysical modeling [20, 21], to multi-compartmental biophysical approaches [22, 23]. The multi-compartmental models are of primary importance for characterizing neural dynamics and computation because the models can reproduce both spatial and temporal behaviors of neurons. Moreover, the model structure can be highly realistic via three-dimensional morphological reconstruction of biological neurons [23]. Ever since the pioneering work of Warren S. McCulloch and Walter Pitts in 1943 [24], developing biologically plausible neuron models for artificial neural networks and neuromorphic systems has attracted the computational neuroscience community. While simple neuron models can be easily implemented in artificial neural networks or neuromorphic systems [25], they are incapable of modeling properly the rich dynamics of the dendrite, axon, and subcellular structures that are important for neural computations [26, 27, 28]. In this context, the ideal treatment would be to start from biophysically realistic multi-compartment models and to reduce the models, with the intrinsic dynamics and computational capabilities of biological neurons retained, which are then implementable in artificial intelligence (AI) systems [25, 29].
This study explores how the structural properties of neurons affect neural dynamics and information processing. We first analyze the Allen Cell Types Database [30] to understand correlations between structural features and electrophysiological properties of biological neurons. Based on the knowledge of biological neurons, the dynamics and coding properties of biophysically realistic multi-compartment models for three primary neurons in the direct and indirect hippocampal pathways are systemically investigated.
By way of outline, Section 2 (Methods) describes structural and electrophysiological features of neurons (2.1), multi-compartmental neuron models (2.2), and the information-theoretic framework for evaluating neural information processing (2.3). Section 3 (Results) begins with the correlation analysis of the Allen Cell Types Database, which helps identify relevant structural features for determining electrophysiological properties (3.1), characterizes the effects of structural modifications on neuronal dynamics and computation at a single-cell level (3.2), and describes the structural effects on the neural circuit behavior (3.3). Section 4 combines Discussion and Conclusions.
We use most of the structural and electrophysiological features introduced in
the Allen Cell Types Database [30] to characterize both biological neurons and
neuron models. Table 1 lists the structural attributes and their definitions. In
the Allen Cell Types Database, the structural attributes (S
| Feature | Name | Description |
| S |
Average local bifurcation angle | The average angle between the first two compartments (in degree) at a bifurcation. |
| S |
Average contraction | The average ratio between the Euclidean distance of a branch and its path length. Euclidean distance of a branch represents the straight-line distance from the soma to the branch. The path length is given by the sum of the lengths between each node along the path. |
| S |
Average diameter | The average diameter of all compartments of the neuron. |
| S |
Average parent-daughter ratio | The average ratio between the diameter of a daughter branch and its parent branch. One value for each daughter branch is generated at each bifurcation point. |
| S |
Maximum branch order | The maximum order of the branch. The order of a branch is defined with respect to the soma of which the branch order vanishes. The first bifurcation has a branch order equal to unity, the second bifurcation has a branch order two, and so on. |
| S |
Maximum Euclidean distance to root | The maximum Euclidean distance of all nodes. Euclidean distance corresponds to the straight line distance from the soma (root) to the node. |
| S |
Maximum path distance to root | The maximum path distance of all nodes. The path distance is the sum of lengths of all connected nodes from the soma, ending with that node. |
| S |
Number of bifurcations | The number of bifurcations for the neuron. A bifurcation point has two daughters. |
| S |
Number of branches | The number of branches in the neuron. A branch consists of one or more compartments that lie between two branching points or between one branching point and a termination point. |
| S |
Number of nodes | The total number of nodes in the given input neuron. A node represents a single sample point of the neuron defined by its coordinates, a radius, and its connectivity to other nodes in the neuron. |
| S |
Number of stems | The number of stems attached to the soma. Except for the node designating the soma, each node is labeled as a stem. |
| S |
Number of tips | The number of terminal tips for the given input neuron. This function counts the number of nodes that are terminal endpoints. |
| S |
Soma surface area | The surface area of the soma is computed by one of two methods. If the soma is composed of just one node then the sphere assumption is used; otherwise, the sum of external cylindrical surfaces of nodes forming the soma is calculated. |
| S |
Total length | The total length of a neuron is computed as the sum of distances between two connected nodes for all branches of the input neuron. |
| S |
Total surface area | The total surface area of the entire neuron. |
| S |
Total volume | The total volume of the entire neuron. |
The neuron models for three primary cells in the hippocampus, i.e., the
pyramidal cell in Cornu Ammonis 1 (CA1), that in CA3, and granule cell in the
dentate gyrus (DG), are systemically analyzed (Fig. 1). These models were
developed by Vetter et al. (ModelDB accession 7907) [33] to examine the
effects of dendrite structures on the efficacy of the forward/backward
propagation of action potentials; the models describe realistic structures via
three-dimensional morphological reconstruction of biological neurons [34, 35, 36]. All
dendrites are divided into compartments with a maximum length of 7 mm. Two
Hodgkin–Huxley-type conductances (g
 Fig. 1.
An information-theoretic framework for evaluating neural
information processing of models for hippocampal neurons. (a) Illustration for
the CA1 pyramidal neuron. Two synaptic inputs (blue and red arrows) are presented
on the apical dendrite. The synaptic inputs are triggered by hidden states
x
The synaptic conductance is described in terms of the dynamics of ionotropic
glutamate receptors such as the
We modify the three primary structural factors (i.e., dendritic length,
diameter, and the number of branches) to test if these factors can influence
neural dynamics and information processing. The lengths or diameters of all
dendritic compartments in the model are multiplied by the same value (e.g.,
2-fold increase or 0.5-fold decrease). The number of branches is varied in the
following manner: either new branches with fixed diameter and length (e.g., 0.5
Mutual information between a presynaptic binary hidden state and the axonal
output spike train provides a useful tool for characterizing neural information
processing of the neuron models. We extend the information-theoretic framework,
first suggested by Denève and colleagues [39, 40, 41, 42, 43], to include multiple
synapses and hidden states, similarly to our previous work [44]. The binary
hidden state of a neuron represents a stimulus that appears and disappears
randomly. For instance, the stimulus may correspond to a bar with a given
orientation in a visual receptive field or a sound with a preferred frequency.
Each of the hidden states x
The binary hidden states follow a Markov process with the composite hidden state
(x
where p
The mutual information I(x
where the entropy H(x
and the conditional entropy
with angled brackets denoting time averages. The conditional probability
p(x
We estimate the posterior log-likelihood L
where w
Fig. 2 displays Pearson correlation coefficients between the structural and
electrophysiological features (i.e., spike shape-related features, denoted as
ES
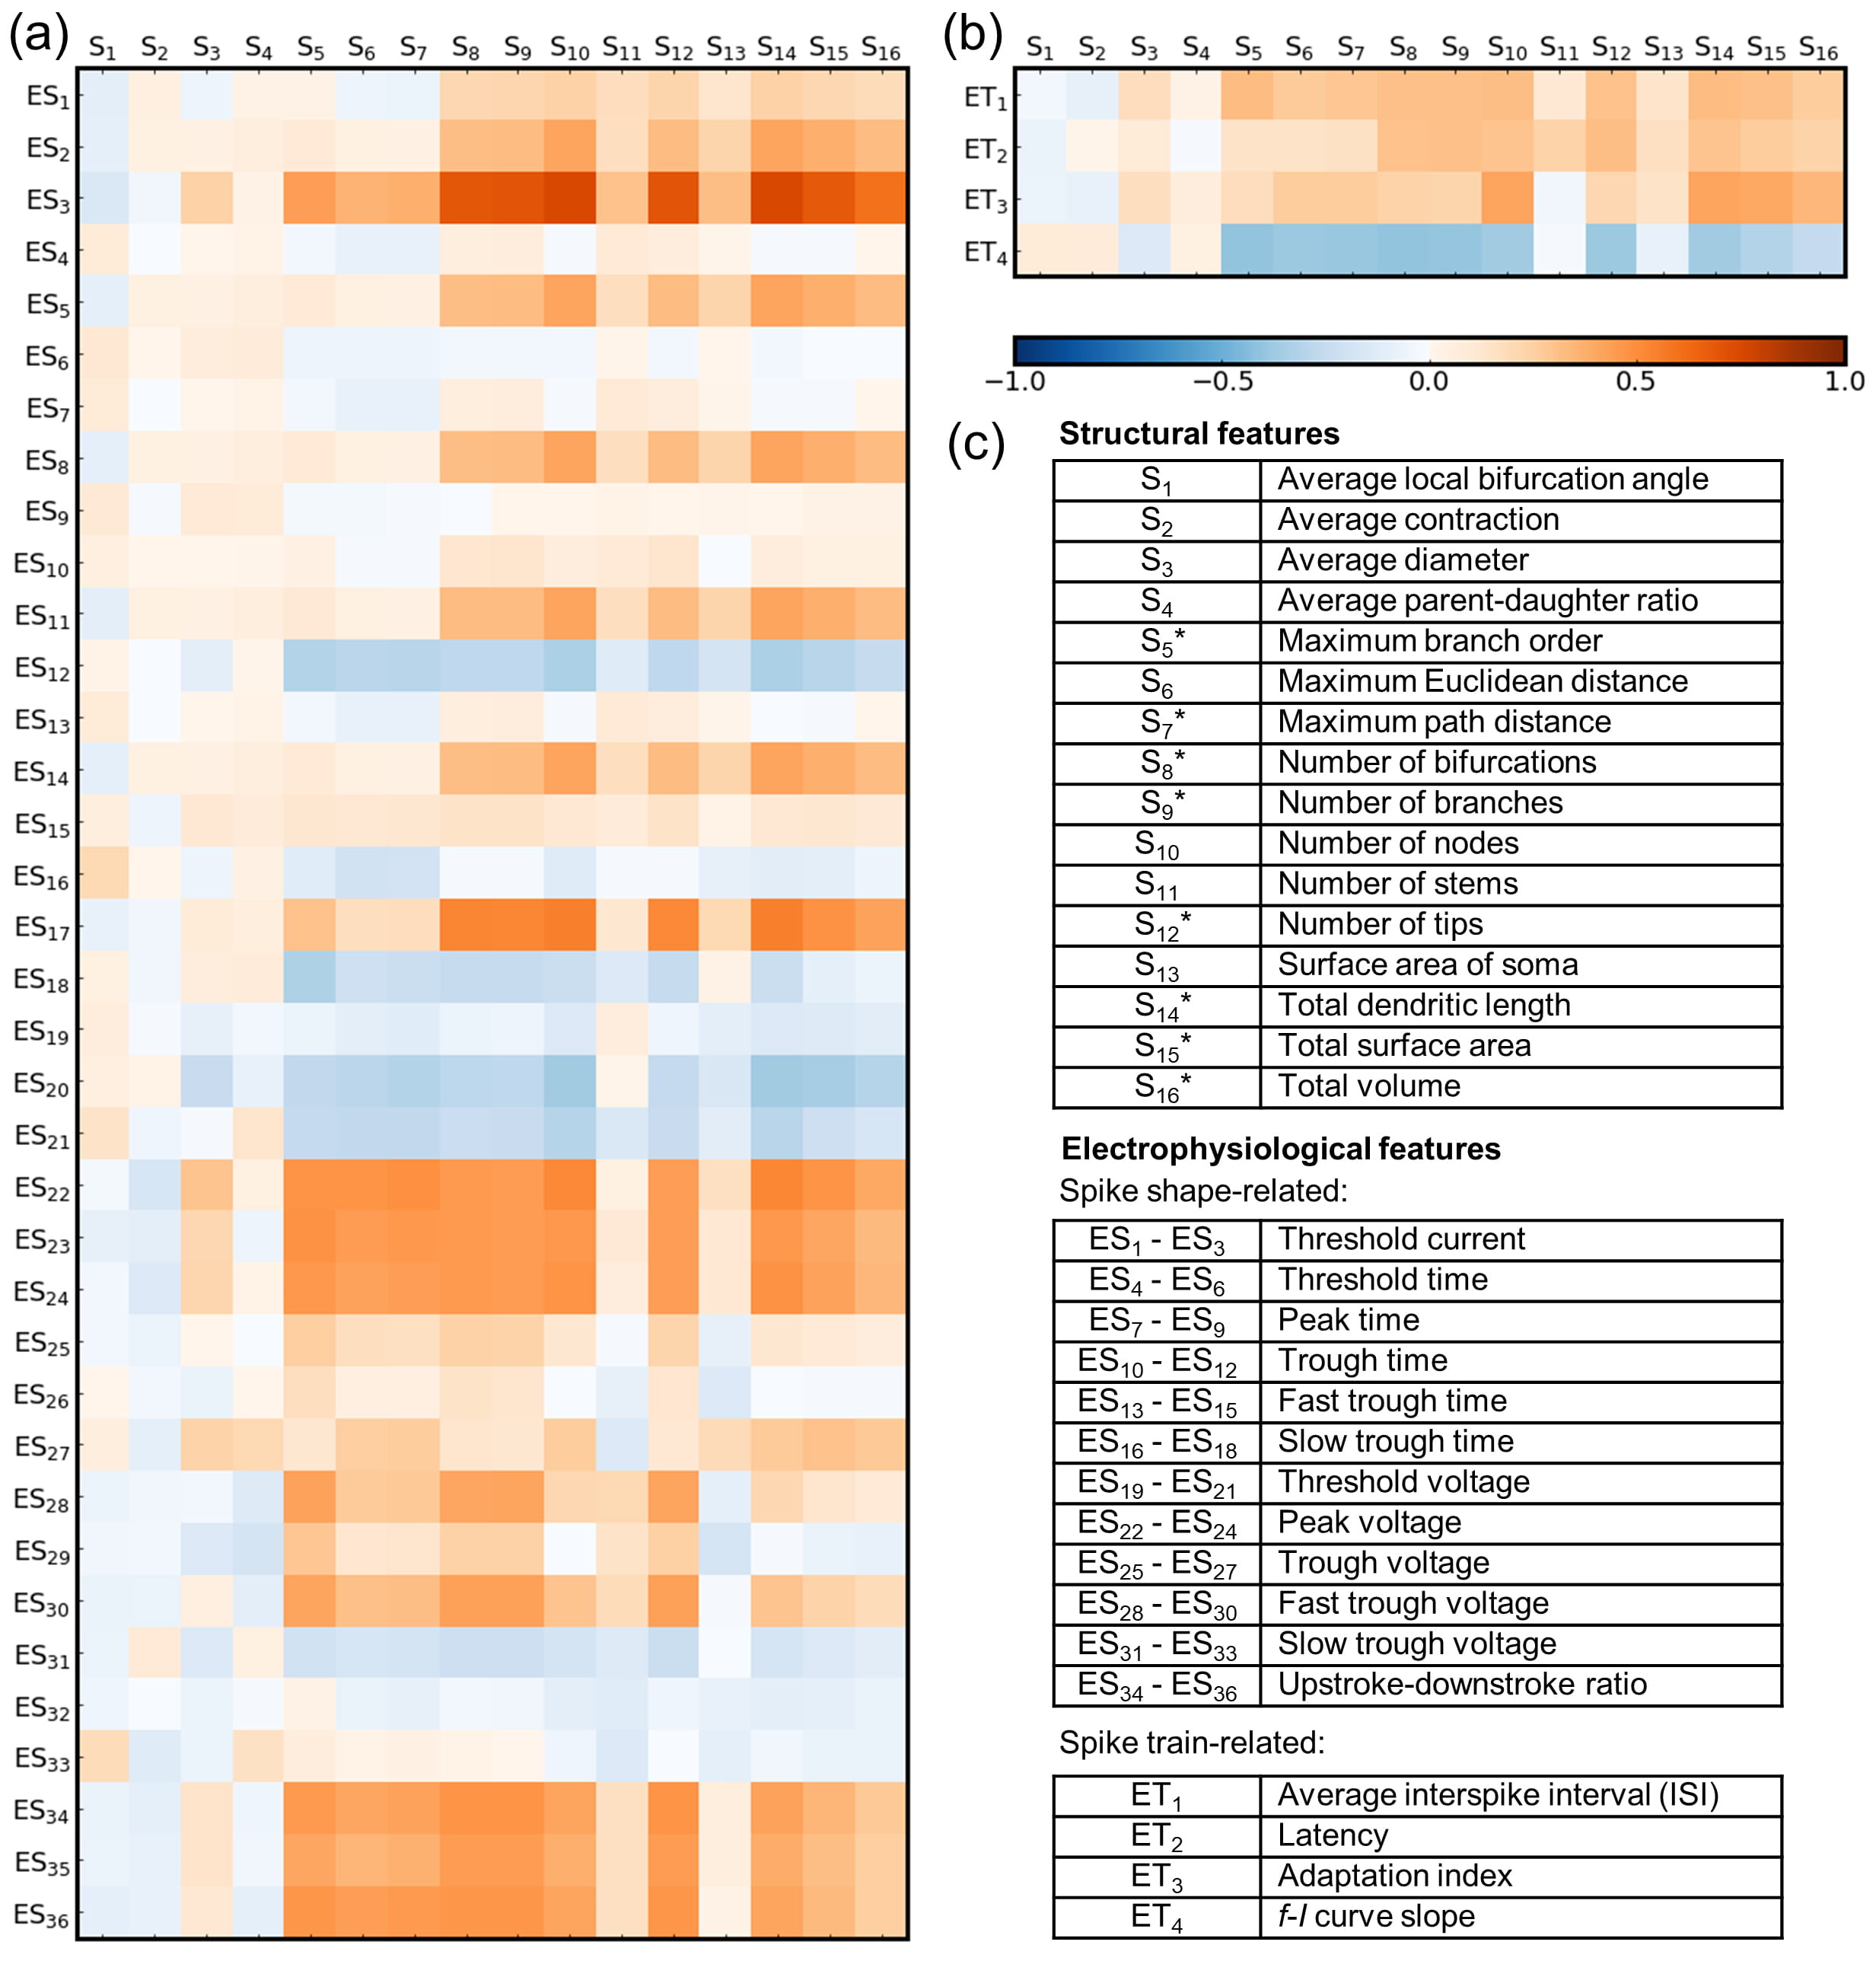 Fig. 2.
Correlations between the structural and
electrophysiological features of biological neurons in the Allen Cell Types
Database. (a) Pearson correlation coefficients between structural features
(S
The ‘threshold currents (ES
Overall, among the non-averaged features (S
Fig. 3 illustrates that the eight primary structural features (i.e., S
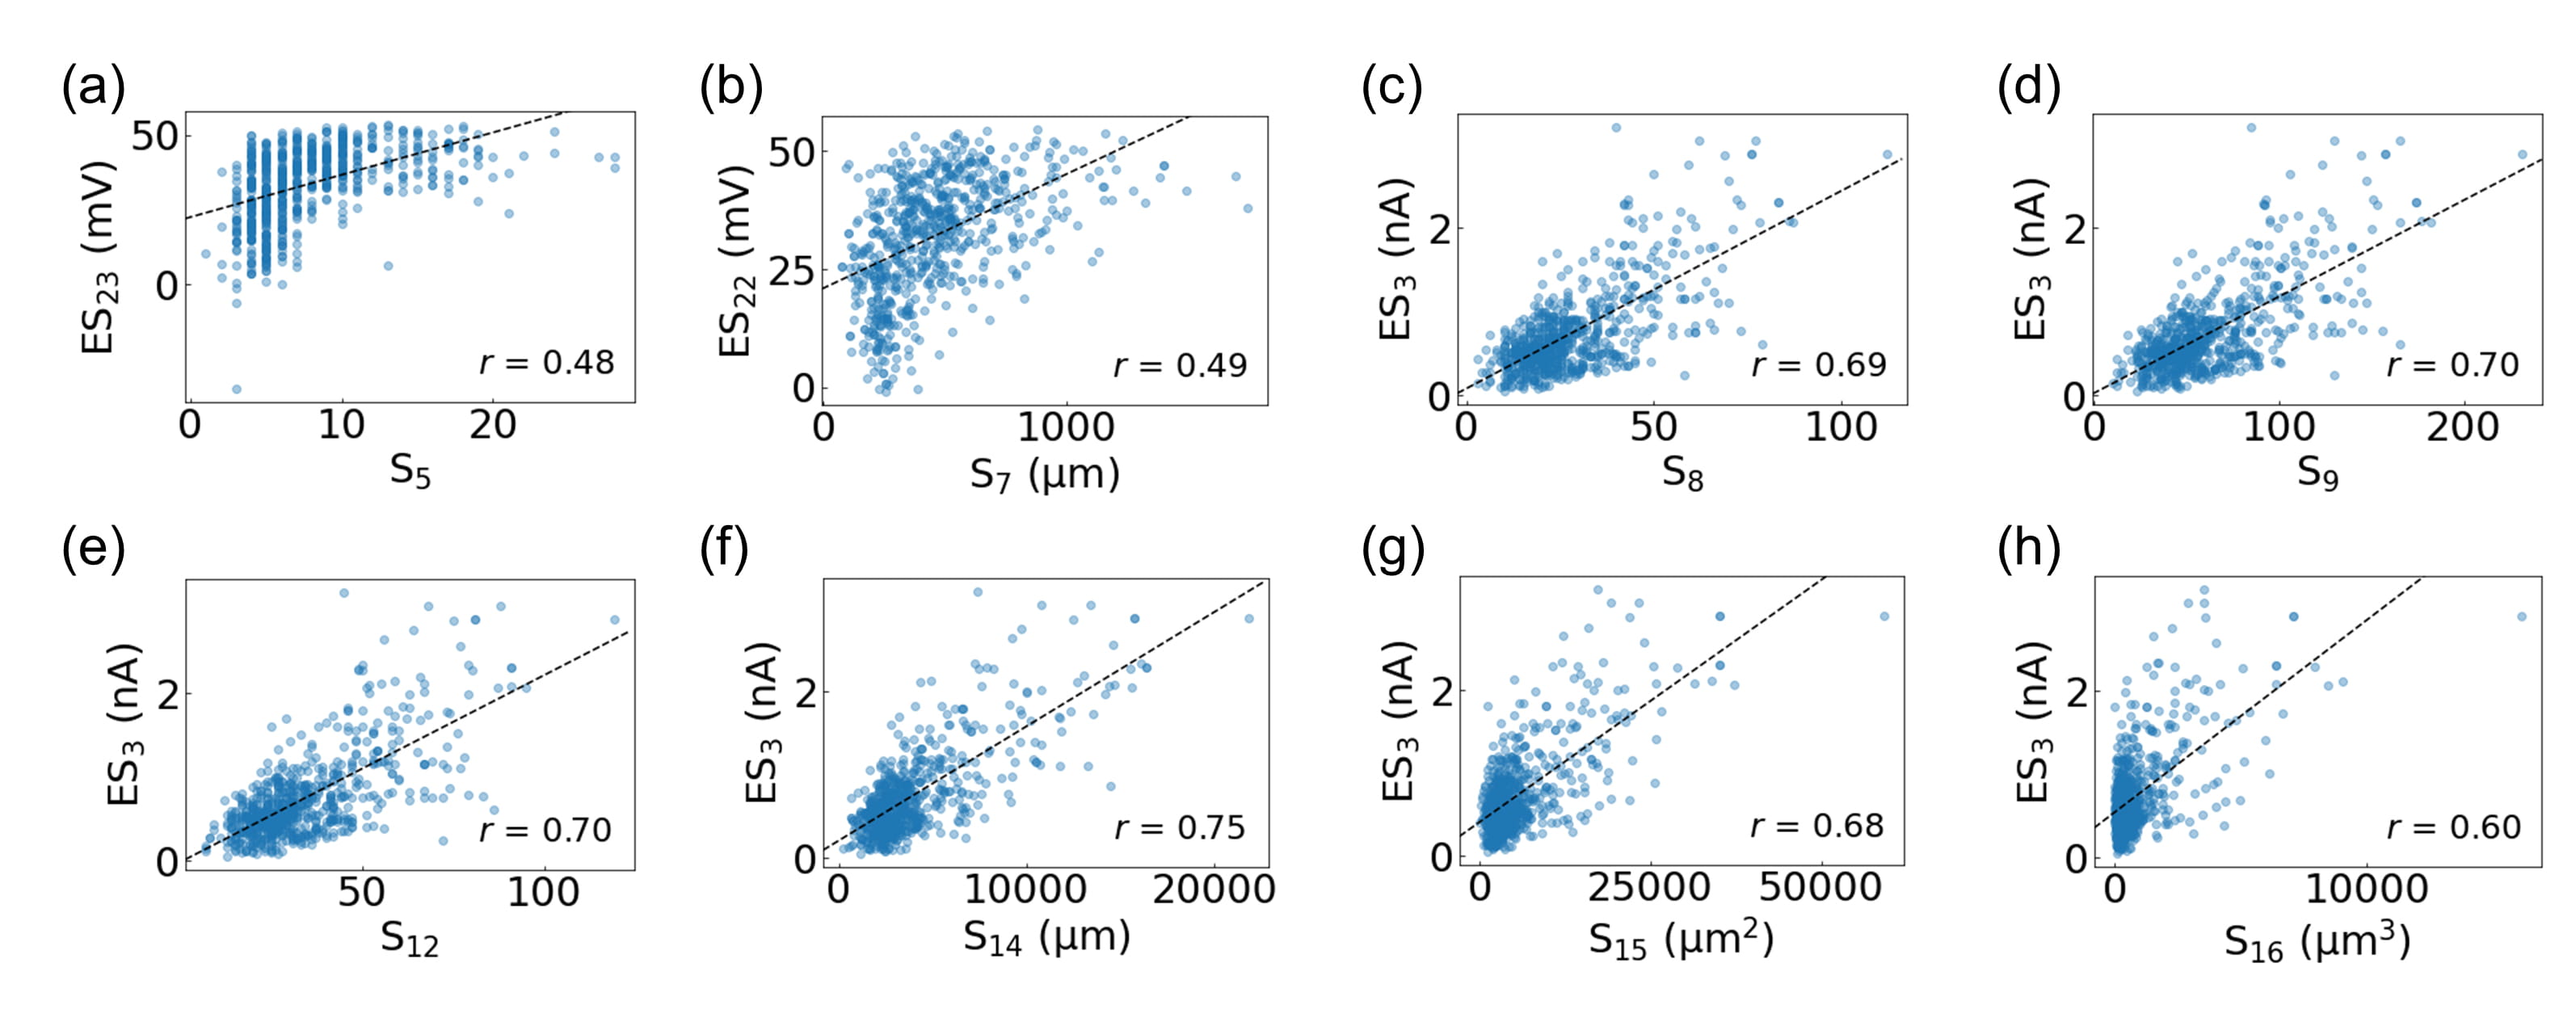 Fig. 3.
Correlation analysis of the biological neurons in the
Allen Cell Types Database. The most strongly correlated electrophysiological
feature for each of the primary structural features is displayed: (a) S
The essential dynamic behaviors of the three hippocampal neurons are exhibited in Fig. 4. The long square current input for one second is fed into the soma, and the output spike train at the soma is measured. The I-f curve, which represents the relation between firing rate f and the magnitude I of the input current, is presented in the first row of Fig. 4. The I-f relations of CA1 and CA3 pyramidal neurons show similar patterns, with their maximum frequencies around 190 Hz, observed at the input current I ~ 1.26 nA and 1.03 nA for the CA1 neuron and CA3 neuron, respectively. The maximum frequency for the DG granule cell is approximately 315 Hz, much higher than pyramidal neurons. In addition, the rheobase (i.e., the minimum current amplitude that results in an action potential) value for the DG granule cell is much lower than those for the CA1 and CA3 pyramidal neurons.
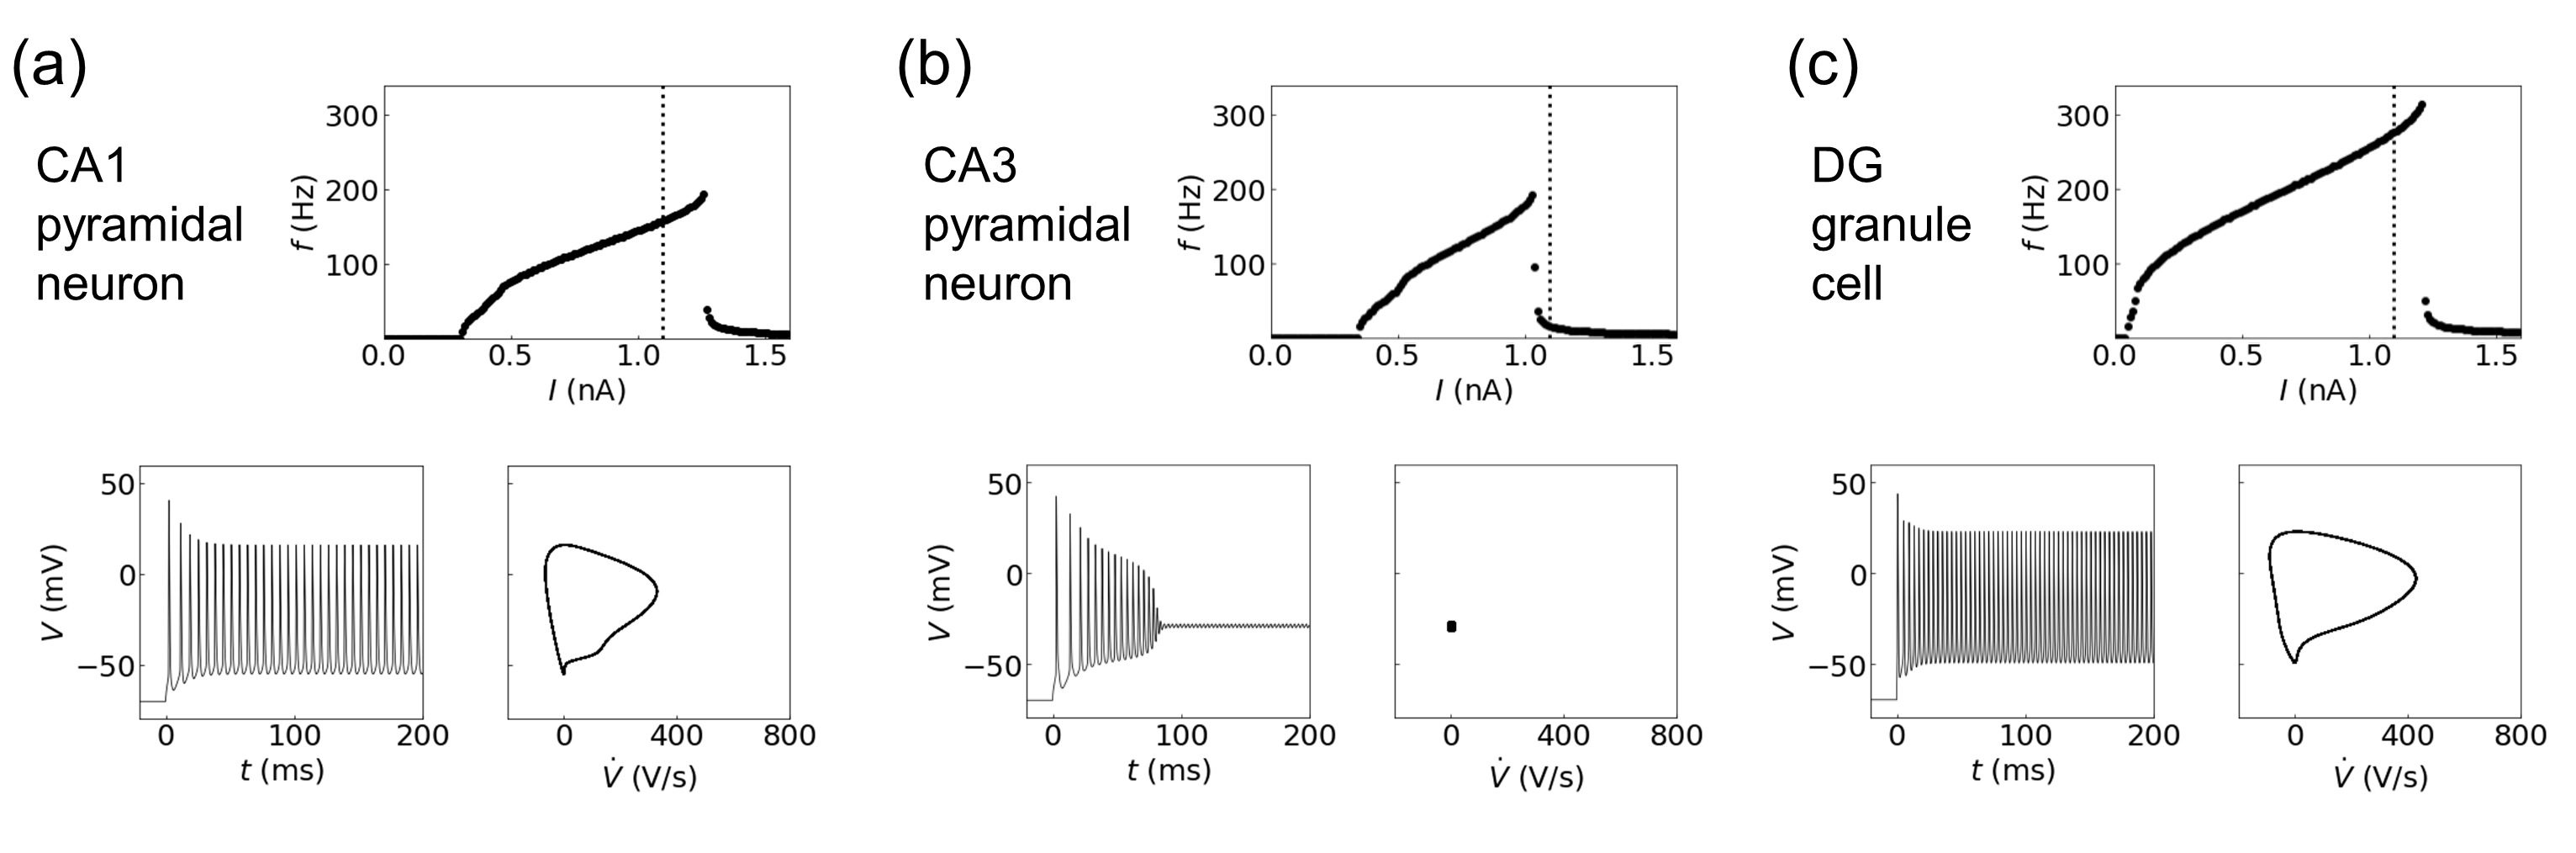 Fig. 4.
Dynamics of three hippocampal neurons: (a) pyramidal neuron in CA1 and (b) pyramidal neuron in CA3, and (c) granule cell in the dentate gyrus. The first row displays the I-f curves, followed by the time evolution of output spike trains (left) and the phase portraits of steady-state dynamics (100–200 ms) on the V˙-V plane (right) in the second row.
Upon the input current I = 1.1 nA (indicated with vertical dotted line), while the CA1 neuron and DG cell show the regular spiking with a frequency of 158 Hz (for CA1 neuron) and 277 Hz (DG cell), the CA3 neuron manifests bistability at the point called the depolarization block—a silent state that occurs in every neuron when it receives excessive excitation [45]. These dynamical changes of the spike train are captured by the phase portrait of membrane potential V and its time derivative V ≡ dV/dt (right panel in the second row of Fig. 4). At I = 1.1 nA, the limit cycle attractors of CA1 neuron and DG cell reflect their regular spiking behaviors with intrinsic frequencies; CA3 neuron is at the point of transition from the regular spiking to the silent state as represented by a fixed point.
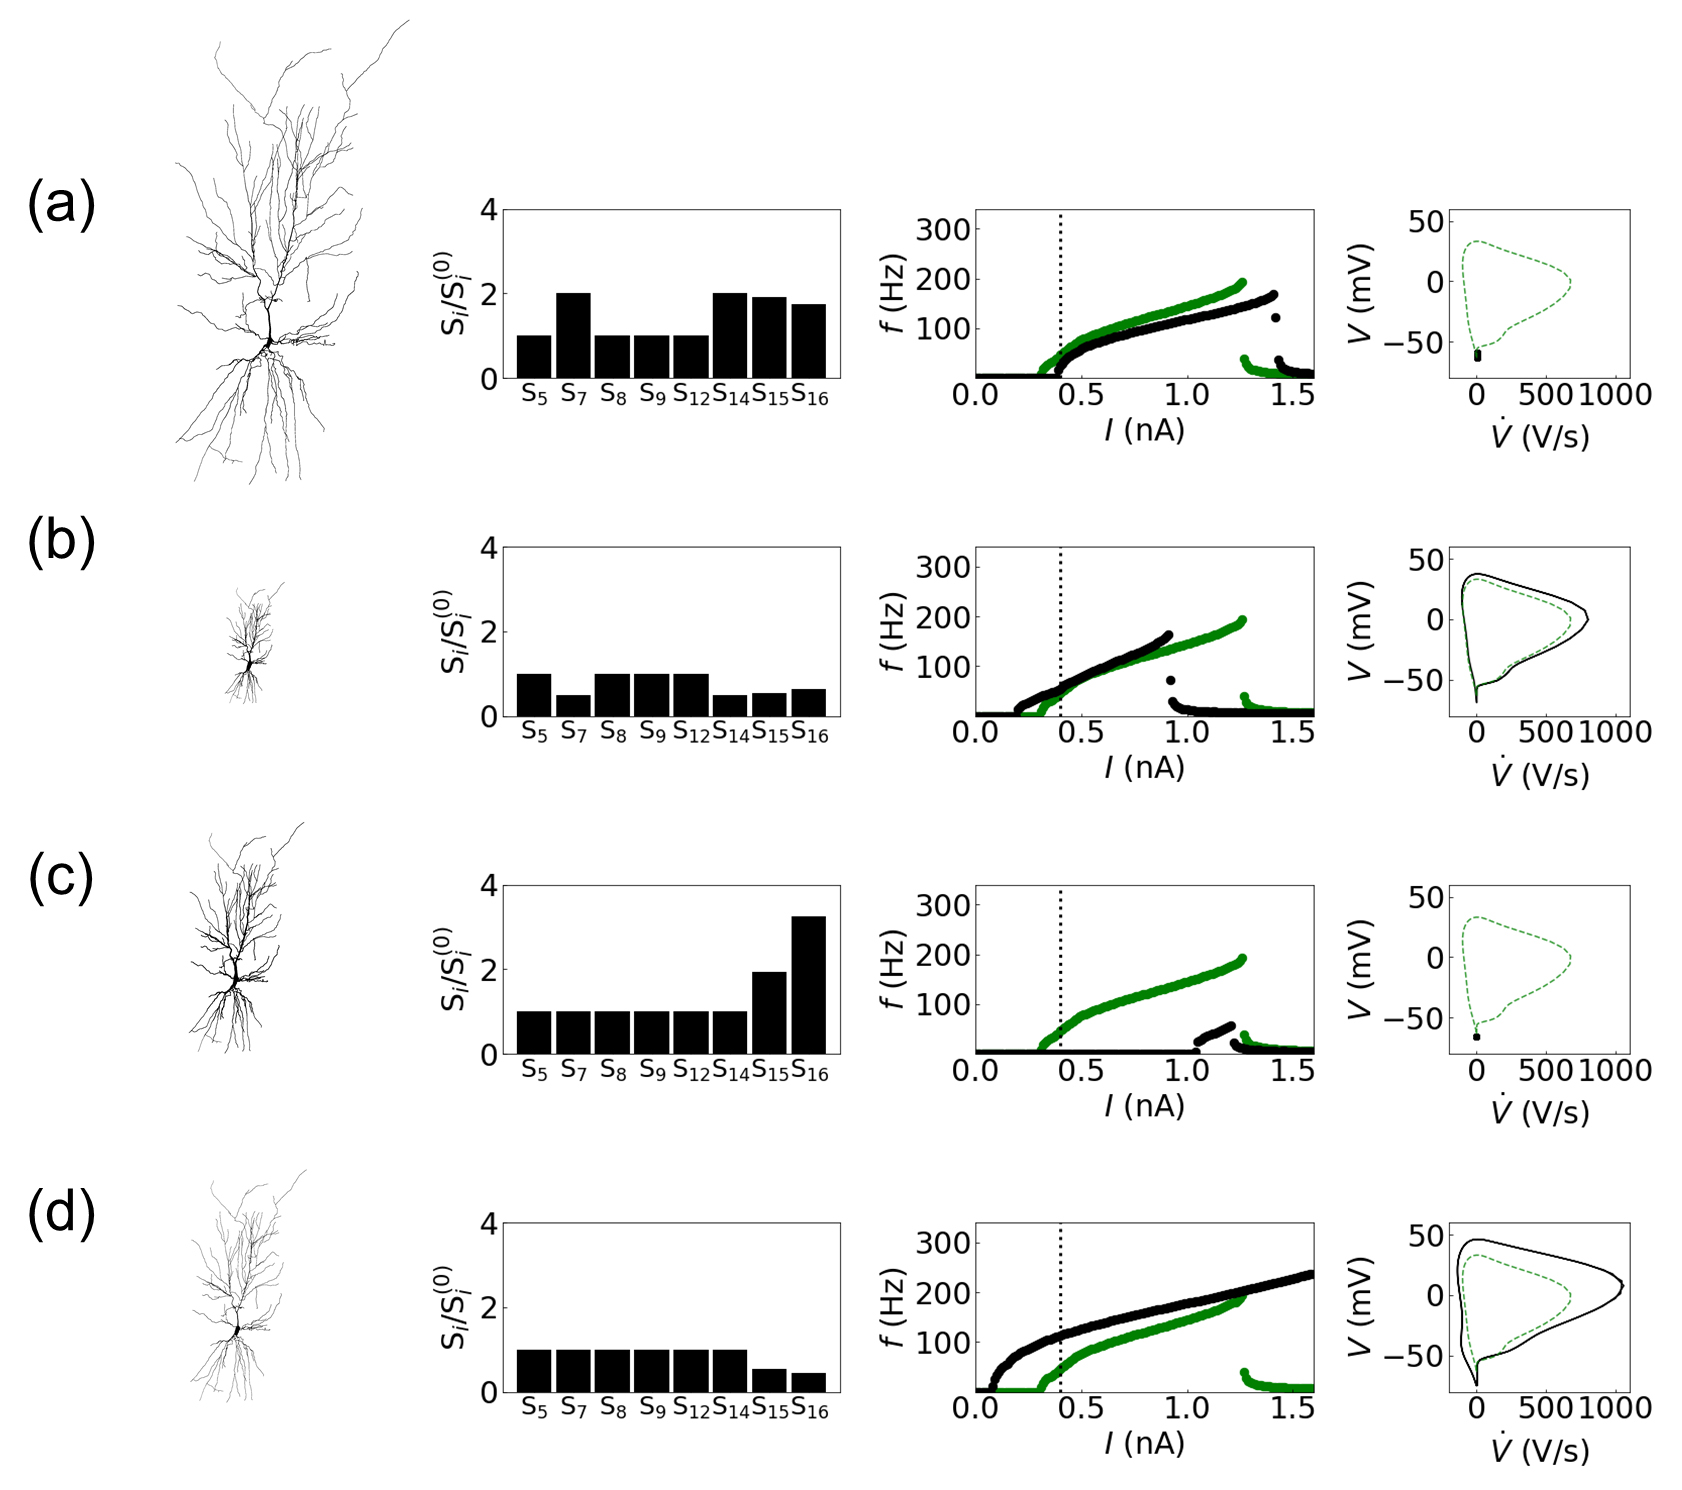 Fig. 5.
Influence of structural changes in the CA1 pyramidal neuron dynamics: (a) 2-fold increase and (b) 0.5-fold decrease in the dendritic length, and (c) 2-fold increase and (d) 0.5-fold decrease in the dendritic diameter. The first column displays the modified model structures, followed by the characterization of modified structures using the primary structural features of the Allen Cell Types Database (the second column) and the I-f curves (the third column). The I-f curves of the original structure and of the modified structure are plotted in green and in black, respectively. The last column exhibits the phase portrait on the V-V˙ plane at I = 0.4 nA. The black solid line/dot and the green dashed line represent the results with and without structural changes, respectively.
Fig. 5 exhibits how structural modifications affect neural dynamics of the CA1
pyramidal neuron. The resulting neural dynamics upon the structural modifications
exhibit reasonable operations. The first column of each row displays the modified
structure, followed by the characterization of the structure using the primary
features (S
When the dendritic lengths are increased by 2-fold from the total basal
dendritic length of 15.76 mm (Fig. 5a), two directly related structural features
‘maximum path distance (S
We now compare the results of varying the dendritic lengths with those from
modifications of the number of dendritic branches. Dendritic branches are added
to make the total dendritic length double (Supplementary Fig. 1a in Supplementary material): a branch (156.07
The detailed dynamics and information processing of the CA1 pyramidal neuron
model are displayed in Fig. 6. The schematic diagram in Fig. 6a illustrates the
information transfer pathway in the neuron. The hidden state triggers a synaptic
input that stimulates the AMPA-type glutamate receptors of a synapse located on a
dendritic spine. The resulting EPSP travels from the dendrite to the soma. The
mutual information I(x; y) quantifies the total
information transmitted from the hidden state to the postsynaptic spike train.
The presynaptic stimulus is provided on a synapse at one of seven equidistant
locations on an apical dendrite branch labeled A–G; the seven locations are 50
 Fig. 6.
Effects of stimulus location on dynamics and information
processing of the CA1 pyramidal neuron. (a) Schematic diagram of information
transfer in the neuron. The path that we focused on the dendritic tree is colored
in red and the locations of the synaptic input (i.e., A to G) are marked with
blue dots. The dynamics of the neuron when the synapse is placed on D is shown on
the right. Synaptic input triggered by the hidden state x is transmitted
through the AMPA-type glutamate receptors on the spine. The stimulation changes
the conductance of the receptors, which in turn evokes the excitatory
postsynaptic potential (EPSP). The EPSP is propagated down from the dendrite to
soma. Mutual information I(x; y) between hidden state
x and spike train y at the soma is quantified. (b) Dependence
of postsynaptic firing rate f on presynaptic firing rate
q
Fig. 6b and 6c display the firing rate and mutual information of the CA1
pyramidal neuron upon varying presynaptic firing rate q
The information processing of the CA1 pyramidal neuron shown in Fig. 6
can be
mapped to AND/OR-like Boolean operations depending on the synaptic location. When
the stimulus is given proximal to the soma (e.g., G), a low q
Based on the single-cell level information, we analyze the information
processing of the direct and indirect hippocampal pathways consisting of CA1,
CA3, and DG cells. This circuit is a computational representation of the
biological two-input system of CA1 [46, 47, 48], where the CA1 pyramidal neuron can
take inputs either directly or indirectly. This circuit is the primary
information processing unit for match/mismatch calculation between what is
encountered and what is expected—this continuous calculation is important for
memory encoding and retrieval in the hippocampus [49, 50, 51]. Hidden state
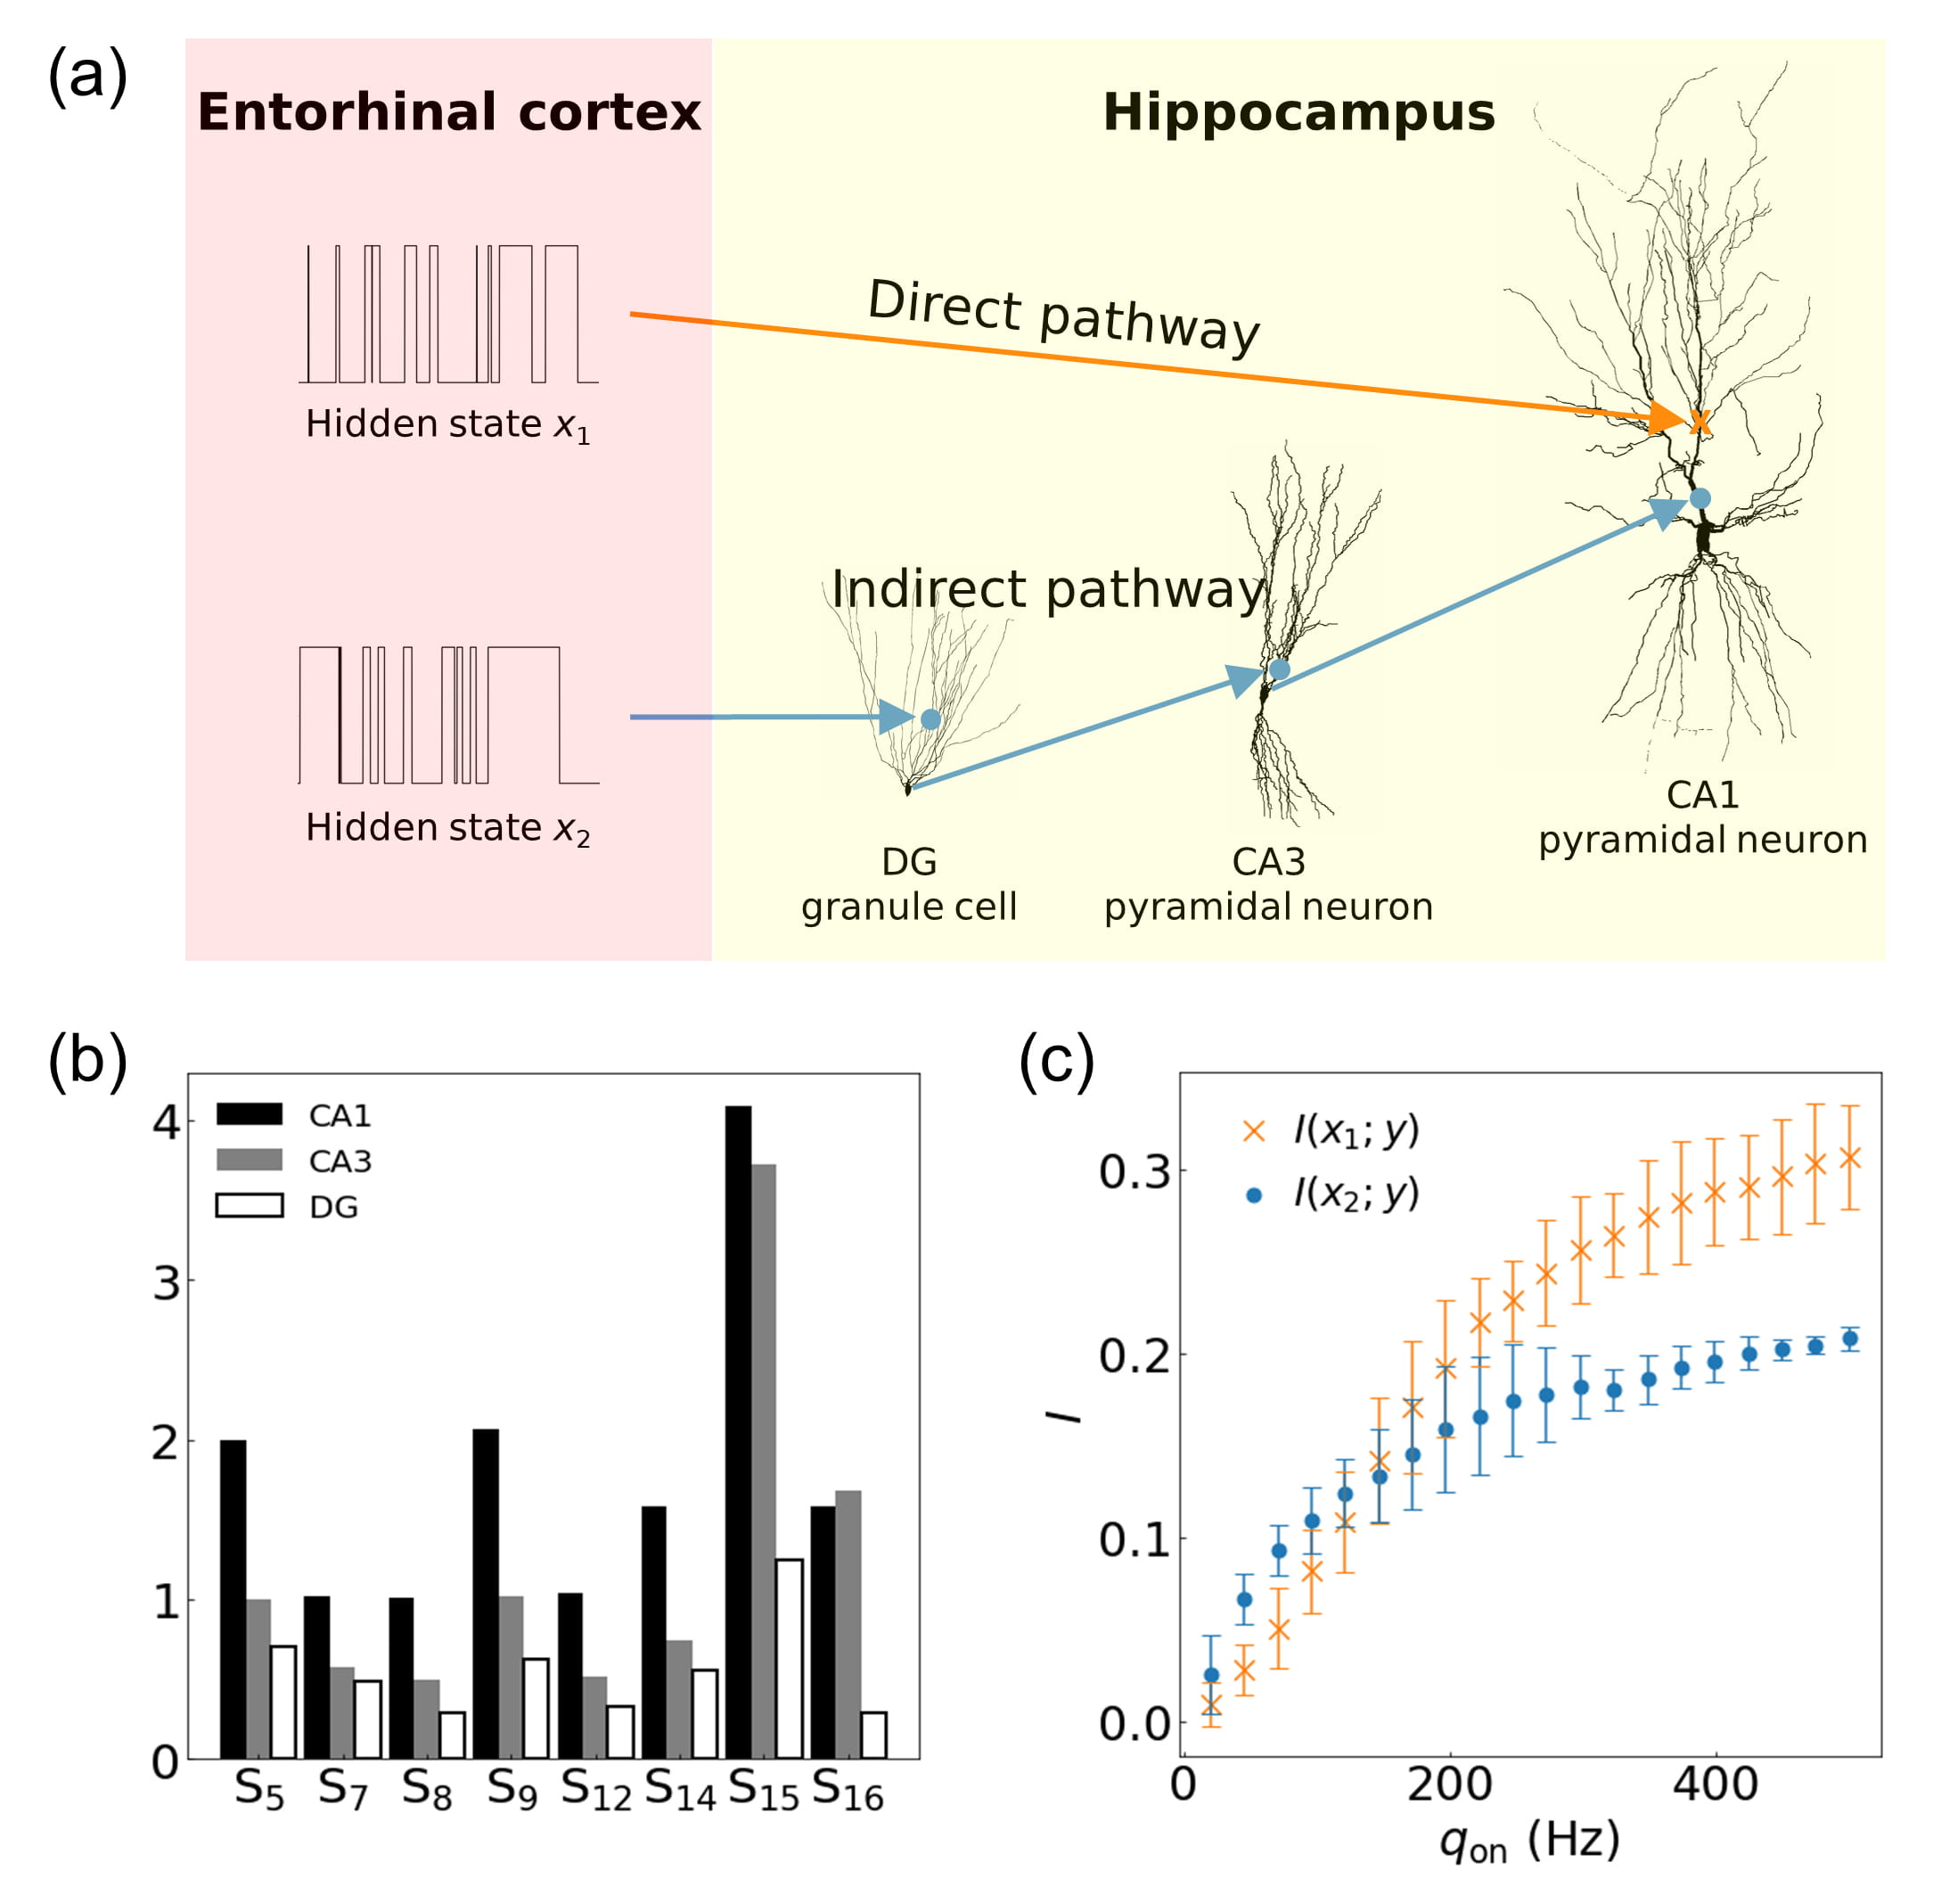 Fig. 7.
Characterizations of the hippocampal direct and indirect
pathways. (a) Schematic diagram of the circuit constructed using pyramidal
neurons in CA1 and CA3, and a granule cell in DG. Two hidden states
x
The structural properties of the three neurons in the circuit are characterized
using the eight primary structural features obtained from the Allen Cell Types
Database (Fig.
7b). Most of the features are the largest for the CA1 pyramidal
neuron and the smallest for the DG granule cell. However, total volume (S
The dynamic ranges of mutual information of the two pathways for the firing rate
are compared in Fig. 7c. Overall, both mutual information increase with the
firing rate: the mutual information of the indirect pathway is higher than that
of the direct pathway under a relatively lower firing rate (i.e.,
q
Variations of information flow upon change of the location of synapses have been
systemically examined. The location of a synapse is varied while keeping the
others at the initial location (Fig. 8)—the dendritic length and dendritic
diameters are fixed, while both the direct and indirect pathways are activated at
the same time (q
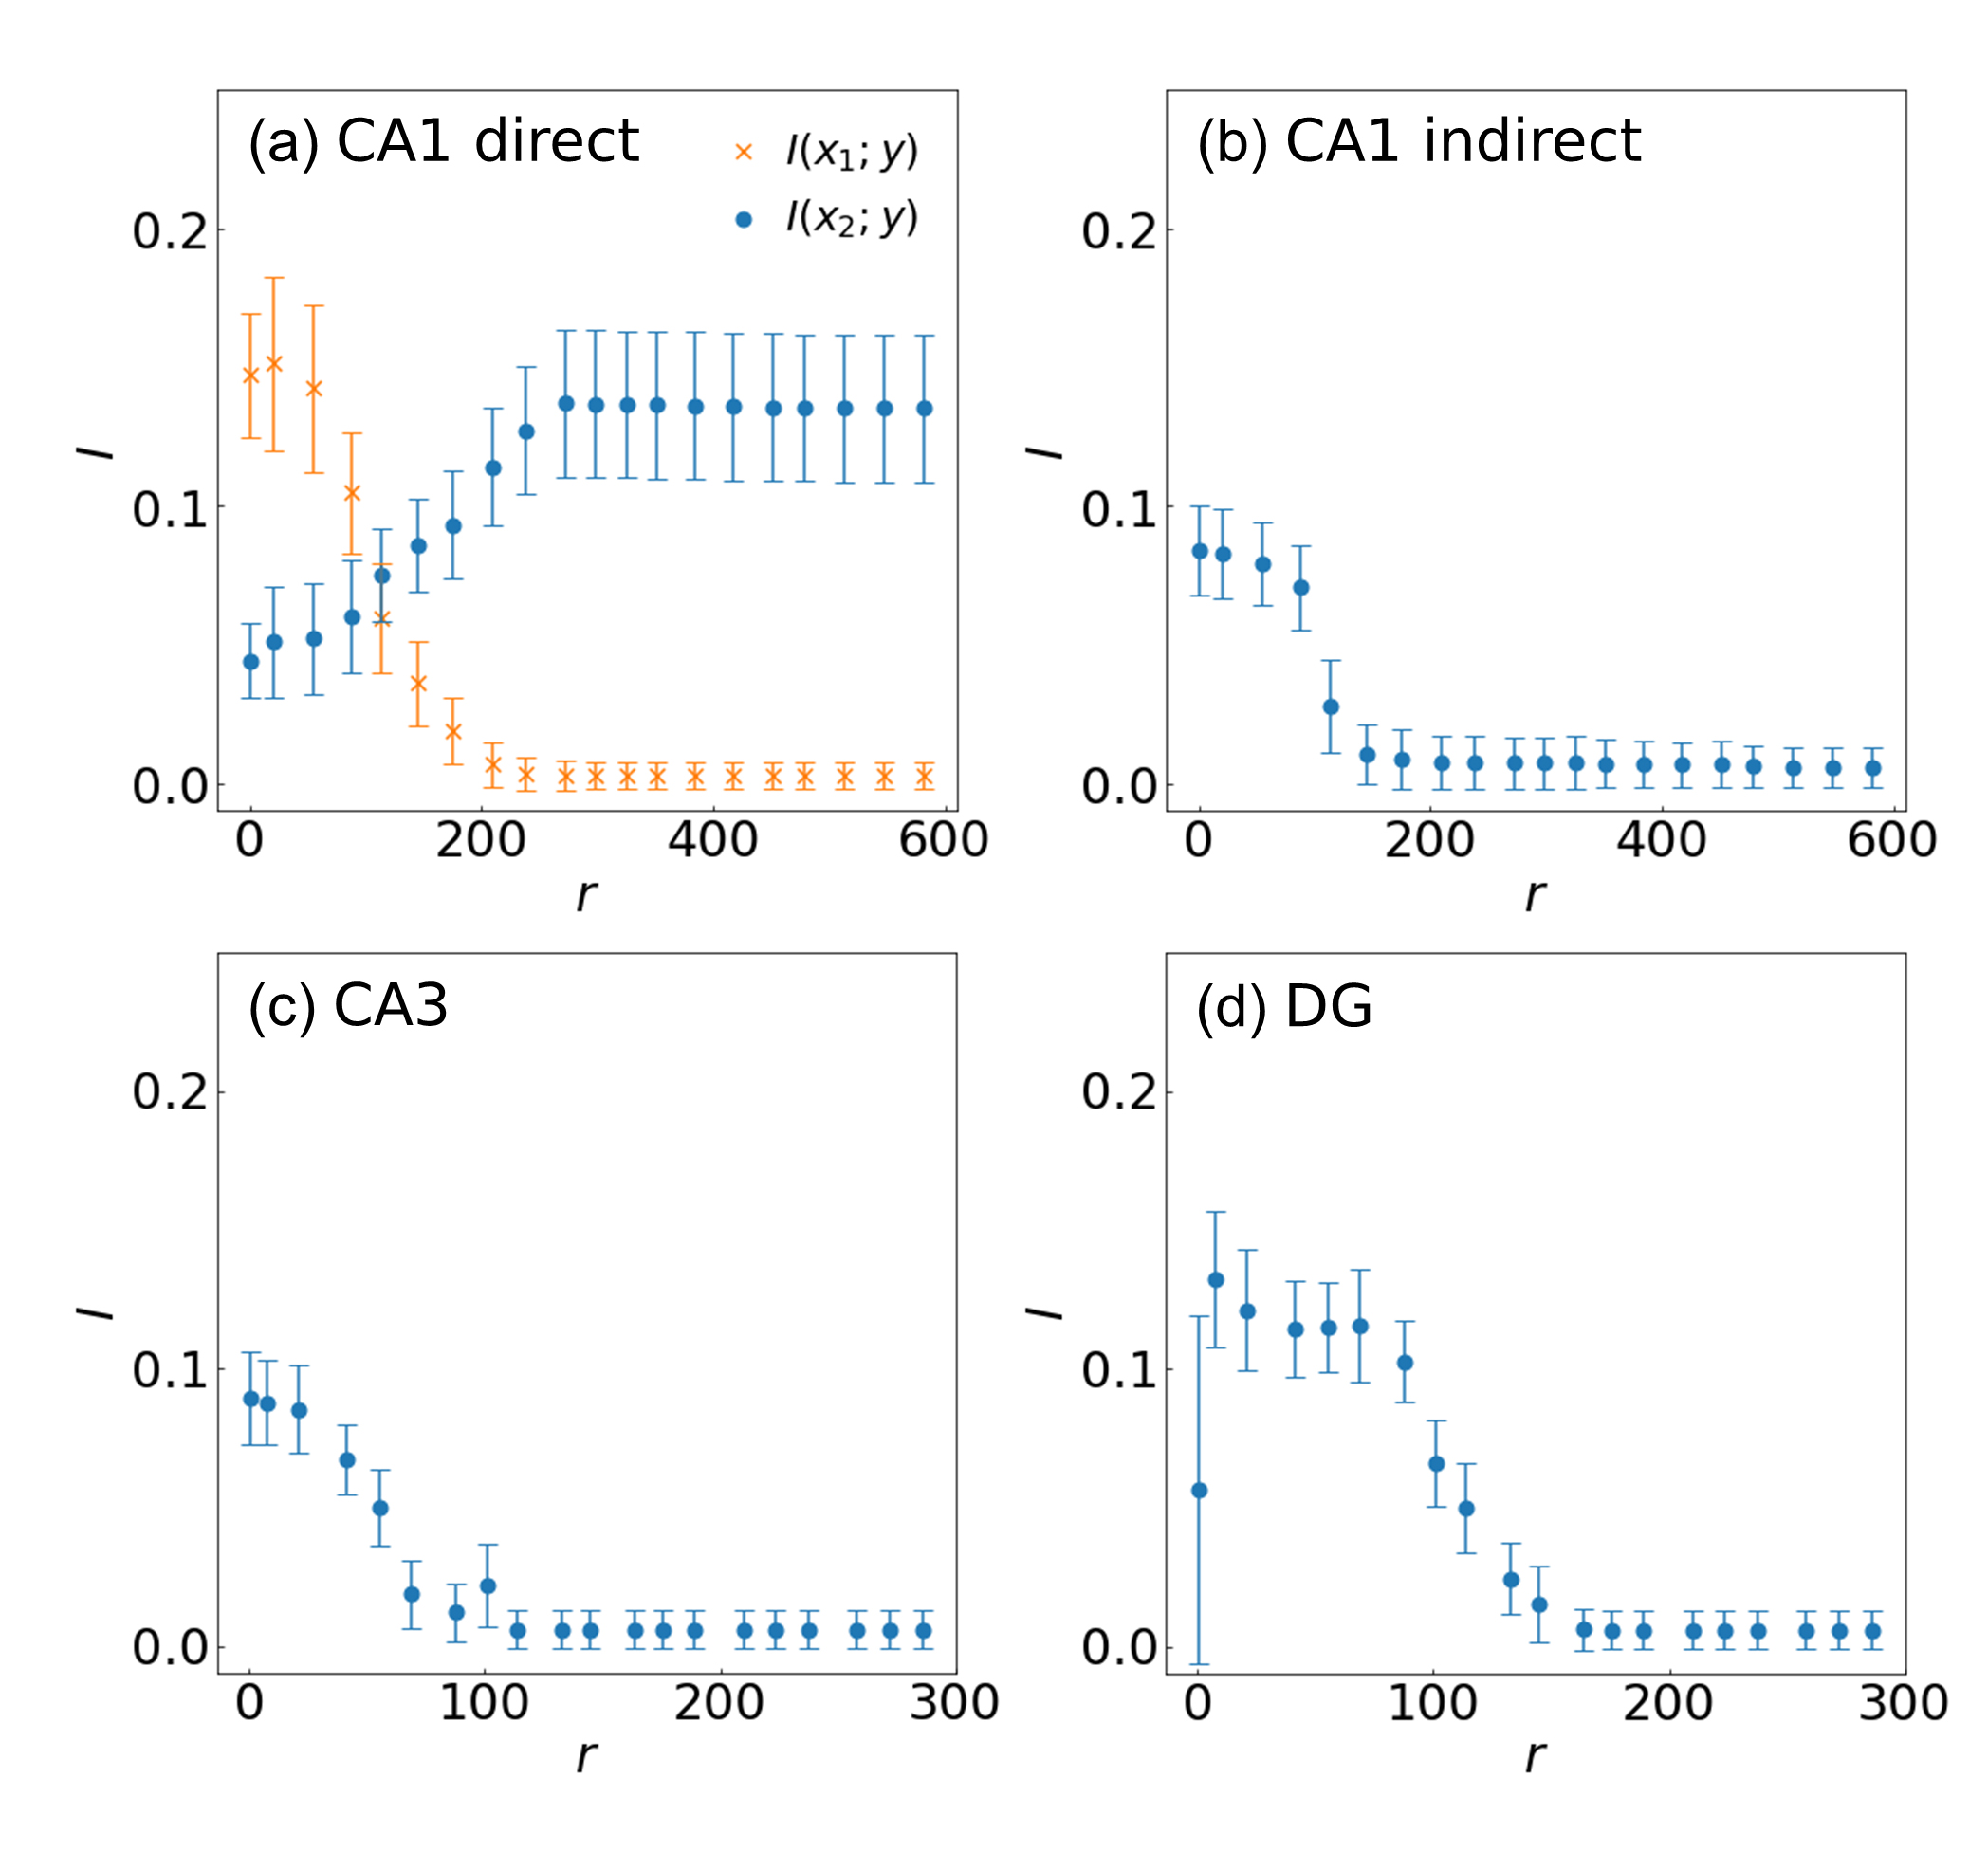 Fig. 8.
Information processing of the hippocampal pathways depending on
the location of synapses in the (a) CA1 pyramidal neuron receiving input from the
direct pathway and (b) indirect pathway, (c) CA3 pyramidal neuron, and (d) DG
granule cell. The coloring and symbols are the same as in Fig. 7. The location
of the synapse is expressed as the path distance r from the soma. Firing
rates q
We then explore how the modification of neuronal structure can control the
information processing of the direct and indirect hippocampal pathways. The
mutual information increases with shorter dendritic length (L) and
smaller dendritic diameter (D) (Fig. 9). Again, the primary structural
features are used for describing these structural modifications. Modifying
L or D has similar structural effects for all three neuron
types. Four structural features, S
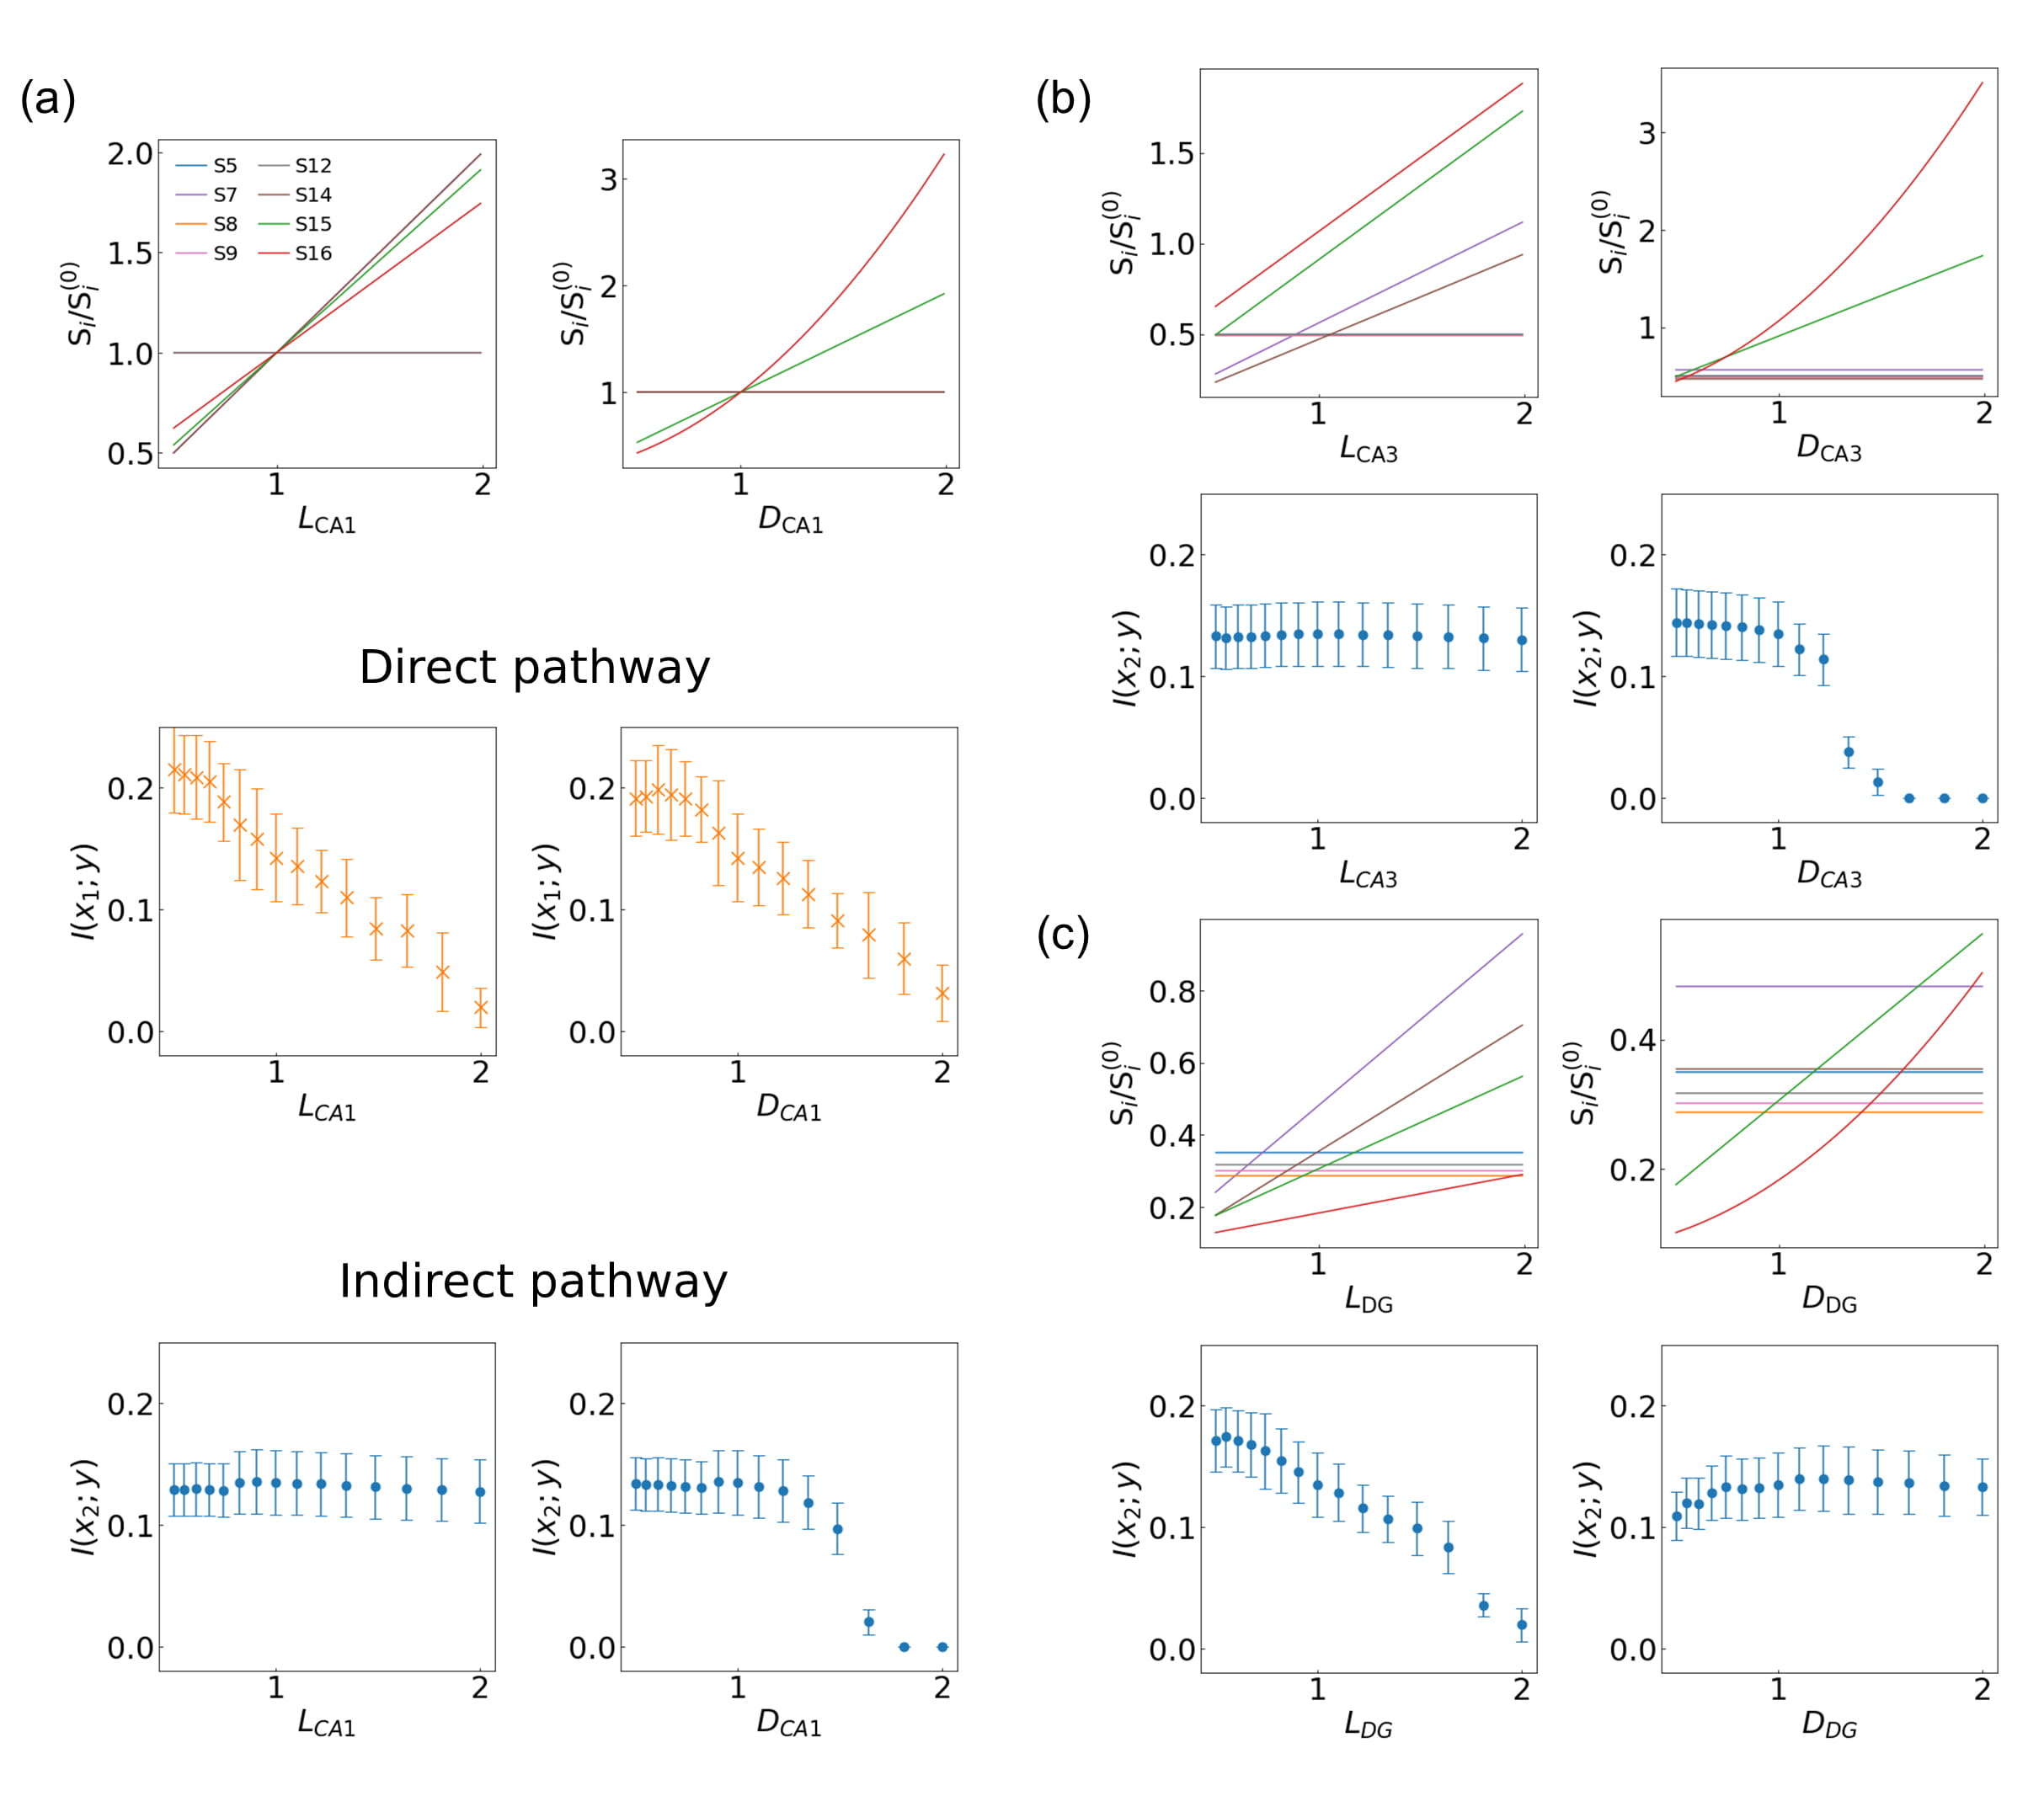 Fig. 9.
Influence of structural changes of the (a) CA1 pyramidal neuron,
(b) CA3 pyramidal neuron, and (c) DG granule cell on the information processing
of direct and indirect hippocampal pathways. Left and right columns indicate the
modification in length L
We notice that the trend is not universal, as certain parts of the circuit have
a very limited impact on controlling the mutual information. This is particularly
recognizable when the indirect pathway is activated. Structural features such as
the dendritic diameter of DG (D
The results under high coherence conditions (i.e.,
This study has investigated the structural aspects of neural dynamics and computations via computer simulations and information-theoretic analysis. Beginning with an exploration of the Allen Cell Types Database [30] to obtain the correlations between structural and electrophysiological features of biological neurons, we have systemically investigated the neuronal dynamics through biophysically realistic multi-compartment mathematical models. The three primary cells in the hippocampus (two pyramidal neurons, one in the CA1 region and the other in the CA3 region, and a granule cell of the dentate gyrus) have been chosen for the computational analysis. These neurons are adequate for characterizing the relationship between neural dynamics and underlying structural mechanisms at both the single-neuron scale and their interactions: the neurons not only have intrinsic dynamical and coding properties rooted in their structures but also contribute to mismatch/match detection via the direct/indirect hippocampal pathways [51, 52, 53, 54]. Although their computational properties have attracted the interest of both theoreticians and experimentalists, detailed dynamics and mechanisms underlying their computational capabilities remain to be clarified. The analysis has been extended with information-theoretic methods to characterize how neuronal structure affects Boolean logic operations at the single-cell level and higher-level computations through the hippocampal pathways.
The Allen Cell Types Database is a large unique dataset containing quantitative
structural and electrophysiological features measured via the standardized
procedure. In the database, structural features (S
It is manifested that the structural differences among the three primary neurons
of the hippocampus lead to large variations in their dynamics. Operation ranges
(i.e., the input current between rheobase and the threshold for the
depolarization block) and maximum frequencies have turned out to differ
significantly, as revealed in the I-f profiles (the first row of Fig. 4). In addition, as exhibited by the phase portraits of the output spike trains,
their intrinsic spiking behaviors vary according to their unique structures. We
have then compared systematically these neurons upon the structural modifications
and probed the link between specific structural features and the dynamical
properties: the branching patterns have been modified by adding or removing small
dendrite branches at bifurcation points, and the dimensions of dendrites have
been altered by increasing/decreasing the dendrite length or diameter (Fig. 5).
As implied by the modified model structures (the first column of Fig. 5) and the
profiles of the structural measures (S
We have also analyzed the more realistic model of a rat neocortical layer 5
pyramidal neuron. The model includes nine ion channels to faithfully reproduce
both perisomatic Na
We have used information theory [57, 58] to examine whether the structural modifications of neurons can influence the intrinsic computational abilities of neurons. Ever since the seminal work of MacKay and McCulloch in 1952 [59] that first quantified the information contained in a spike train, numerous measures based on the classical information theory [57] have been devised to quantify information processing in single neurons and between neurons through synaptic transmission. Among these are mutual information which measures the overlapping information between two quantities (e.g., presynaptic input and postsynaptic output) [58], transfer entropy which measures the directionality of information flow [60, 61], and partial information decomposition which separates the unique, shared, and synergistic contributions of multiple quantities [62]. We have adopted the method originally proposed by Denève and colleagues [39, 40, 41, 42, 43], to measure the mutual information between a hidden state that triggers presynaptic inputs and the postsynaptic output spike trains; this framework provides an ideal means to measure the information processing of a single neuron. Extending this method, we have included two hidden states to characterize the information processing performed by a neuron receiving inputs from two information sources, which provides a tool to study naturally the hippocampal pathways for mismatch/match calculations via the direct/indirect mutual information flows that can be interpreted as the XOR Boolean logic operations [51, 52, 53, 54] (Fig. 9 and Supplementary Fig. 2). It has been demonstrated that structural features greatly influence the information processing and logic operation performed at both the single-neuron (i.e., CA1 pyramidal neuron) level (Fig. 5) and the multi-cellular level (Fig. 9 and Supplementary Fig. 2).
The quantitative information on the relationship between the structure and the
dynamics/computation of neurons may provide a starting point for the in-depth
understanding of the design and coding principles of biological neurons. As we
have presented evidence here, the structural properties of neurons strongly
affect the neural dynamics and information processing—this will eventually
guide the cellular-level mechanisms of neural computations including the
integration of diverse synaptic input patterns [48, 63], complex interactions
among the passive and active dendritic local currents [64], and finally the
interplay between dendrite and soma for determining the action potential output
[8, 65, 66, 67]. While this computational approach aims to unveil structural aspects
of neurons under physiological conditions, the methods can be applied to explore
the pathological changes in neurons. For example, in Alzheimer’s disease neurons
adjacent to amyloid-
AI, artificial intelligence; AIS, axon initial segment; AMPA,
Conceptualization—KH and MYC; modeling and simulations—JHW, KC, SHK, and KH; analysis—JHW, KC, SHK, KH, and MYC; writing—original draft preparation—KH, JHW, and KC; writing—review and editing—KH and MYC; supervision—MYC and KH. All authors have read and agreed to the published version of the manuscript.
Not applicable.
Thanks to all the peer reviewers for their opinions and suggestions.
This research was funded by Korea Institute of Science and Technology (KIST) Institutional Program (Project No. 2E30951, 2Z06588, and 2K02430) and National R&D Program through the National Research Foundation of Korea (NRF) funded by Ministry of Science and ICT (2021M3F3A2A01037808). KC was supported by the KIAS Individual Grants (Grant No. CG077001). MYC acknowledges the support from the NRF through the Basic Science Research Program (Grant No. 2019R1F1A1046285).
The authors declare no conflict of interest.
All neuron models can be downloaded from the website for ModelDB (https://senselab.med.yale.edu/ModelDB/): Vetter et al., accession ID 7907; Hay et al., ID 139653. The codes for calculating structural and electrophysiological features are provided by the Allen Cell Types Database (https://celltypes.brain-map.org/); otherwise they are available from the authors upon request (email to khan@kist.re.kr for KH or mychoi@snu.ac.kr for MYC).