
Highlights: (1) A 3D simulation model of MWA (microwave ablation) based on the temperature-dependent characteristic parameters and blood flow parameters was established to realize the visual simulation of temperature distribution and coagulation zone. The internal forced convection condition was used to accurately characterize the large vessel. (2) The ex vivo MWA experimental platform was built to verify the accuracy of the simulation model. A peristaltic pump was employed for operatively controlling blood circulation and a medical soft plastic tube was introduced for appropriately simulating a blood vessel. (3) The influences of blood flow parameters of large vessels on temperature distribution and coagulation zone were systematically analyzed in order to provide reference and guidance for MWA clinicians. Purpose: Clinical MWA of liver tumor is significantly limited by the accurate prediction of vascular cooling effects. To provide reference and guidance for clinical MWA of liver tumor, the three-dimensional effects of different blood flow parameters of large vessels on MWA temperature distribution were systematically evaluated. Materials and methods: Firstly, the MWA three-dimensional finite element simulation model with blood flow parameters was established. Secondly, to verify the effectiveness of the model, MWA was performed ex vivo in porcine liver for 360 s and the temperature was measured by thermocouples. A medical soft plastic tube was placed parallel to the MWA antenna to simulate a natural liver vessel. Finally, based on this model, the influences of different vessel diameters and vessel-antenna spacings on MWA temperature distribution were analyzed. Results: Sixteen ablations were performed to verify the accuracy of the simulation model. The mean temperature errors between measured data and simulation results at six measurement points were 3.87 ℃. In the first 10 seconds of MWA, the vessel cooling effect on temperature distribution was negligible. When the vessel-antenna spacing was 5 mm and the vessel diameter varied from 3 mm to 6 mm, the temperature at the measured point near the vessel decreased by 2.11 ℃ at 360 s. When the vessel diameter was 6 mm and the vessel-antenna spacing varied from 5 mm to 7 mm, the temperature at the measured point near the vessel reduced by 14.91 ℃ at 360 s. In addition, blood diameter had little influence on the temperature distribution near the heating point. The volume of coagulation zone will not be obviously affected once the vessel lies outside the predicted coagulation zone. Conclusions: The MWA simulation model with blood flow parameters is established. Vessel-antenna spacing is the primary factor affecting the temperature distribution. A vessel with larger diameter can have a more significant effect on the temperature distribution. The large vessel will take away and block part of conduction heat, so the coagulation zone will not be formed on the lateral side of the vessel.
Thermal ablation is an alternative to traditional surgical treatment, radiotherapy, chemotherapy and immunotherapy. It is more and more favored by clinical experts and researchers because of its advantages of less damage to patients and rapid postoperative recovery [1, 2]. Moreover, thermal ablation is very effective for primary and secondary liver tumors [3]. The principle is to achieve the tumor necrosis by heating the tissue [4]. Compared with radiofrequency ablation (RFA) [5], MWA has the advantages of larger coagulation zone, uniform heating, and no need of electrode patch, which has attracted more and more attention [6, 7, 8].
MWA preoperative plan for liver tumor mainly includes the following steps: firstly, the three-dimensional reconstruction is carried out through medical images, and the thermal ablation temperature of tumor is simulated. Finally, the treatment parameters such as heating time, MWA power and needle trajectory are planned. After the operation, medical imaging is used to evaluate the postoperative effects. In the above process, building the real temperature simulation model is the technical challenge in this field [9], and it is also the key to improve the surgical effects.
Huang et al. [10] explored the influences of the blood flow
characteristics of a single vessel and a pair of parallel convection vessels with
the diameter of 1 mm and 2 mm on the coagulation zone when they were orthogonal
or parallel to the antenna. Although convective heat conduction was considered,
the Nusselt number and microstructure parameters were fixed. Also, the
temperature dependences of these parameters were ignored. Vaidya et al.
[11] studied the influences of blood coagulation effect of vessels less than 1 mm
in diameter on the ablation results during MWA. The direction of blood flow in
the 0.4 mm–0.5 mm vessel had the most significant effect on the coagulation
zone. However, the experiments relating to large vessels were not involved. Chen
et al. [12] analyzed the temperature distribution characteristics during
RFA for the heat sink effects of large vessels. Based on the simplified Pennes
bioheat equation, the weighted temperature field was obtained to minimize the
interference caused by microvascular perfusion effect. This study did not
consider the small differences caused by different vascular systems when
simulating the cooling effects of large vessels. Lu et al. [13] used a
Y-shaped copper tube to study the influences of blood flow of bifurcation vessel
and different spacings from microwave antenna on temperature field. The
simulation model of temperature distribution was established by omitting
electromagnetic simulation calculation through measured SAR (specific absorption
rate). The 54
To sum up, there still are few systematic studies on the heat dissipation of large vessels [15, 16] with diameter of 3 mm and above [17, 18]. Previous studies are limited by the accuracy of the simulation model, and mainly focus on the small vessels with diameter less than 2 mm, so cannot meet the clinical needs.
This work aims to study the impact of large vessels on the temperature distribution and the coagulation zone during MWA, particularly focusing on (i) building the MWA temperature simulation model, which includes blood flow characteristics (vessel diameter, blood flow velocity and vessel-antenna spacing); (ii) verifying the accuracy of the simulation model by ex vivo MWA experiments, and finally (iii) analyzing the effects of different blood flow parameters on the temperature distribution and the coagulation zone during MWA. This study can provide an important reference for clinical MWA preoperative planning and improve the quality of surgical ablation.
The experimental system includes a cooled-shaft MWA device (KY-2000; Kangyou Microwave Energy Sources Institute, Nanjing, China), a microwave antenna, metallic thermometers (YWY-2, Kangyou Microwave Energy Sources Institute, Nanjing, China), ex vivo porcine livers, a peristaltic pump for blood circulation (S100(300)-2B+mYZ15; Baoding Ditron Technology Co., Ltd., Baoding, China), a medical soft plastic tube for simulating a blood vessel (Fig. 1).
 Fig. 1.
Ex vivo experiment platform for microwave ablation.
The MWA device equipped with thermometers can display the temperature changes in
real time and save the collected temperature data automatically. The water-cooled
antenna used in the MWA experiments works at 2450-MHz. The diameter of the
thermometer is 1 mm and the length is 120 mm. The effective measurement point is
located at the tip of the thermometer, and the measurement accuracy is 0.1
Fresh porcine liver was used to replace human liver tumor tissue. Purified water
was used to replace blood. The experiment was performed at 15
Since the three-dimensional effects of blood flow parameters on temperature distribution cannot be obtained by MWA ex vivo experiments, a 3D simulation model was established by COMSOL software (version.5.5; COMSOL Inc, Stockholm, Sweden) to evaluate the cooling effects of blood vessels systematically. Firstly, a cylindrical liver tumor model with a radius of 50 mm and a height of 100 mm was constructed (Fig. 2). A microwave antenna was inserted longitudinally at the center of the bottom circle, and a cylindrical tube parallel to the MWA antenna was included as a blood vessel. In this model, the vessel radius and the vessel-antenna spacing can be adjusted appropriately. After the geometric model was built, the automatic meshing method was used to mesh the model. It took about 30 min to solve once.
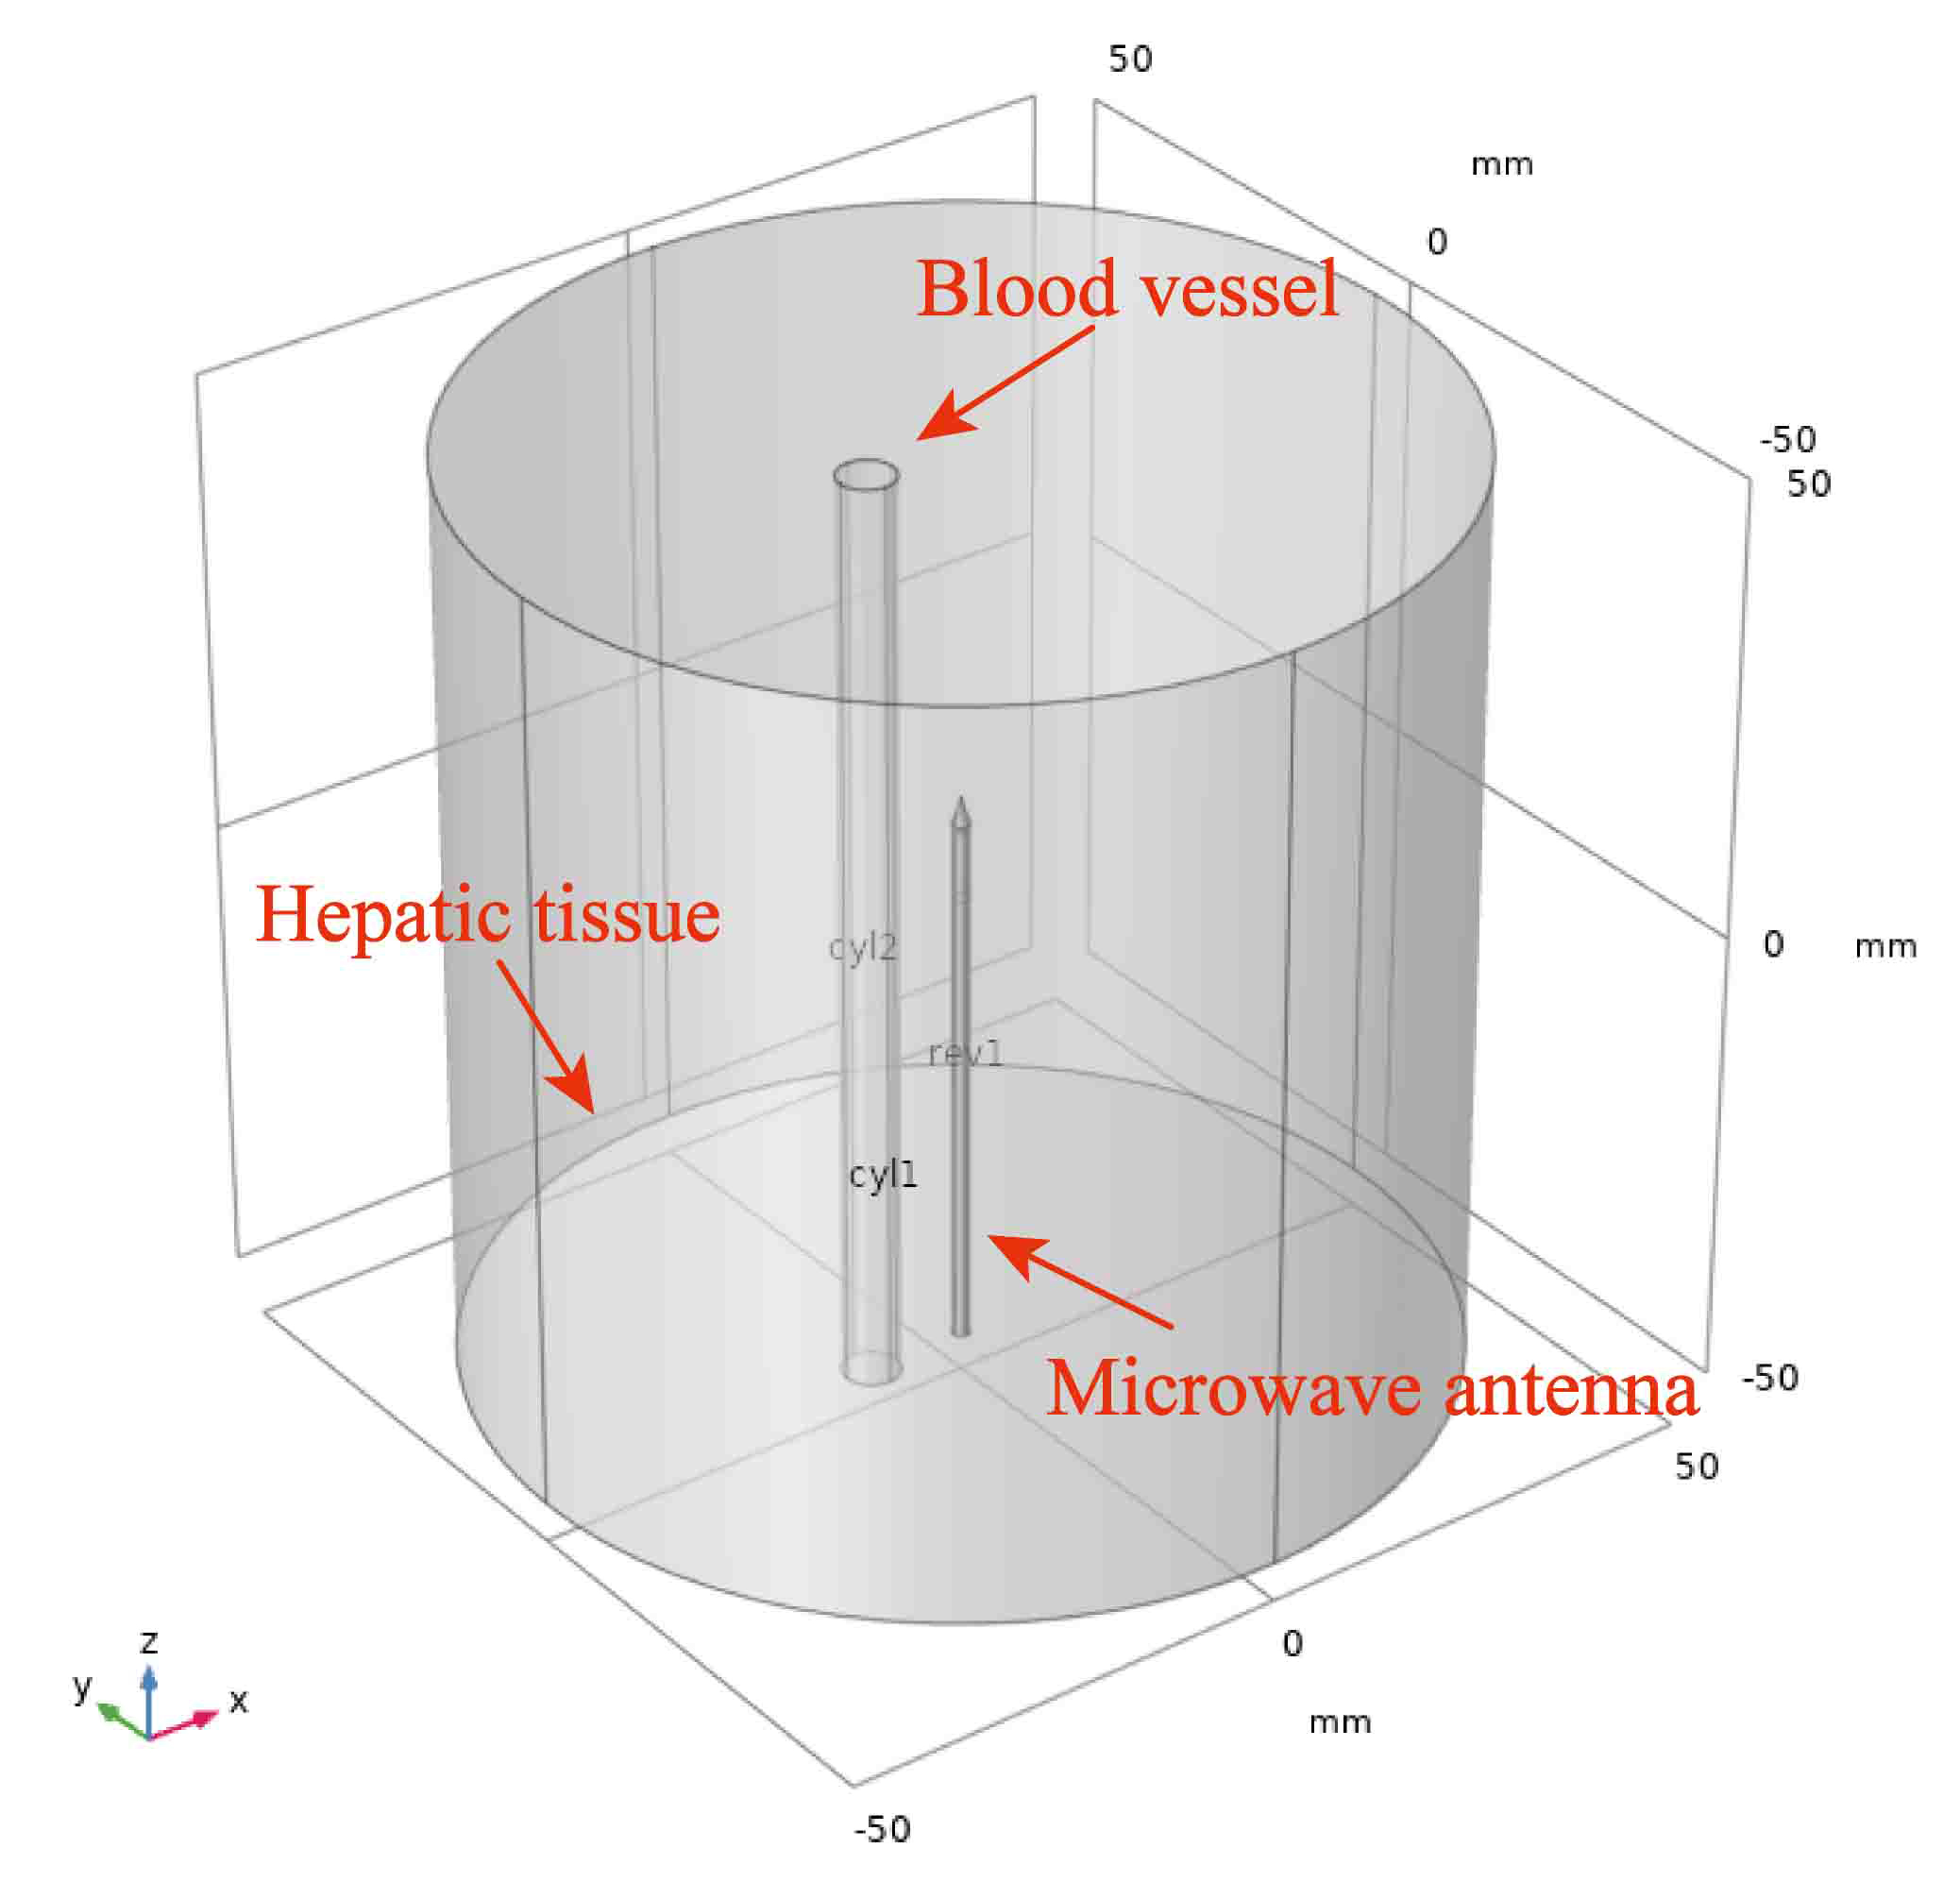 Fig. 2.
Geometric model of MWA simulation.
The MWA finite element simulation model was solved by the coupling of electromagnetic field and bioheat field. The classical Pennes bioheat equation was used to solve the bioheat problem in COMSOL [19] because of its simplicity and convenience. The expression of the equation is as follows:
where
In order to characterize the heat transfer between blood vessel and tissue, the internal forced convection heat transfer condition was set in COMSOL to simulate the influences of large vessels on the temperature distribution and coagulation zone [20]. The heat transfer between blood vessel and tissue can be described by Newton formula [21]:
where
where
where Re is Reynolds number, and
The values of characteristic parameters of ex vivo porcine liver at 25
| Tissue | |||||
| porcine liver | 1050 | 3628 | 0.565 | 1.8 | 44.3 |
The specific heat capacity function based on the change of water content is as follows [26, 27, 28]:
where
Based on references [28, 29, 30], the expressions of relative permittivity
conductivity
Denaturation will occur in a short time when the liver tissue is between 50
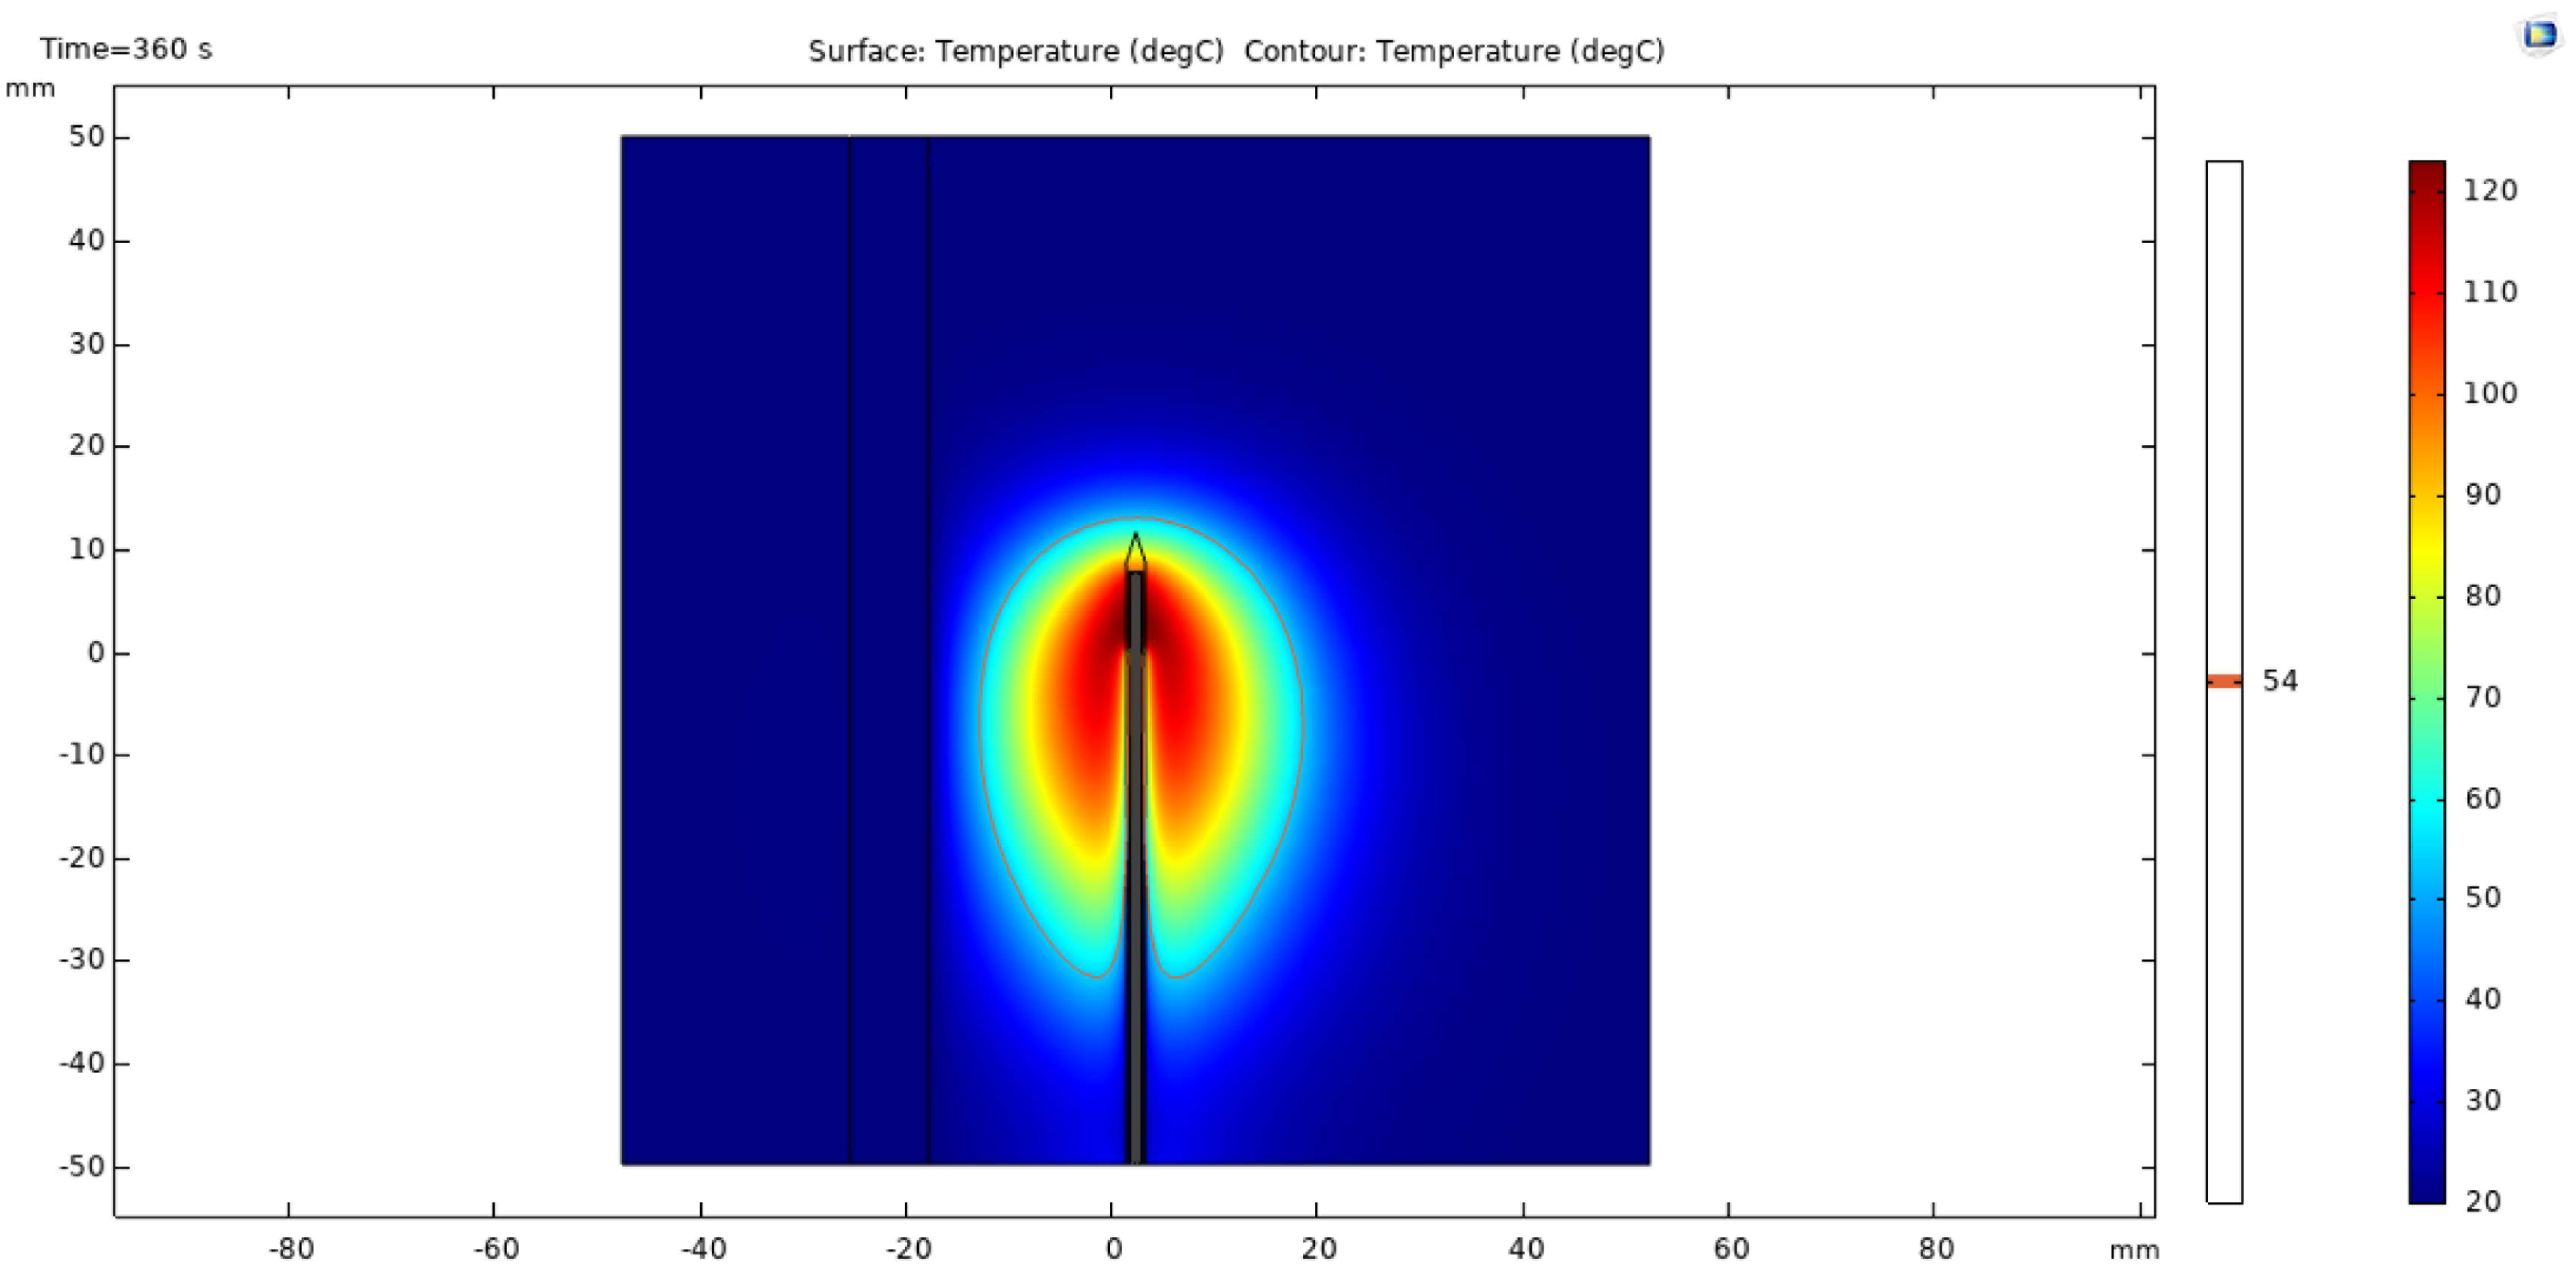 Fig. 3.
Schematic diagram of 54
In MWA experiments, an acrylic mold with 12 cm long, 5 cm wide and 4.5 cm high
was designed to house porcine liver. The microwave antenna was placed in the
center of porcine liver tissue, and a medical soft plastic tube with a diameter
of 6 mm was inserted 10 mm away from the antenna as a simulated large blood
vessel. Six temperature measuring points (CH
In order to further verify the consistency between the simulation results and the MWA data ex vivo, the size of coagulation zone was measured. After the thermal ablation experiments, the porcine liver was cut horizontally along the microwave antenna, and the shape and area of the coagulation zone were observed and measured.
Blood vessels with diameter less than 3 mm or even less than 1 mm have been deeply studied [10, 11]. During MWA, small blood vessels close to the antenna are prone to blood coagulation, which may damage the vessel wall. For vessels with larger diameter, the blood will cool and protect the large vessels from heating damage. In this case, the temperature distribution of MWA needs to be further explored.
Therefore, this study focuses on the influences of vessels with diameters of 3
mm and 6 mm on the temperature distribution during MWA. The vessel-antenna
spacing starts from 5 mm and increases by 2 mm each time. Six assessment points
(P
Eleven groups of effective data were collected from CH
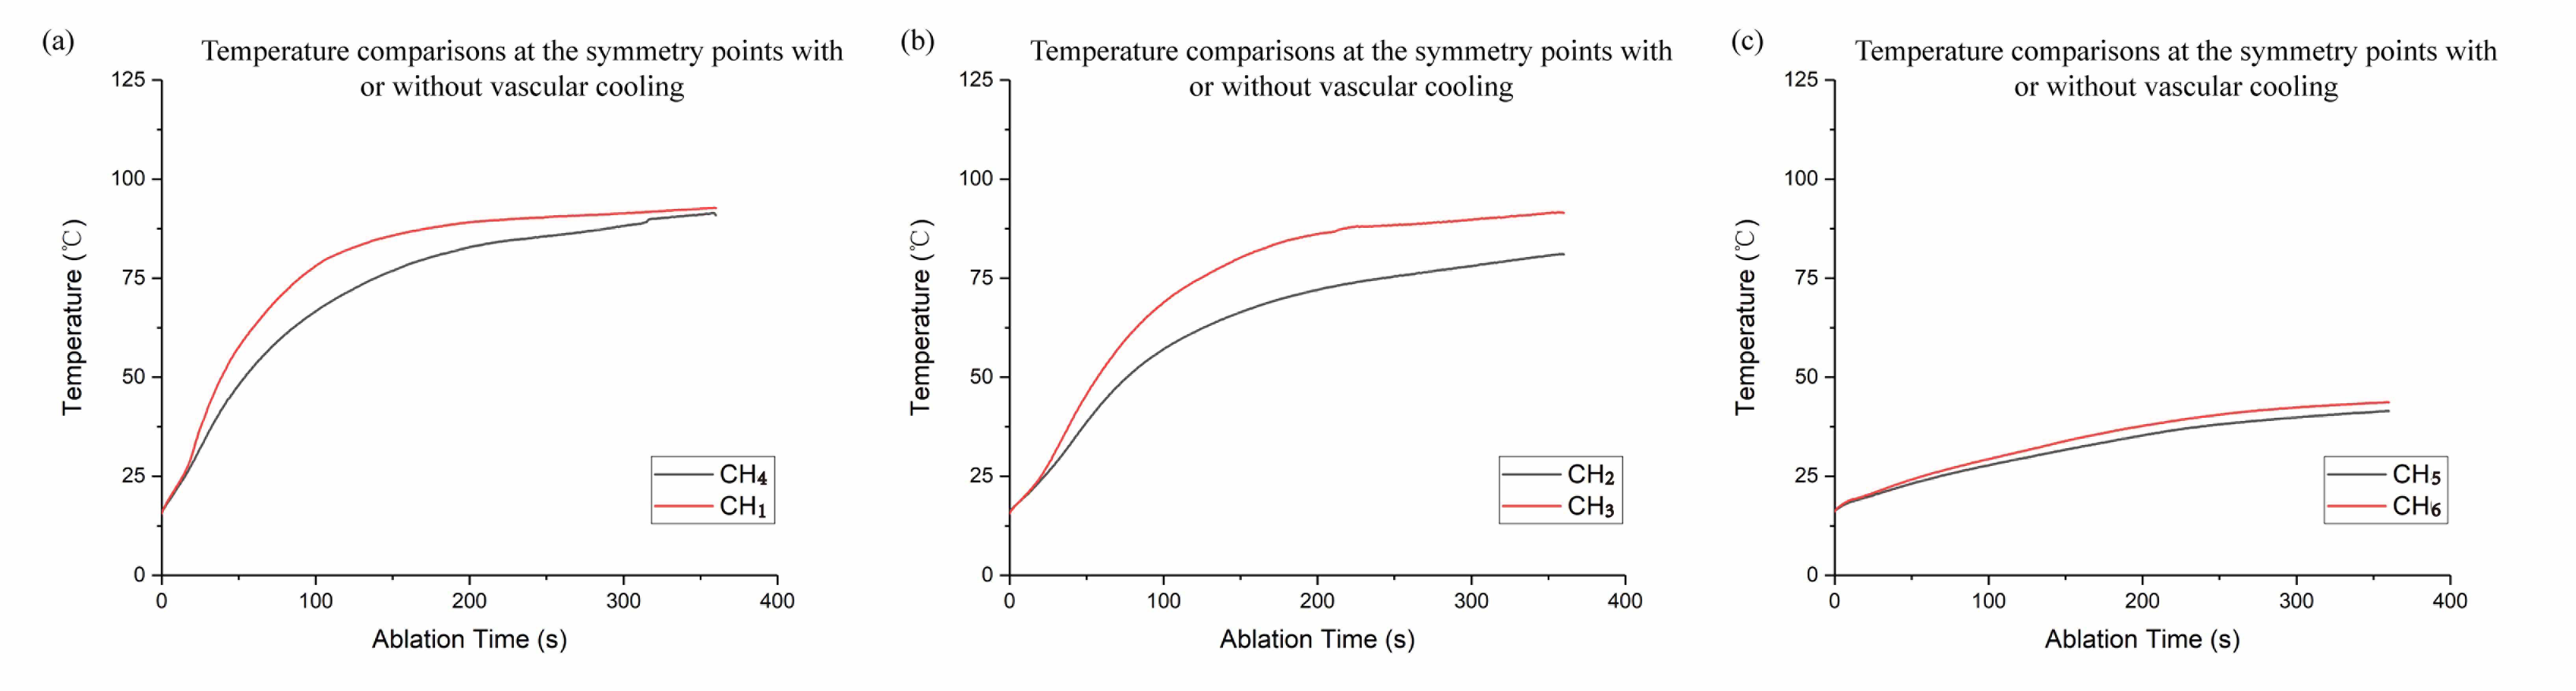 Fig. 4.
Temperature comparisons at the symmetry points. The gray and red curves represent the temperature changes at the temperature measuring points with and without vascular cooling, respectively. (a) shows temperature comparisons at CH4 and CH1, (b) shows temperature comparisons at CH2 and CH3, and (c) shows temperature comparisons at CH5 and CH6.
CH
CH
The mean temperature of the same measurement point was taken as the result of ex vivo experiment, and the result was compared with simulation data to verify the effectiveness of the simulation model (Fig. 5).
 Fig. 5.
Comparisons between thermal ablation data and simulation results at (a) the measurement point CH1, (b) the measurement point CH2, (c) the measurement point CH3, (d) the measurement point CH4, (e) the measurement point CH5, (f) the measurement point CH6.
The measured data and simulation data of each measurement point had
substantially the same temperature rising trends. The mean errors between the
experimental and simulated temperatures at CH
After microwave ablation, the porcine liver tissues were cut horizontally along the antenna insertion direction, as shown in Fig. 6. It can be clearly seen that the coagulation zone includes carbonization zone, coagulation zone and ablation transition zone [31]. The black area is the carbonization zone, the gray area is the coagulation zone, and the outermost light red area is the ablation transition zone.
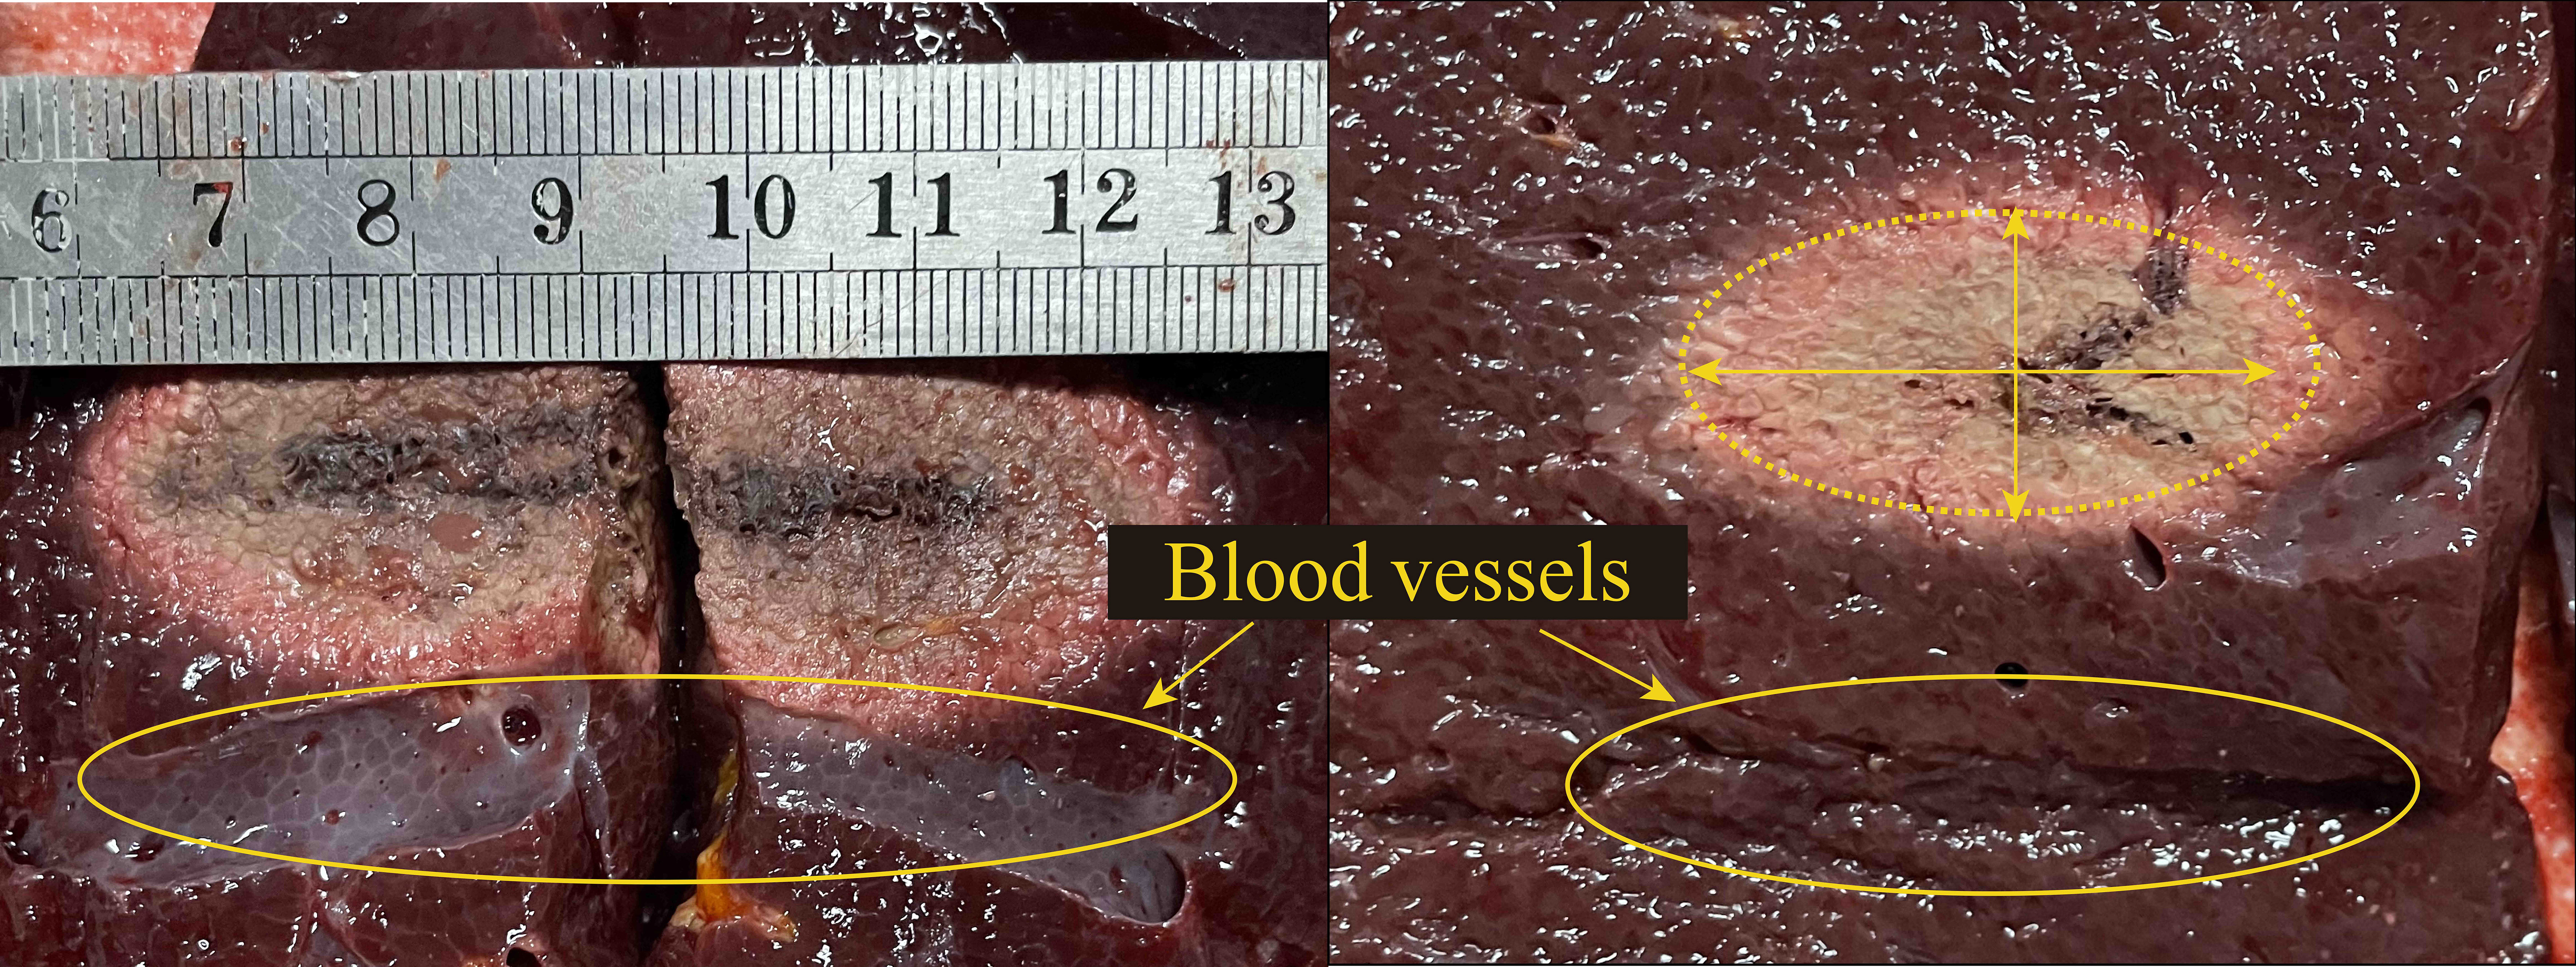 Fig. 6.
Profile of coagulation zone of porcine liver after MWA (the diameter of blood vessels was 6 mm, the antenna-vessel spacing was 10 mm). Abbreviation: MWA, microwave ablation.
The results showed that the coagulation zone on the blood cooling side was smaller than that on the other side. The sizes of the coagulation zones of ex vivo experiments and simulations are shown in Table 2. The long axis error was 1.8 mm and the short axis error was –1.4 mm, which can further verify the effectiveness of the simulation model.
| Group 1 | Group 2 | Group 3 | Group 4 | Group 5 | Mean | Simulation | Error | |
| Long axis | 40 | 40 | 42 | 42 | 40 | 40.8 | 39 | 1.8 |
| Short axis | 17 | 18 | 23 | 22 | 23 | 20.6 | 22 | –1.4 |
It can be seen from Fig. 7 that the changes of vessel diameter and
vessel-antenna spacing will affect the temperature distribution of MWA. Under the
condition of only changing the spacing (from 5 mm to 7 mm), the temperature at
360 s of P
 Fig. 7.
Simulation temperature profiles of vessels with diameters of 3 mm and 6 mm at spacings of 5 mm and 17 mm (d stands for the vessel diameter, D stands for the vessel-antenna spacing and the blood flow rate was 2.0 m/s). (a) and (b) had the same vessel-antenna spacing of 17 mm, and the vessel diameter in (a) and (b) was 3 mm and 6 mm, respectively. (c) and (d) had the same vessel-antenna spacing of 5 mm, and the vessel diameter in (c) and (d) was 3 mm and 6 mm, respectively.
By changing the vessel diameter and the vessel-antenna spacing, the temperature varied obviously and different volume of coagulation zone was obtained. However, no coagulation zone was observed on the lateral side of the vessel (Fig. 7) in all cases.
When the ablation time is less than 10 s, the microwave energy deposition plays a dominant role [34]. Paired T-test was carried out on the temperature data of the first 10 seconds under different blood flow conditions. The results showed that all the P values were greater than 0.05, so there was no significant difference. Therefore, the cooling effects of large vessel could be ignored in the first 10 seconds of MWA, which was capable to simplify treatment planning of some short MWA procedures. As the ablation time elapsed, the temperature differences under different blood flow conditions began to increase, until the end of the ablation (at 360 s), the differences reached the maximum (Tables 3,4).
| P |
P |
P | |
| Mean temperature difference during first 10 s | 0.49 [0.16–0.82] | 1.07 [0.80–1.34] | 0.06 [0.02–0.10] |
| Temperature difference at 360 s | 14.91 | 3.83 | 5.23 |
| *95% CI denotes Confidence interval at 95% confidence level. | |||
| P |
P |
P | |
| Mean temperature difference during first 10 s | 0.69 [0.52–0.87] | 0.27 [0.10–0.44] | 0.21 [0.10–0.44] |
| Temperature difference at 360 s | 2.11 | 1.02 | 1.32 |
| *95% CI denotes Confidence interval at 95% confidence level. | |||
Fig. 8 shows the influences of blood flow parameters on the coagulation zone.
The coagulation volume after 360 s MWA were 26410 mm
 Fig. 8.
Variation of coagulation volume with time (S
In order to further learn the significant influences of vessel-antenna spacing on coagulation zone, the vessel-antenna spacing was continually changed. Several different distances (D = 5 mm, D = 17 mm, D = 18 mm, D = 20 mm) were selected for simulation, where the vessel diameter was 3 mm, and the blood flow rate was 0.2 m/s. It was found that when the distance between the vessel and the antenna exceeds the predicted length of the short half axis (about 17 mm), the influences of the vessel on the coagulation zone volume are limited (0.7%, 1.2%, 1.7%). Therefore, in MWA, it was believed that if the blood vessel was located outside the simulation coagulation zone, the coagulation zone could hardly be affected by the vessel. Thus, the changes of the characteristic length and the coagulation zone shape could be ignored. This is mainly due to MWA is not sensitive to heat-sink effect compared with RFA [35].
With the development of tumor thermal ablation technology, some methods are possible to detect the ablation temperature. CT (computed tomography) [36], US (ultrasound) [37, 38], HIFU (high intensity focused ultrasound) [39] and MRI (magnetic resonance imaging) [40] are employed alone or in combination to monitor the ablation procedure noninvasively. Based on attenuation values from noninvasive CT Thermography, tissue temperature can be accurately predicted during thermoablation [36]. A major challenge of US noninvasive monitoring is to separate the apparent displacement caused by thermal effect from the real tissue motion independent of heating [37]. In addition, US noninvasive monitoring is easily affected by motion artifacts [38]. MRI can quantify the temperature by using a temperature sensitive MR contrast agent [40], but the process is expensive and cumbersome. These methods rely largely on the quality of intraoperative and postoperative images.For the thermal ablation of the tumor near large vessels, not only accurate monitoring, but also preoperative simulation is needed to ensure the operation effects. The previous studies [10, 11] on small vessels (diameter less than 3 mm) cannot meet the clinical MWA requirements. Therefore, a 3D temperature simulation model based on the flow characteristics of large vessels was established. The model can accurately simulate an ex vivo setting, directly present the volume and shape of coagulation zone, and quickly calculate MWA temperature distribution. The creation of this model is a good base to improve the clinical applications of MWA.
The FEM simulation results have been proved to be in good agreement with the
ex vivo experiment. However, in ex vivo experiments, the
temperature of the water pumped through the simulated blood vessel was 15
Through the finite element simulation, the influences of blood (d
This study systematically analyzes the influences of single large vessel around
tumor on microwave temperature distribution. It was observed that the cooling
effects were obvious on the side of large vessels. Compared with the opposite
side without the blood vessels, the temperature rise rate of this side was
slower, and the temperature of tissue during MWA was also lower. In the early
stage of MWA, there were no significant temperature differences under different
blood flow conditions. As the ablation time went on, obvious temperature
differences appeared. At the end of ablation, the temperature differences reached
the maximum. For the temperature measurement point close to the large vessel
(such as P
In addition, the results show that the vessel-antenna spacing possesses a greater influence on the temperature distribution than the vessel diameter. On the other hand, the presence of a vessel with larger diameter and smaller vessel-antenna spacing will make the volume of the coagulation zone significantly decrease. However, the vessel-antenna spacing greater than the short half-axis of the predicted coagulation zone will not contribute to the considerable changes of the coagulation zone (the average change is only 1.2%). In RFA, the electrical conductivity change caused by vessel cooling effect will increase the coagulation zone [35]. However, MWA is not sensitive to the heat-sink effect. Once the big vessel does not overlap with the predicted coagulation zone, it will hardly have an obvious impact on the simulation results. In a further investigation on the coagulation zone characterization, if the vessel-antenna spacing exceeds the short half axis of the coagulation zone, the characteristic length growth model [41] can be used to characterize coagulation zone. Otherwise, it is necessary to derive vessel influence factor based on vessel contributions. This factor in combination with the characteristic length growth model may be used to characterize the coagulation zone. In this way, more accurate model of the coagulation zone can be provided for clinicians.
One of the disadvantages of this study is that because the porcine liver tissue
is very elastic, it is hard to accurately place the thermocouples. Secondly,
porcine livers are histologically different from human livers in that they have
more connective tissue, which might influence MWA temperature distribution.
According to Vaidya [11], directional effects on the coagulation zone were found
to occur for blood vessel radii between 0.4 mm and 0.5 mm. Huang [10] found that,
the directional effect occur for small blood vessels (irrespective of flow rate)
or large vessels with low flow rate. Because this study focuses on the normal
blood flow rate of human body, the direction and velocity of blood flow in large
vessels are not considered. In the simulation process, in order to simulate the
cooling effects of large vessels ex vivo experiment, the convection heat
transfer equation was used to describe the cooling effects of blood heating on
tissue. In order to further improve the accuracy of simulation, the setting of
convection heat transfer coefficient needs further studied. In addition,
ex vivo experiments are limited in their expressiveness compared to in
vivo approaches. In a further investigation, the ex vivo liver and
simulated blood can be left at 37
A temperature simulation model on MWA was established by appropriately setting the blood flow parameters. The effectiveness of the model was verified by ex vivo experiments. Both the vessel-antenna spacing and the diameter of large vessel will affect the temperature distribution and the volume of coagulation zone. The vessel-antenna spacing is the more significant factor, and the diameter of vessel is much less significant. The cooling effects of large vessels does not work in the early stage of MWA (0–10 s). Since microwave ablation is not sensitive to heat sink effect, the volume of coagulation zone will not be significantly affected when the vessel falls outside the predicted coagulation zone. This study can provide a more practical reference for tumor MWA under conditions simulating an in vivo setting and can improve the accuracy of preoperative planning.
HG and SH designed the study. SW and ZW conducted the experiment. JW analyzed the data. JW and HG wrote the paper. All authors have read and approved the final manuscript.
Not applicable.
The authors would like to thank the anonymous reviewers for their constructive comments and suggestions.
This work was supported by the National Natural Science Foundation of China (Grant Nos. 61871005 and 82171941).
The authors declare no conflict of interest.
MWA, Microwave Ablation; RFA, Radiofrequency Ablation; SAR, Specific Absorption Rate; 3D, three-dimensional; FEM, Finite Element Method.