
Glioblastoma multiforme (GBM) is a highly aggressive brain tumor with poor progrnosis and a high recurrence rate after surgery. To this end, we examined the role of Nanog that is highly expressed in this tumor. NANOG is a transcription factor involved in the pluripotency of embryonic stem cells (ESCs) and the induction of malignancy in cancer stem-like cells (CSCs). Bioinformatic analysis revealed that NANOG may be associated with the development of stem-like traits in GBM. Forced expression of NANOG markedly increased the expression of cancer stem cell markers and promoted the sphere formation and migration of GBM cells. Nanog enhanced the expression of SHH which is required for the maintenance of the positive feedback loop of Hedgehog signaling pathway. Treatment of GBM cells with SANT-1 and GANT61 significantly reduced the tumor progression. These data support a view that reduction of Nanog might have therapeutic benefits in GBM.
Glioblastoma (GBM) is the most common and aggressive primary brain tumor in humans, with a current median survival of approximately 14 months (1). GBM displays remarkable cellular heterogeneity and hierarchy for containing glioma stem cells (GSCs) with potent tumorigenic capacity. GSCs are functionally defined by extensive self-renewal, multi-lineage differentiation, and potential to drive malignant growth in vivo (2). GSCs promote tumor angiogenesis, immune evasion, and recruitment of tumor-supportive macrophages to facilitate malignant growth, invasion and therapeutic resistance, thus, targeting GSCs is an important strategy for the treatment of GBM (3, 4).
Nanog is a core transcription factor, that encompasses a DNA-binding domain, and is part of the core regulatory network that suppresses differentiation and maintains pluripotency (5). Although, Nanog expression lacks prognostic value in rectal cancer, its expression is used as a biomarker that predicts a poor clinical outcome in oral squamous cell carcinoma (6, 7). Furthermore, Nanog expression closely relates with stem-like traits in some malignant cancers (8-10). To this end, we examined the effects of Nanog on stem cell-like properties and malignant biological behavior of GBM cells. Furthermore, we examined the positive feedback loop between Nanog and Hedgehog signaling pathway. We also show that up-regulation of Nanog enhances Shh-Gli-Nanog-Smo signaling network. In vitro and in vivo experiments demonstrate that combination of SANT-1 and GANT61 can significantly inhibit GBM progression. Collectively, this work provides a novel potential therapeutic target for the treatment of GBM.
The human GBM cell line LN229 was purchased from ATCC (Manassas, VA). Primary GBM2 cells used in this study were derived from the GBM tumor tissues (Southwest Hospital, TMMU, China) and cultured as previously described (11). The cells were routinely cultured in DMEM medium containing 10% FBS, and maintained in presence of 5% CO2 at 370 C. 284 patient specimens from Gravendeel_GBM database was utilized to evaluate the correlation between the expression of NANOG, and GLI1 and SMO. Non-targeting control vector lentivirus purchased from HanBio Technology Co. (Shanghai, China)
The microarray data of mRNA from 70 glioblastoma patient samples were downloaded from the NCBI’s (Gene Expression Omnibus (GEO): GSE53733. These data were then separated into low and high group at the cut-off value of median expression of NANOG. Kyoto Encyclopedia of Genes and Genomes (KEGG) pathway analysis of this microarray was performed using KEGG Pathway Finder with a gene correlation that was based on NANOG expression using the R2 web application. Absolute r cutoff was equal to 0.5, P<0.05. Gene Set Enrichment Analysis (GSEA; http://www.broadinstitute.org/gsea/index.jsp) was carried out using the Cell Adhesion Molecules CAMS, Cell Cycle and Apoptosis gene set and Gene Ontology (GO) Anchoring Junction gene set.
LN229 and GBM2 cells were seeded in 6-well plates at 2×10⁵ cells/well in DMEM supplemented with 10% FBS. When cultures were approximately 60%-70% confluent, the medium was changed to 900 µL serum-free DMEM. The diluted OE NANOG and non-targeting control vector lentivirus was added to each well and dishes were incubated for 24 h. The medium was then changed, and then the samples were incubated for 48 h. Puromycin-containing medium was then applied to select transduced cells.
Western blot assay was conducted as previously described (12, 13). In brief, proteins were separated using 8% SDS Tris-glycine gels and transferred onto a polyvinylidene difluoride membrane. Membranes were blocked with 5% fat-free milk and incubated with antibodies against β-actin (Beyotime Institute of Biotechnology, Beijing, China), Nanog, Sox2, Oct4, CD133, Gli1, Gli2, Smo (Cell Signaling Technology, Beverly, MA) overnight at 4℃. Then, an appropriate secondary antibody (anti-mouse or anti-rabbit IgG; Beyotime Institute of Biotechnology, Beijing, China) was applied on the membranes. Immunoreactivity was detected using an ECL Kit (Pierce, Thermofisher, Chino CA). The results were analyzed using Image Lab Software (Bio-Rad Laboratories).
Total RNA from cultured cells was extracted using RaPure Total RNA Mini Kit (Magen) according to the manufacturer’s protocol. qRT-PCR was carried out using the 5×PrimeScript RT Master Mix (TaKaRa). All reactions were performed in a C1000TM Thermal cycler (Bio-Rad CFX96TM Real-time System). The results from qRT-PCR were normalized using the threshold cycle of β-actin. Targeted genes were amplified with primers listed in Table 1. The total volume of each reaction was 10 µL, and the relative expression of the target gene was analyzed by the comparative cycle threshold (2−ΔΔCt) method.
| Gene | Forward primer (5' to 3') | Reverse primer (5' to 3') |
|---|---|---|
| β-actin | GTACGACCAGAGGCATACAGG | GATGACGATATCGCTGCGCTG |
| SOX2 | GCCGAGTGGAAACTTTTGTCG | GGCAGCGTGTACTTATCCTTCT |
| NANOG | TTTGTGGGCCTGAAGAAAACT | AGGGCTGTCCTGAATAAGCAG |
| OCT4 | CTGGGTTGATCCTCGGACCT | CCATCGGAGTTGCTCTCCA |
| OLIG2 | CCAGAGCCCGATGACCTTTTT | CACTGCCTCCTAGCTTGTCC |
| GLI1 | GTGCCGTTTGGTCACATGG | AACGCTATACAGATCCTAGCTCG |
| GLI2 | GCATGGAATGGTGGCAAGAG | CTGCCTCCGAGAAGCAAGAAG |
| SMO | GCAGGGTAGCGATTCGAGTT | GAAGTGCCCTTGGTTCGGA |
GBM cells were harvested and seeded into 96-well plates at a density of 5, 10, 20 cells/well with 10 replicates. Fourteen days after implantation, the efficiency of sphere formation was calculated using extreme limiting dilution analysis as described (14).
Two hundred cells were into 6-well plates and cultured for 14 days. After washing with phosphate-buffered saline (PBS), cells were fixed with 20% methanol for 15 min. Then, Giemsa solution was added to each dish for 5 min. After washing and air drying, clones were counted using a cloning counter. A total of 100 clones was counted in each dish. Rate of formation of clones was assessed by the following formula.
Rate of clone formation (%) = (number of clones/number of inoculated cells) × 100%.
Dishes were trypsinized and the total number of cells was counted. Then, 1x10⁴ cells and serum-free cell culture medium (200 µL) were added to each cell culture insert (8.0 µm; Millipore). In each well of 24 well culture dishes, 500 µL medium with 10% FBS was added and then inserts were inserted to each well and the dishes were placed at 37˚C. After 24 h of incubation, the inserts were washed with phosphate‑buffered saline (PBS) and fixed for 15 minutes in 4% paraformaldehyde. The cells on the top of each insert were removed and then the inserts were stained by crystal violet solution (Beyotime Institute of Biotechnology, Beijing, China). A total number of 200 cells were counted under a microscope.
GBM cells were plated in 24- well plates for 24 h before being transfected with pGL4-luc2 vector encompassing the SMO promoter or control Renilla luciferase plasmid (pRL-TK). After 24h of incubation, cells were transfected with NANOG expression vector or the corresponding empty vector (GENECHEM, Shanghai, China). The experimental plasmid to control plasmid ratio was 50:1. Luciferase assays were performed with the Dual Luciferase Reporter Assay System (Promega). Briefly, 24-48 h post-transfection, cell lysates were prepared by incubating the cells with 1× passive lysis buffer for 15 min at room temperature. Cell lysates were transferred in triplicates to 96-well plates and analyzed on a Varioskan Flash Luminometer (Thermo Scientific) according to the manufacturer’s instruction. The firefly luminescence signal was normalized to the Renilla luminescence signal. The sequences of luciferase plasmids are listed in Table 2.
| Gene | Forward primer (5' to 3') | Reverse primer (5' to 3') |
|---|---|---|
| Vector | TTTGGGAAGCCGAGGTG | TGCGATCTTGGCTCACT |
| OE NANOG | CCCTGCCTCAGCCTCGGAAAGT | CCCTGCCTCAGCCTCGGAAAGT |
| SMO Promoter | AGGTTGCAGTGAGCCAAGA | AAGCCTAGCCCAGCAGAGCC |
| pGL4-luc2 Vector | TGGGCTAGGCTTCGTTG | AGGACCTCAGCAGGAAAA |
| pRL-TK Vector | AGGTCCTGGAATACTAAAGGG | TAAATGCCGCCATCTGC |
2×10³ LN229 and GBM2 cells were sorted by FACS and seeded in 96-well cell culture plates in six replicates in 100 μL medium with 10% serum overnight. Cells were divided into four groups; the control group received DMSO, the S group received 20 nM SANT-1, the G group received 5 μM GANT61 and the S+G group received 20 nM SANT-1 and 5 μM GANT61.
NANOG overexpressing cells, corresponding control and WT (wild type) LN229 and GBM2 cells that were sorted by FACS were seeded at 2×10³ cells/well in 96-well plates with six replicates. Viability of cells was assessed by production of CCK-8 formazan ( C0038, Beyotime) for 7 days and the OD-values were recorded by fluoroanalyzer (Floskan Ascent) at OD of 450 nm.
The animal study was performed in accordance with the protocol approved by the Institutional Animal Care and Use Committee of Southwest Hospital, Third Military Medical University (TMMU). Five week-old NOD/SCID female mice were purchased from Laboratory Animal Center of TMMU. LN229 cells were divided into four groups; the control group received DMSO, the S group received 20 nM SANT-1, the G group received 5 μM GANT61 and the S+G group received 20 nM SANT-1 and 5 μM GANT61.
All groups of GBM cells were pre-treated with SANT-1, GANT61 or SANT-1 and GANT61 for three days. Then four groups of GBM cells were washed and re-suspended in PBS and mixed with Matrigel (1:1, BD Biosciences). 4×10⁵ cells in 100 μL matrigels were injected subcutaneously into right back of NOD/SCID mice. After 25 days, mice were sacrificed, and the tumors were removed and their weight were measured.
Results were obtained from at least three experiments. Data are expressed as the mean ±SD by comparing the experimental and control groups using SPSS 16.0 statistical software (SPSS Inc., Chicago, IL, USA). When two groups were compared, the unpaired Student's t-test or by two-way ANOVA test was used. Multiple comparisons between the groups was performed using S-N-K method. Data are presented as the mean ±SD. Statistical significance was set at *** P < 0.001, ** P < 0.01, * P < 0.05.
In order to illustrate the role of NANOG in GBM cells, microarray of 70 GBM patient samples (GSE5373) were obtained from GEO database (Figure 1A). GSEA analysis showed that NANOG expression negatively correlated with the expression of genes which are responsible for anchoring junction, cell cycle, apoptosis, and cell adhesion in the context of GO_ANCHORING_JUNCTION,KEGG_CELL_ADHESION_MOLECULES,KEGG_CELL_CYCL,KEGG_APOPTOSIS gene-set. Such negative correlation suggest that NANOG might impact cell division, migration, and apoptosis (Figure 1B).
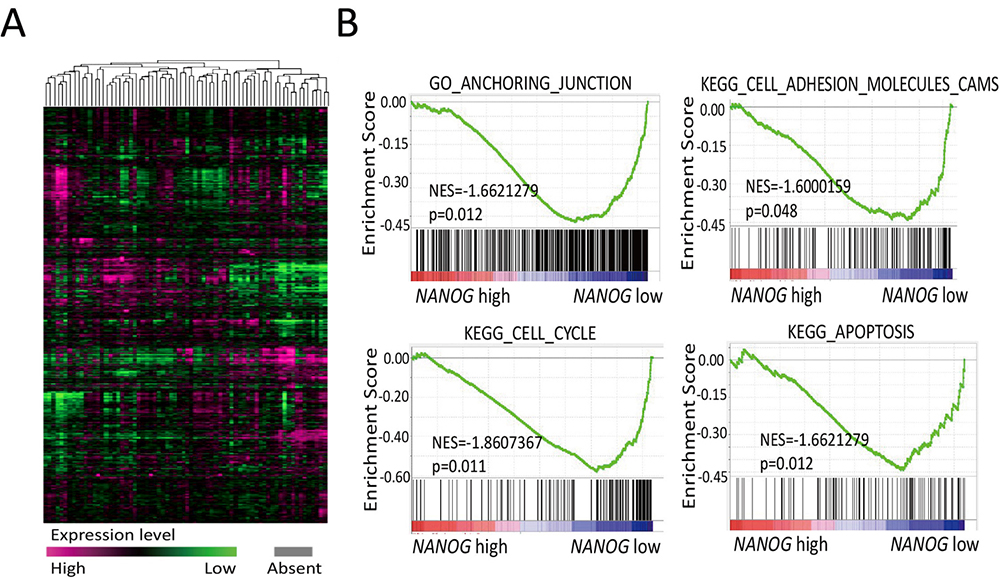 Figure 1
NANOG is associated with stem-like traits of GBM cells evaluated by GSEA enrichment analysis. (A) Heat map of expression values for differentially expressed genes from 70 glioblastoma patients were obtained from the GEO database (GSE53733). (B) GSE53733 data set was analyzed with GSEA enrichment plots of the GO Anchoring Junction gene set, KEGG Cell Adhesion Molecules Cams, Cell Cycle and Apoptosis. GBM, glioblastoma; GEO, Gene Expression Omnibus; GO, Gene Ontology; GSEA, Gene Set Enrichment Analysis; KEGG, Kyoto Encyclopedia of Genes and Genomes.
Nanog has been reported to regulate “stemness” in some malignant tumors. To decipher the role of NANOG in GBM, LN229 and GBM2 cells were transduced with NANOG-OE lentivirus. Flow cytometry and microscopic examination for florescence protein (GFP) showed that over 90% of cells were GFP-positive (Figure 2A-B). qRT-PCR and Western blot assays showed that the expression of Nanog was significantly increased in NANOG-OE LN229 and GBM2 cells as compared with the cells that were transduced with empty vector (Figure 2C). To determine whether overexpression of NANOG into the GBM cells impacts the number of cancer stem cells, we assessed the CD133, OCT4 and SOX2 in the transduced cells by qRT-PCR and Western blot assays. These analyses showed that the expression of all three genes was markedly increased in cells that were transduced to overexpress NANOG (Figure 2D).
 Figure 2
Overexpression of Nanog up-regulated cancer stem cells markers in established NANOG overexpression (OE NANOG) GBM cells. (A) GFP-positive GBM cells was testified by flow cytometry. (B) Representative images of GFP-positive LN229 and GBM2 cells and corresponding control cells. (scare bar=100 μm) (C) qRT-PCR and Western blot analysis confirmed the expression of Nanog in Nanog overexpressed LN229 and GBM2 cells and corresponding control cells. (D) qRT-PCR and Western blot analysis testified the expression of Sox2, Oct4 and CD133 in Nanog overexpressed LN229 and GBM2 cells and corresponding control cells. Data are means ± SD.*, P < 0.05. GFP, Green fluorescent protein.
Limiting dilution assays in vitro showed that overexpression of NANOG markedly enhanced the sphere-forming efficiency in GBM cells and increased their diameters (Figure 3A). CCK-8 assays showed that the size and quantity of colonies and proliferation rate were significantly increased in OE NANOG LN229 cells and GBM2 cells as compared with corresponding control and WT cells (Figure 3B,3D).
 Figure 3
Nanog augments the stem-like traits and promotes migration and invasion capabilities of GBM cells. (A) The size and efficiency of tumor-spheres formed by Nanog overexpressed LN229 and GBM2 and corresponding control cells.(scare bar=100μm) (B) Representative images of colony forming in Nanog overexpressed LN229 and GBM2 cells and corresponding control cells. (C) Representative images of Transwell migration assays in Nanog overexpressed LN229 and GBM2 cells and corresponding control cells. (scare bar=50µm)Data are means ± SD.*, P < 0.05.
Emerging evidence has demonstrated that cancer stem cells (CSCs) play critical roles in tumor migration and recurrence. Transwell migration assays demonstrated that overexpression of NANOG significantly increased the migratory (Figure 3C) capability of GBM cells.
NANOG has been identified as the downstream target for the Hedgehog signaling that plays crucial roles in tumor progression (15). Consistent with previous reports, analysis of Gravendeel GBM_database showed that expression of NANOG significantly correlated with expression of SMO and GLI1 (16) (Figure 4A). qRT-PCR and Western blot assays showed that overexpression of NANOG significantly increased the expression of Hedgehog signaling molecules, including Gli1, Gli2 and Smo (Figure 4B,4C). Existence of a positive feedback loop between NANOG and Hedgehog pathway was verified by dual-luciferase reporter system showing that NANOG increased the transcription of SMO and GLI1 in LN229 and GBM2 cells (Figure 4D, Figure 6) .
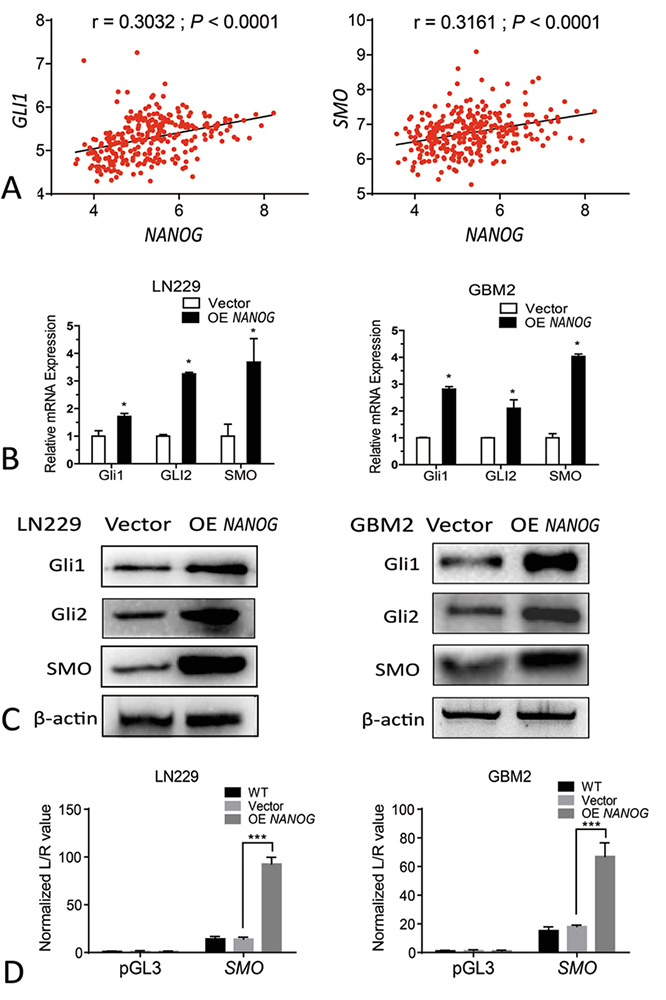 Figure 4
Overexpression of Nanog activates the SHH signaling pathway in GBM cells. (A) Pearson correlation analysis of NANOG and GLI1 expressions, NANOG and SMO expressions from Gravendeel database. (B) qRT-PCR analysis testified Gli1,Gli2 and SMO in Nanog overexpressed LN229 and GBM2 cells and corresponding control cells. (C) Western blot analysis testified Gli1, Gli2 and SMO in Nanog overexpressed LN229 and GBM2 cells and corresponding control cells. (D) Relative luciferase activities of reporter constructs containing the NANOG promoter in LN229 and GBM2 cells transfected with SMO expression plasmids compared that in empty vector-transfected (Vector) or untransfected (WT) (right panel) cells. Data are means ± SD.*, P < 0.05.
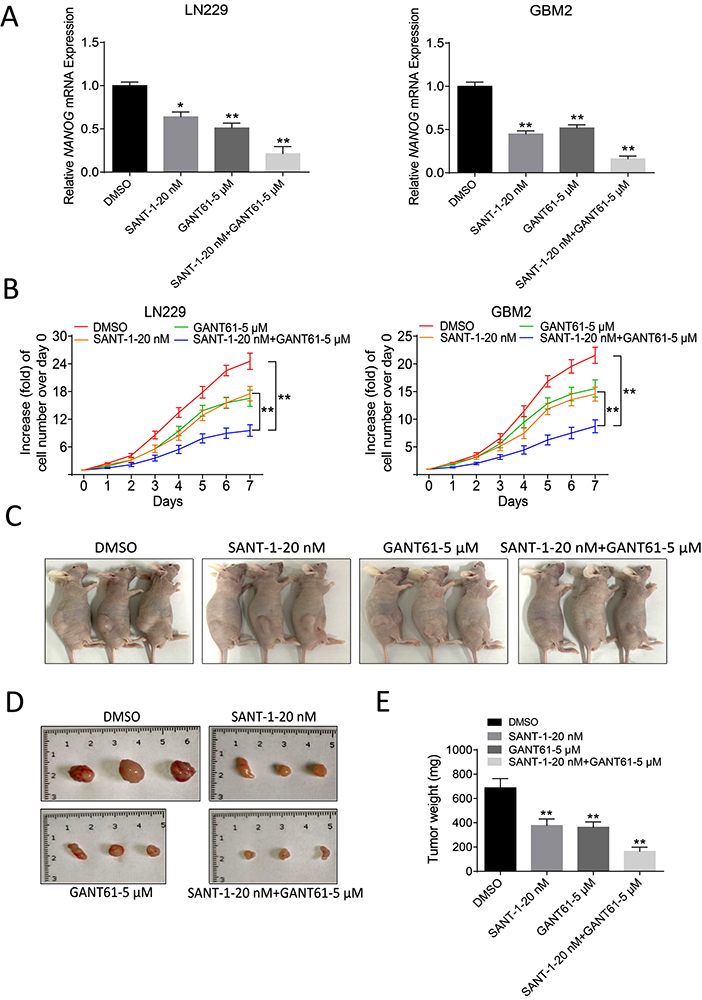 Figure 5
Combination therapy with SANT-1 and GANT61inhibits GBM progression. (A) qRT-PCR of Nanog in LN229 and GBM2 cells. (B) Cell proliferation curve of LN229 and GBM2 cells under different treatments testified by CCK-8 assay. (C) Tumor volume changes of different groups after the injection of LN229 cells. (D-E) comparison of dissected tumors of different groups 25 days after injection of HEI193 cells. Tumor weight of different groups 25 days after injection of LN229 cells. Data are means ± SD.*, P < 0.05, **, P < 0.01.
Smo and Gli1 are downstream regulators of the sonic hedgehog pathway. To assess the importance of targeting NANOG as a potential therapeutic target in GBM, we tested the potential of inhibiting SHH with combination of SANT-1, a high affinity antagonist of smoothened (SMO) and GANT61, a high affinity antagonist of Gli1. qRT-PCR assays showed that combination of SANT-1 and GANT61 antagonists significantly inhibited expression of Nanog as compared with control or treatment with SANT-1 or GANT61 alone in LN229 and GBM2 cells indicating of the existence of a feedback loop (Figure 5A). CCK8 assay was carried out to assess the in vitro effect of SANT-1 and GANT61 in LN229 and GBM2 cells. Combination of SANT-1 and GANT61 antagonists significantly inhibited cell growth as compared with control or treatment with SANT-1 or GANT61 alone (Figure 5B).
 Figure 6
schematic diagram shows that Nanog not only serves as the down-stream of Hedgehog signaling through transcriptional activation by Gli1 but also increases the activity of Hedgehog signaling by activating Gli1and SMO in GBM cells.
In addition, in vivo experiment revealed that the tumor size was significantly reduced in mice treated with SANT-1, or GANT61. However, the most striking reduction in tumor burden was achieved by treatment of mice with both SANT-1 and GANT61 (Figure 5C-E).
GBM is a tumor of glial cells or their precursors and is one of the most lethal human malignancies. These tumors are treated by surgical resection, radiotherapy plus adjuvant treatment with temozolomide (TMZ). Despite treatment, the survival of GBM patients remains less than 15 months (17, 18). Glioma stem cell-like cell (GSCL) which exhibit self-renewal and multi-directional differentiation are considered to be important to the generation, propagation, and resistance to chemoradiotherapy (19, 20).
Nanog and Hedgehog signaling pathway promote self-renewal of Embryonic stem cells (ESCs) and support progression of cancer. NANOG, play a critical role in maintaining self-renewal and pluripotency in normal embryonic stem cells, that has the potential to confer to cancer cells, stem-like traits including self-renewal and to enhance cell growth, reducing apoptosis and in enhancing tumorigenicity, metastasis, and drug-resistance in tumor cells by impacting NF-κB1 and JAK-STAT3 signaling pathway (21-25). The Hedgehog (HH) pathway is important in embryonic growth and development, and in directing cell fate (26). It has been shown that GSC expansion and specific expression of ESC-like stemness signature are dependent on the Hedgehog-Gli1 (HH-Gli1), which appears to exert its function through direct regulation of NANOGP8 (16). The direct regulatory interaction between Hedgehog signaling and Nanog is mediated by the Gli1 and Gli2, two downstream targets of Hedgehog that directly bind to the cis-regulatory sequence of the NANOG gene (27).
Here, we showed that stable NANOG overexpression in GBM cell lines by lentivirus system markedly increased CSC-associated genes in GBM cells and enhanced formation of tumor spheres, clone formation, and migration in vitro. We also showed that NANOG induced the signaling molecules of Hedgehog pathway suggesting of existence of a direct feedback loop between NANOG and this pathway. Existence of such a loop might be significant to the malignant behavior of GBM, making this loop as a possible therapeutic target. Nanog augmented stem-like traits of GBM cells and activated SHH signaling pathway through a positive feedback loop that led to increase in Smo and Gli1.
Some inhibitors of SHH signaling pathway have been used in the treatment of non-small cell lung cancer (NSCLC), prostate cancer, glioma, and medulloblastoma (28-31). SANT-1, a high affinity antagonist of Smo, has induced apoptosis in a Ras/NFƙB dependent manner in glioma and has reduced the tumor cell viability in pancreatic and prostate cancer cells (32). GANT61 which is a GLI inhibitor, has been reported to sensitizes glioma cells to the temozolomide treatment (33.) However, as yet, the combination of SANT-1 and GANT61 has not yet been tested in glioma cells (34). Here, we showed that use of inhibitors of Smo and Gli1 reduced tumor growth in vivo. Moreover, when combined together, the SANT-1 and GANT61 were more effective in decreasing the tumor burden. These findings suggest that the combination of these inhibitors might be useful in the treatment of GBM.
Both Yuan Ye and Mengsi Zhang contributed equally to this work. This work was supported by the National Natural Science Foundation of China (No.81472356) and Southwest Hospital Foundation (No. SWH2016JCZD-09).
GBM
glioblastoma
embryonic stem cells
cancer stem-like cells
Gene Expression Omnibus
Kyoto Encyclopedia of Genes and Genomes
Gene Set Enrichment Analysis
Gene Ontology
wild type
Smoothened, Frizzled Class Receptor
GLI Family Zinc Finger 1
green fluorescent protein
Standard Deviation
SRY-Box Transcription Factor 2
Octamer-Binding Protein 4