
Academic Editor: Graham Pawelec
Background: Alterations in the microbiota-gut-brain axis are associated with the onset of autism spectrum disorder (ASD). Numerous studies have reported that the gut microbiota (GM) is significantly altered in individuals with ASD and animal models of ASD. However, few studies have focused on sex-specific differences in the GM and fecal metabolites of ASD. Methods: In this study, we performed 16S rRNA gene sequencing and untargeted metabolomics in parallel on fecal samples from a valproic acid (VPA)-induced rat model of autism (VPA rats). Based on these data, we analyzed differentially abundant metabolites in the Kyoto Encyclopedia of Genes and Genomes (KEGG) database to reveal the possible mechanism of ASD. Data derived from male and female rats were analyzed separately. Finally, we analyzed the correlation between characteristic genera and characteristic fecal metabolites in VPA rats of both sexes. Results: The results showed that VPA rats of both sexes presented remarkable alterations in the GM and fecal metabolites. Sex-specific differences were noticeably detected. We identified 51 annotated differentially abundant fecal metabolites and 1 differentially enriched KEGG pathway between the male VPA and male control groups. Ruminococcus_2, Candidatus_Soleaferrea, Desulfovibrio, Candidatus_Saccharimonas, Intestinimonas, [Eubacterium]_xylanophilum_group, [Eubacterium]_brachy_group and [Bacteroides]_pectinophilus_group were the characteristic genera of male VPA rats. Between the female VPA and female control groups, 124 annotated differentially abundant fecal metabolites were identified without differentially enriched KEGG pathways. Ruminiclostridium, Acetatifactor, Desulfovibrio, [Eubacterium]_xylanophilum_group and Candidatus_Saccharimonas were the characteristic genera of female VPA rats. Correlation analysis revealed a tight relationship between the GM and fecal metabolites in VPA rats of both sexes. Conclusions: In conclusion, alterations in the GM and fecal metabolites in VPA rats showed sex-specific differences. The therapy for ASD might be different between sexes in the future.
Autism spectrum disorder (ASD) is an intractable neurodevelopmental disability caused by multiple genetic and environmental factors [1, 2, 3]. The characteristic symptoms of ASD include social deficits and repetitive behaviors [4]. In recent years, the prevalence of ASD has grown very rapidly in industrialized countries [5]. However, the mechanism of ASD remains unclear with no effective medications. The morbidity of ASD is typically male biased, with a male-to-female ratio of approximately 4 to 1 [6, 7]. A previous study also reported that the mechanism of ASD is different between sexes [8]. Thus, sex-specific studies may help better illuminate the mechanisms of ASD.
The “microbiota-brain-gut axis” theory has been well acknowledged [9]. The gut microbiota (GM) is able to communicate with the central nervous system (CNS), modulate brain functions and influence individual behaviors [10]. GM produced a set of metabolites present in the feces. These metabolites were defined as fecal metabolites, which could partly reflect the GM status and the relationship between the GM and host [11]. The GM communicates with the CNS via gut hormones, the vagus nerve, the immune system and fecal metabolites [12]. On the other hand, signals from the CNS can affect the number and composition of GM constituents and fecal metabolites [13]. Thus, the detection and analysis of GM and fecal metabolites might be an effective strategy to explore the mechanism of intractable CNS disorders.
Recently, the GM has been suggested to be involved in the pathogenesis of ASD due to the frequent occurrence of gastrointestinal (GI) dysfunctions in ASD patients [14, 15, 16, 17, 18, 19, 20]. A large number of papers have revealed that the GM is significantly altered in patients with ASD or animal models of ASD when compared with that in their controls [21, 22, 23, 24, 25, 26, 27, 28, 29, 30, 31, 32, 33, 34]. Colonization with GM from ASD individuals is sufficient to induce hallmark autistic behaviors in mice [35]. Fecal metabolites are also altered in children with ASD [26, 36, 37]. For example, serotonin plays as a link between the gut-brain-microbiome axis in the pathogenesis of ASD [38]. Indigenous bacteria from the GM can regulate host serotonin biosynthesis [39]. However, the results from different trials were inconsistent because of the heterogeneity of age, sex, race, and severity of GI symptoms and the differences in detection methods. According to the latest studies, 16S rRNA gene sequencing and ultra-high-performance liquid chromatography/mass spectrometry (UHPLC-MS) based untargeted metabolomics might be useful methods to detect the true variations in the GM and fecal metabolites, respectively [40]. To our knowledge, UHPLC-MS based untargeted metabolomics has seldom or never been used in fecal samples of ASD patients or animal models.
Valproic acid (VPA) is a commonly used antiepileptic drug in the clinic. A single intraperitoneal injection of VPA during the second trimester in female rats is well accepted to establish a rat autism model in offspring (VPA rats). This animal model manifests typical autism-like behaviors, including deficits in social interaction and neurodevelopment, increased repetitive behavior and reduced pain sensitivity [41]. The level of 5-hydroxytryptamine (5-HT) is increased in the brain and reduced in peripheral blood [42]. In addition, the alterations of the GM in VPA rats are similar to those in ASD patients [43]. Overall, VPA rats might be suitable to explore the true variations in the GM and fecal metabolites in ASD.
In this study, 16S rRNA gene sequencing and UHPLC-MS based untargeted metabolomics were performed to explore the taxonomical characterization of GM and the features of fecal metabolites in VPA rats. Based on these data, we explored the potential mechanism of ASD induced by prenatal exposure to VPA. In addition, we addressed the sex-specific differences due to the male-biased morbidity of ASD.
Eight male and eight female Wistar rats aged 10–12 weeks and weighing 270–290
g were purchased from Vital River Laboratory Animal Technology (Beijing, China).
The animals were housed at 23
We constructed the animal model in accordance with previous studies [44, 45]. Female rats were paired with male rats overnight. The day after a vaginal plug was detected was considered embryonic day 0.5 (E 0.5). Pregnant rats were housed individually and randomly distributed into two groups: the VPA-treated group (n = 4) and the normal saline (NS) group (n = 4). Pregnant rats in the VPA-treated group were intraperitoneally injected with VPA (Sigma: P4543) at a dose of 600 mg/kg on E 12.5. In the NS group, the rats received the same volume of NS. After weaning at postnatal day 21 (PND 21), every 4-5 pups of the same group and sex were raised in the same cage until the end of fecal sample collection.
We randomly selected 1 male and 1 female pup from each litter for our experiment. A total of 16 pups from litters in the VPA-treated group and NS group were included and divided into 4 groups, with 4 animals each: the (1) male control group (mCtrl group), (2) male VPA group (mVPA group), (3) female control group (fCtrl group), and (4) female VPA group (fVPA group).
Pups were individually placed into clean cages. After defecation, we used
sterile tweezers to collect the fecal pellets into sterile cryotubes and
immediately transferred them into liquid nitrogen. After collection of feces, all
the fecal samples were stored at –80
16S rRNA gene sequencing was performed based on the method described previously
with some modifications [46]. Total fecal genomic DNA was extracted with an
E.Z.N.A Stool DNA Kit (OMEGA, USA) and quantified by a Nanodrop 2000
spectrophotometer (Thermo Fisher Scientific, Waltham, MA, USA). The V3-V4 region
of the 16S rRNA gene was amplified with the primers 341F
(5
PCR products were detected by 2% agarose gel electrophoresis and purified by a quick gel extraction kit (Qiagen, Dusseldorf, Germany). Library pools were produced with equal amounts of PCR products with a TruSeq Nano DNA LT sample prep kit (Illumina, San Diego, California, USA); these pools were amplified through paired-end sequencing on the Illumina MiSeq PE300 platform.
The quality control (QC) of original data was carried out using Trimmomatic v0.39 software (http://www.usadellab.org/cms/index.php?page=trimmomatic). Based on the overlap (minimum: 10 bp) between paired-end (PE) reads after QC, PE reads were assembled using Flash v1.2.11 software (McKusick-Nathans Institute of Genetic Medicine, Johns Hopkins University School of Medicine, USA). QIIME v1.9.1 software (Knight Lab in University of California, San Diego, USA) (QIIME allows analysis of high-throughput community sequencing data) was adopted for processing, and VSEARCH v2.14.1 software (Department of Informatics, University of Oslo, Norway) (VSEARCH: a versatile open-source tool for metagenomics) was used to detect chimera sequences. We used the Uclust method in the QIIME v1.9.1 software package to perform operational taxonomic units (OTUs) clustering analysis according to 97% sequence similarity level. Rarefaction was not applied in our research. On the basis of the Silva database Release 138 (http://www.arb-silva.de), taxonomic annotations were made for the OTUs of each sample using a confidence threshold of 70%. LefSe (http://huttenhower.sph.harvard.edu/galaxy/root?tool_id=lefse_upload) was used to evaluate the effect of each taxon on discrimination between different groups. The Shannon, Simpson, Chao1 and ACE indices of microbial communities were calculated by Mothur (https://mothur.org/). Principal coordinates analysis (PCoA), based on Bray-Curtis dissimilarity, was analyzed by permutational multivariate analysis of variance (PERMANOVA) in R language v3.2.1 (University of Auckland, New Zealand) to determine the different bacterial communities of beta-diversity.
Fecal samples (100 mg each sample) were triturated in liquid nitrogen and
vortexed with 300
UHPLC-MS was performed on a UPLC I-class instrument (Waters, ACQUITY UPLC). It
was equipped with a binary solvent delivery manager, an autosampler and a mass
spectrometer (Waters, Vion IMS QTof) with an electrospray interface. Sample mass
spectrometric data were collected in either positive or negative ionization mode.
We set the source temperature, desolvation temperature and desolvation gas flow
to 120
Principal component analysis (PCA) and orthogonal partial least squares
discrimination analysis (OPLS-DA), performed by the SIMCA-P software package
(v13.0, Umetric, Umea◦, Sweden), were used to observe the degree of dispersion
and distinguish the overall differences in metabolic profiles, respectively. In
OPLS-DA model, metabolites with variable importance in projection (VIP)
Quantitative sequencing data with a nonnormal distribution were analyzed by the
Wilcoxon rank sum test, and p-values were checked using the Benjamini
Hochberg false discovery rate (FDR). Data were presented as the mean
To detect the taxonomical characterization of the GM in male and female VPA
rats, fecal samples were analyzed by 16S rRNA gene sequencing. We obtained
943,972 sequences and 390,572,407 bases from 16 samples with an average of 58,998
sequences per sample. A total of 1501 OTUs were annotated in all samples (1501 at
the phylum level; 1499 at the class level; 1496 at the order level; 1448 at the
family level; 861 at the genera level; 115 at the species level). The analysis of
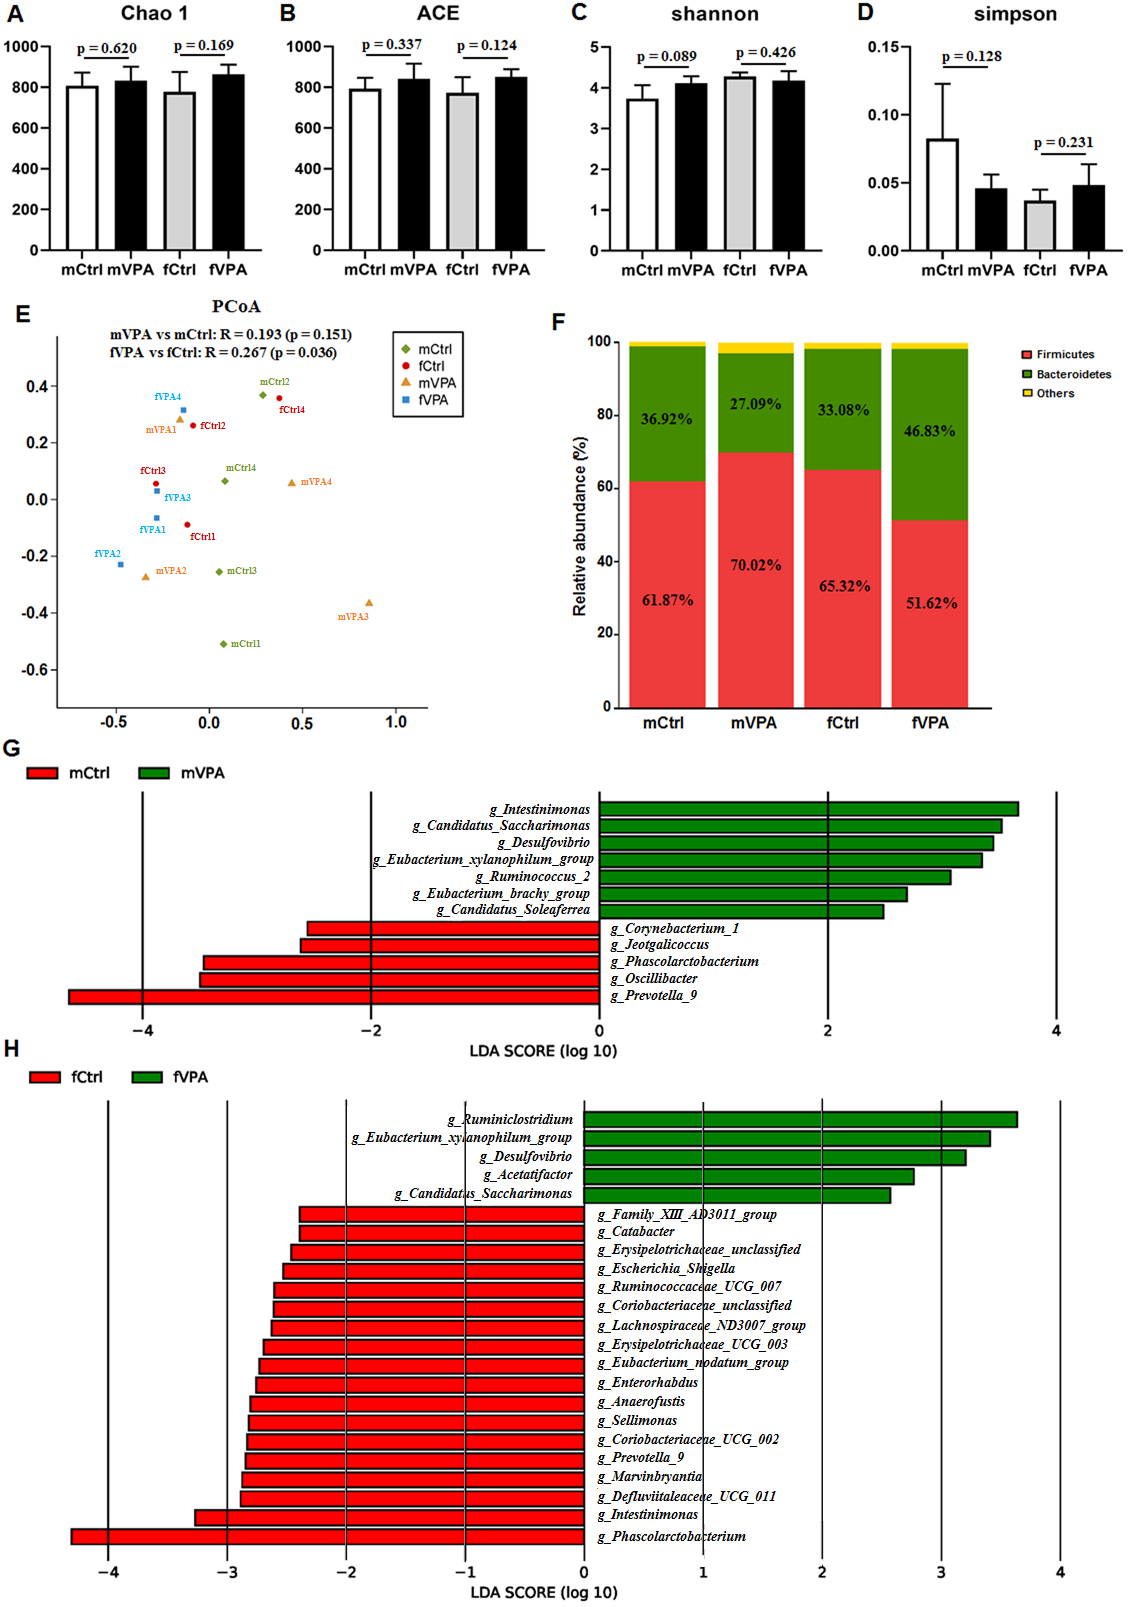 Fig. 1.
The difference in gut microbiota in different sexes between the Ctrl and VPA rats. (A) Chao1 index. (B) ACE index. (C) Shannon index. (D) Simpson index. (E) PCoA chart. The X and Y axes represent two selected principal axes. The percentage represents the explanatory value of the principal axis for the difference between samples. (F) Column chart of species composition at the phylum level. (G–H) LDA chart. The impact of the representative species abundance on the differences between (G) the mVPA and mCtrl groups or between (H) the fVPA and fCtrl groups. mCtrl, male control group; mVPA, male VPA group; fCtrl, female control group; fVPA, female VPA group.
| mVPA (mean) | mVPA (SD) | mCtrl (mean) | mCtrl (SD) | p-value | FDR | |
| Ruminococcus_2 | 0.00262 | 0.00310 | 0.00020 | 0.00011 | 0.0294 | 0.5776 |
| Candidatus_Soleaferrea | 0.00061 | 0.00041 | 7.76 |
4.24 |
0.0294 | 0.5776 |
| Desulfovibrio | 0.00609 | 0.00224 | 0.00047 | 0.00047 | 0.0304 | 0.5776 |
| Candidatus_Saccharimonas | 0.00713 | 0.00730 | 0.00020 | 0.00021 | 0.0304 | 0.5776 |
| Intestinimonas | 0.01044 | 0.01141 | 0.00165 | 0.00130 | 0.0606 | 0.5776 |
| [Eubacterium]_xylanophilum_group | 0.00509 | 0.00312 | 0.00083 | 0.00120 | 0.0606 | 0.5776 |
| [Eubacterium]_brachy_group | 4.43 |
3.62 |
0 | 0 | 0.0668 | 0.5776 |
| [Bacteroides]_pectinophilus_group | 0.00026 | 0.00031 | 0 | 0 | 0.0689 | 0.5776 |
| mVPA, male VPA group; mCtrl, male control group; SD, standard deviation; FDR, false discovery rate. | ||||||
| fVPA (mean) | fVPA (SD) | fCtrl (mean) | fCtrl (SD) | p-value | FDR | |
| Ruminiclostridium | 0.01217 | 0.01614 | 0.00103 | 0.00031 | 0.0304 | 0.2582 |
| Acetatifactor | 0.00176 | 0.00097 | 0.00049 | 0.00026 | 0.0304 | 0.2582 |
| Desulfovibrio | 0.00274 | 0.00349 | 0.00041 | 0.00036 | 0.0591 | 0.2582 |
| [Eubacterium]_xylanophilum_group | 0.00646 | 0.00402 | 0.00114 | 0.00194 | 0.0606 | 0.2582 |
| Candidatus_Saccharimonas | 0.00089 | 0.00054 | 0.00021 | 0.00020 | 0.0606 | 0.2582 |
| fVPA, female VPA group; fCtrl, female control group; SD, standard deviation; FDR, false discovery rate. | ||||||
Untargeted metabolomics was performed to investigate the characteristic fecal metabolites in male and female VPA rats. PCA (Fig. 2A–D), OPLS-DA (Fig. 2E–H) and model validation (Fig. 2I–L) revealed that in both sexes, the distribution of samples between VPA and Ctrl rats was different, implying a significant difference in fecal metabolites. Between the mCtrl and mVPA groups, we detected 51 annotated differentially abundant metabolites (Fig. 2M,N, Supplementary Table 1). A total of 124 annotated differentially abundant metabolites were detected between the fCtrl and fVPA groups (Fig. 2O,P, Supplementary Table 2). Detailed information on these annotated differentially abundant metabolites is shown in Supplementary Table 1 and Supplementary Table 2. These results indicated that fecal metabolite levels were altered in both sexes of adolescent VPA rats.
 Fig. 2.
The difference in fecal metabolites in different sexes between the Ctrl and VPA rats. (A–D) Principal component analysis (PCA). (E–H) Orthogonal partial least squares discrimination analysis (OPLS-DA). (I–L) OPLS-DA model validation. (M–P) Volcano map of differentially abundant metabolites. mCtrl, male control group; mVPA, male VPA group; fCtrl, female control group; fVPA, female VPA group.
We further analyzed these annotated differentially abundant metabolites in KEGG
pathways. Between the mVPA and mCtrl groups, among the 51 annotated
differentially abundant metabolites, 7 metabolites participated in 10 specific
KEGG pathways (Table 3, Fig. 3A) and were significantly enriched in 1 KEGG
pathway named the pathway for cyanoamino acid metabolism (p = 0.0027,
FDR = 0.0159, Fig. 3A). Among the 7 metabolites, we focused on 4 metabolites with
VIP
 Fig. 3.
KEGG analysis of fecal metabolites in male VPA rats. (A) KEGG pathway enrichment column chart in male VPA rats. The abscissa is the name of KEGG pathway. (B–E) Receiver operator characteristic curves of the four characteristic fecal metabolites. (B) Hesperetin. (C) Linamarin. (D) Melphalan. (E) Protoanemonin.
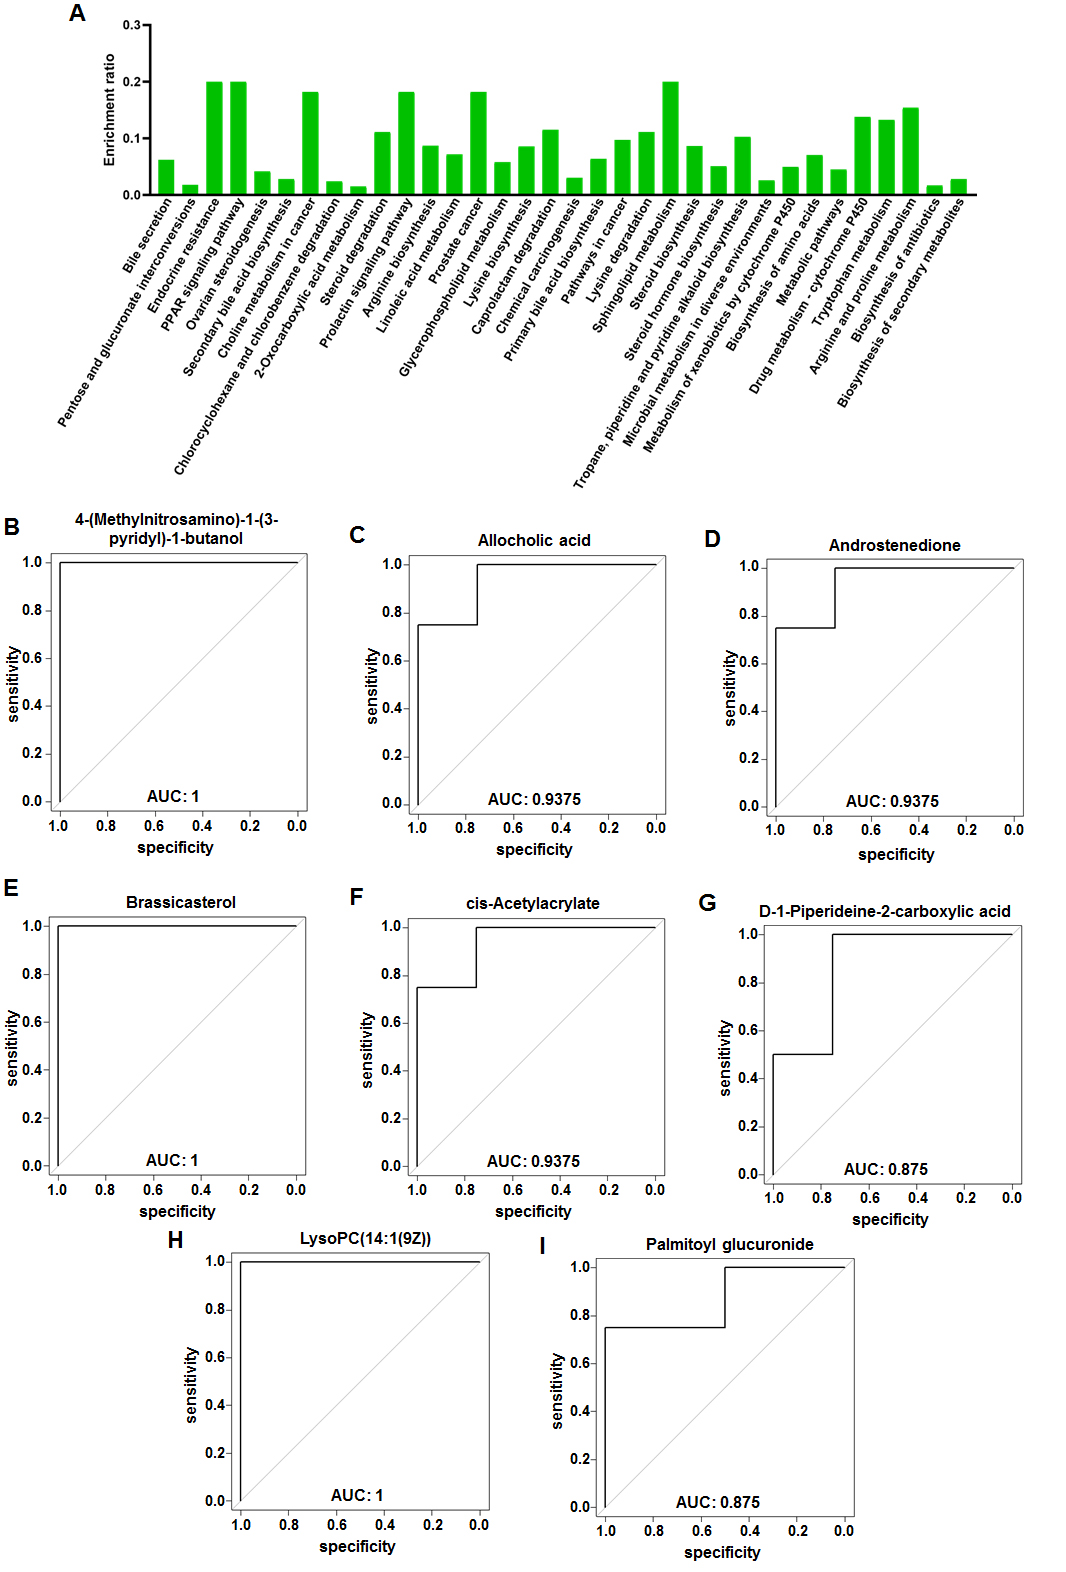 Fig. 4.
KEGG analysis of fecal metabolites in female VPA rats. (A) KEGG pathway enrichment column chart in female VPA rats. The abscissa is the name of KEGG pathway. (B–I) Receiver operator characteristic curves of the eight characteristic fecal metabolites. (B) 4-(Methylnitrosamino)-1-(3-pyridyl)-1-butanol. (C) Allocholic acid. (D) Androstenedione. (E) Brassicasterol. (F) cis-Acetylacrylate. (G) D-1-Piperideine-2-carboxylic acid. (H) LysoPC(14:1(9Z)). (I) Palmitoyl glucuronide.
| Description | kegg_id | ESI mode | m/z | mCtrl | mVPA | VIP | FC | p-value | State | AUC |
| Melphalan | C07122 | neg | 303.0671 | 7333 |
4264 |
2.41 | 1.61 | 0.0250 | down | 0.9375 |
| Hesperetin | C01709 | neg | 301.0731 | 9207 |
5515 |
2.35 | 1.52 | 0.0070 | down | 1 |
| Protoanemonin | C07090 | pos | 97.0288 | 54478 |
31607 |
2.29 | 1.71 | 0.0079 | down | 1 |
| Linamarin | C01594 | pos | 248.1128 | 527502 |
330320 |
2.01 | 1.65 | 0.0280 | down | 0.875 |
| gamma-Glutamyl-beta-cyanoalanine | C05711 | pos | 244.0927 | 208316 |
131107 |
1.95 | 1.52 | 0.0418 | down | 0.875 |
| Fluorouracil | C07649 | neg | 259.0284 | 5967 |
3989 |
1.82 | 1.55 | 0.0484 | down | 0.9375 |
| 19-Hydroxytestosterone | C05294 | pos | 305.2102 | 16045 |
11206 |
1.53 | 1.60 | 0.0325 | down | 0.9375 |
| m/z, mass-to-charge ratio; neg, negative ionization scanning mode; pos, positive ionization scanning mode; VIP, variable importance in projection; FC, fold change (mCtrl vs mVPA); up, the level of metabolite increased in mVPA group; down, the level of metabolite decreased in mVPA group; AUC, area under the curve (mCtrl vs mVPA). | ||||||||||
| Description | kegg_id | ESI mode | m/z | fCtrl | fVPA | VIP | FC | p-value | State | AUC |
| cis-Acetylacrylate | C07091 | neg | 227.0569 | 24604 |
14770 |
2.84 | 1.52 | 0.0194 | down | 0.9375 |
| 4-(Methylnitrosamino)-1-(3-pyridyl)-1-butanol | C19574 | pos | 419.2412 | 39016 |
22277 |
2.64 | 1.72 | 0.0022 | down | 1 |
| Androstenedione | C00280 | pos | 287.2001 | 24223 |
13907 |
2.59 | 1.85 | 0.0218 | down | 0.9375 |
| LysoPC(14:1(9Z)) | C04230 | neg | 464.2762 | 32012 |
50873 |
2.46 | 0.63 | 0.0044 | up | 1 |
| Brassicasterol | C08813 | pos | 421.3453 | 77492 |
124220 |
2.29 | 0.65 | 0.0044 | up | 1 |
| Palmitoyl glucuronide | C03033 | pos | 441.2833 | 8607 |
13774 |
2.17 | 0.63 | 0.0288 | up | 0.875 |
| D-1-Piperideine-2-carboxylic acid | C04092 | neg | 253.1191 | 4392 |
6522 |
2.16 | 0.57 | 0.0426 | up | 0.875 |
| Allocholic acid | C00695 | pos | 431.2775 | 46091 |
30143 |
2.06 | 1.53 | 0.0144 | down | 0.9375 |
| N-Acetyl-L-glutamate 5-semialdehyde | C01250 | pos | 174.0760 | 245595 |
350596 |
1.87 | 0.56 | 0.0494 | up | 1 |
| Cyclohexylamine | C00571 | pos | 100.1124 | 11756 |
16922 |
1.82 | 0.56 | 0.0187 | up | 1 |
| 13S-hydroxyoctadecadienoic acid | C14762 | pos | 297.2418 | 853059 |
584732 |
1.77 | 1.67 | 0.0385 | down | 0.9375 |
| N-Succinyl-2-amino-6-ketopimelate | C04462 | neg | 288.0728 | 71610 |
51309 |
1.72 | 1.55 | 0.0425 | down | 0.9375 |
| Kynurenic acid | C01717 | pos | 190.0495 | 14068 |
19623 |
1.69 | 0.64 | 0.0219 | up | 1 |
| 3-Carbamoyl-2-phenylpropionaldehyde | C16587 | neg | 192.0658 | 25669 |
19095 |
1.47 | 1.59 | 0.0222 | down | 1 |
| Phytosphingosine | C12144 | pos | 318.2996 | 86653 |
113174 |
1.35 | 0.66 | 0.0360 | up | 0.9375 |
| m/z, mass-to-charge ratio; neg, negative ionization scanning mode; pos, positive ionization scanning mode; VIP, variable importance in projection; FC, fold change (fCtrl vs fVPA); up, the level of metabolite increased in fVPA group; down, the level of metabolite decreased in fVPA group; AUC, area under the curve (fCtrl vs fVPA). | ||||||||||
We used Pearson correlation coefficients to assess the correlation between characteristic genera and fecal metabolites. Fig. 5A shows the correlation between 4 characteristic metabolites and 8 characteristic genera in male VPA rats. The abundance of hesperetin and protoanemonin negatively correlated with that of Candidatus_Soleaferrea and Desulfovibrio. In addition, the abundance of protoanemonin negatively correlated with that of Ruminococcus_2. Fig. 5B shows the correlation between 8 characteristic metabolites and 5 characteristic genera in female VPA rats. The abundance of Ruminiclostridium, Acetatifactor and [Eubacterium]_xylanophilum_group positively correlated with that of brassicasterol, allocholic acid, palmitoyl glucuronide and D-1-piperideine-2-carboxylic acid but negatively correlated with that of 4-(methylnitrosamino)-1-(3-pyridyl)-1-butanol. The abundance of Acetatifactor and [Eubacterium]_xylanophilum_group positively correlated with that of LysoPC(14:1(9Z)) but negatively correlated with that of androstenedione. In addition, the abundance of cis-acetylacrylate negatively correlated with that of Ruminiclostridium, Acetatifactor and Candidatus_Saccharimonas. Correlation analysis revealed a tight relationship between the GM and fecal metabolites in VPA rats of both sexes. The results of the correlation between characteristic genera and characteristic fecal metabolites in VPA rats also showed sex-specific differences.
 Fig. 5.
Correlation analysis of gut microbiota and fecal
metabolites in male and female VPA rats. (A) Correlation heatmap between sixteen
characteristic fecal metabolites and eight characteristic genera in abundance in
male VPA rats. (B) Correlation heatmap between sixteen characteristic fecal
metabolites and eight characteristic genera in abundance in female VPA rats. The
legend on the right is the color range of different R values. The abscissa
represents characteristic genera, and the ordinate represents characteristic
fecal metabolites.
Sex-specific differences have been found in many diseases. Among these diseases, ASD is well acknowledged because of the typically male-biased morbidity [6, 7]. Coretti et al. [33] investigated sex-related alterations in GM composition in BTBR mice, a well-established mouse model of autism. They detected sex-related differences in BTBR mice and identified Bacteroides, Parabacteroides, Sutterella, Dehalobacterium and Oscillospira as key genera of sex-specific GM profiles. Foley et al. [50] found that adolescent male rats prenatal exposure to propionic acid showed increased levels of locomotor activity compared with female rats. These results suggested that the mechanism of ASD is different between sexes. However, to our knowledge, few studies have investigated the sex-specific differences in GM and fecal metabolites as well as the underlying mechanisms in individuals with ASD or other animal models of ASD. These problems need to be deeply explored.
A single intraperitoneal injection of VPA in the second trimester of pregnant rats is well known to establish a rat autism model in offspring [44, 45]. This model manifests characteristic autism symptoms and has been widely accepted to be useful for exploration of the pathogenesis of ASD [51, 52, 53, 54]. Recently, Liu et al. [43] investigated the taxonomical characterization of the GM in male and female VPA rats. They found that the fecal samples of VPA rats showed reduced microbial richness as well as altered composition and metabolite potential of the microbial community. These features are similar to those in ASD individuals, suggesting that VPA rats might be suitable to detect the true variations in the GM and fecal metabolites of ASD. Based on these studies, we chose VPA rats as the animal model in the present study. We revealed the taxonomical characterization of the GM and the features of fecal metabolites in VPA rats and explored the underlying mechanism of ASD based on affected pathways in the KEGG database. Based on these data, we analyzed the correlation between characteristic GM and fecal metabolites in VPA rats. Sex-specific differences were also detected due to the substantial difference in morbidity between different sexes.
First, we analyzed the fecal samples by 16S rRNA gene sequencing. The richness and diversity of the GM showed no significant differences between VPA and Ctrl rats in either sex, which is different from a previous study [41]. PCoA showed that the overall composition of the GM was different between fVPA and fCtrl rats but not male rats. The results of characteristic genera and relative abundance showed noticeable sex-specific differences, suggesting that different probiotics might be used to treat male and female ASD patients. Interestingly the alteration of the F/B ratio was different between the different sexes, although the change was not statistically significant. Firmicutes and Bacteroidetes are the two most abundant bacterial phyla in the intestine. An altered F/B ratio is tightly related to ASD and obesity [24, 32, 46, 55, 56, 57], but the results in different studies are inconsistent. The incidence of obesity is significantly increased in ASD individuals [57, 58, 59, 60, 61], while the body weight of VPA rats is significantly lighter than that of Ctrl rats [49, 51]. Thus, it is difficult to speculate on the internal mechanism of the altered F/B ratio in the pathogenesis of ASD. Additional studies are needed in the future. In addition, correlation analysis showed a tight relationship between characteristic GM and characteristic fecal metabolites in both sexes of VPA rats, suggesting that the GM may influence the pathogenesis involving fecal metabolites.
In contrast to former studies, we used untargeted metabolomics to detect the differentially abundant fecal metabolites and analyzed them in the KEGG database. Between the mVPA and mCtrl groups, we detected 51 annotated differentially abundant fecal metabolites and identified 1 enriched KEGG pathway, namely, the pathway for cyanoamino acid metabolism. Seven characteristic fecal metabolites were determined to distinguish male VPA rats. Between the fVPA and fCtrl groups, 124 annotated differentially abundant fecal metabolites were detected with no enriched KEGG pathways being identified. Fifteen characteristic fecal metabolites to distinguish female VPA rats were determined. The enriched KEGG pathways and the characteristic fecal metabolites showed obvious sex-specific differences. Some results had been reported previously. For example, hesperetin was shown to ameliorate social behavior deficits and oxido-inflammatory stress in a rat autism model [62]. Alteration of bile acid metabolism has been shown to be associated with gastrointestinal dysfunction in BTBR mice, a mouse model of autism [63]. Correlation analysis showed a tight relationship between characteristic GM and characteristic fecal metabolites in both sexes of VPA rats, suggesting that the GM may influence the pathogenesis involving fecal metabolites. The abundance of Candidatus_Soleaferrea and Desulfovibrio negatively correlated with that of hesperetin, suggesting that these 2 genera might exacerbate autism-like behavior. Tomova et al. and Zurita et al. [21, 25] reported that the abundance of Desulfovibrio is significantly elevated in the fecal samples of children with ASD, which is consistent with our results. However, in most studies, only male animals were involved. These results might not hold true in female ASD animal models or female ASD patients. In the future, the above enriched KEGG pathways and characteristic metabolites might be research directions for exploring ASD therapy. Both male and female patients or animal models should be involved and analyzed separately.
This study has some limitations. First, the number of animals included in our study was slightly small (n = 4). Second, in this study, we analyzed sex-specific differences, not sex-related differences, in the GM and fecal metabolites of VPA rats. That is, we did not analyze the differences between sexes. On the basis of our knowledge, it is suggested that differential metabolites should be screened between two groups. Sex-related alterations of the GM and fecal metabolites in patients with ASD or animal models of ASD might be analyzed in the future when differential metabolites could be screened among 3 or more groups. Finally, the omics results need to be verified by further research, such as molecular biology studies.
In general, we used 16S rRNA gene sequencing and untargeted metabolomics to explore the characteristics of fecal metabolites and the GM in male and female VPA rats. Dysbacteriosis existed in the fecal samples of both male and female VPA rats, with sex-specific differences. The specific alteration of the GM and fecal metabolites may play a crucial role in the pathogenesis of ASD. This is the first study focusing on sex-specific differences in fecal metabolites and KEGG pathways in VPA-induced rat autism model. According to our results, the mechanism of ASD might be very different between male and female patients, suggesting that in future ASD studies, both male and female patients or animal models should be involved and analyzed separately. ASD therapy might be different between sexes in the future.
YYG, YH and JQ designed the study; YNC, JJL and SBZ performed 16S rRNA gene sequencing and untargeted metabolomics; BZ and YZ analyzed the experiments data and graphed. YH and JQ approved the manuscript; YYG finalized the manuscript.
The animal experimental procedures were approved by Animal Care and Use Committee of Peking University People’s Hospital (2019PHE007).
We express our appreciation to all members of Laboratory Animal Center of Peking University People’s Hospital for their assistance with maintenance of rats.
This work was supported by Natural Science Foundation of Beijing (S170003) and Beijing Municipal Key Clinical Specialty Program (2018).
The authors declare no conflict of interest.
5-HT, 5-hydroxytryptamine; ASD, autism spectrum disorder; AUC, area under the curve; CNS, center nervous system; Ctrl, control; DNA, deoxyribonucleic acid; F/B, Firmicutes/Bacteroides; FC, fold change; FDR, false discovery rate; GI, gastrointestinal; GM, gut microbiota; KEGG, Kyoto Encyclopedia of Genes and Genomes; UHPLC-MS, ultra-high-performance liquid chromatography-mass spectrometry; LEfSe, linear discriminant analysis effect size; NS, normal saline; OPLS-DA, orthogonal partial least squares discrimination analysis; OTU, operational taxonomic unit; PCA, principal component analysis; PCoA, principal coordinate analysis; PCR, polymerase chain reaction; PND, postnatal day; QC, quality control; ROC, receiver operator characteristic; rRNA, ribosomal ribonucleic acid; VIP, variable important in projection; VPA, valproic acid.