
† These authors contributed equally.
Academic Editor: Graham Pawelec
Introduction: The molecular mechanisms underlying acute exacerbations (AEs) of idiopathic pulmonary fibrosis (IPF) are poorly understood. To understand the gene expression patterns of the AEs of IPF, we studied gene expression profiling of AEs of IPF. Methods: The GEO datasets included in this study are GSE44723 and GSE10667, and in-house RNA-seq data were used. DEG analysis used the limma package, and the STRING database was used to construct the protein-protein interaction (PPI) network, and its functional role was investigated through gene ontology analysis. Results: The results of DEG analysis indicated 76 upregulated and 135 downregulated genes associated with an AE of IPF compared to stable IPF. The PPI network included three core modules containing 24 of the 211 DEGs. Eleven upregulated and six downregulated genes were evident in AEs of IPF compared with stable IPF after validation. The upregulated genes were associated with cell division. The downregulated genes were related to skeletal muscle differentiation and development. Conclusion: In previous studies, 17 genes were strongly associated with cell proliferation in various cell types. In particular, cyclin A2 (CCNA2) was overexpressed in the alveolar epithelium of the lungs presenting AEs of IPF. Aside from the previously described CCNA2, this study reveals 16 genes associated with AEs of IPF. This data could indicate new therapeutic targets and potential biomarkers for the AEs of IPF.
Idiopathic pulmonary fibrosis (IPF) is a progressive fibrotic lung disease with no clear etiology [1]. Currently, antifibrotic drugs constitute the main pharmacotherapy, with robust evidence from clinical studies [2]. Pirfenidone and nintedanib reportedly modestly reduce annual lung function decline. However, the specific molecular targets of these agents in the pathogenesis of IPF are not fully understood. Additionally, IPF presents with a wide spectrum of clinical phenotypes, especially during disease progression. The underlying molecular background of the various phenotypes is unknown, and molecular biomarkers of disease progression are lacking.
Among the wide variety of individual clinical courses, rapid acute decline in lung function, known as acute exacerbation (AE), occurs annually in many patients [3]. The optimal therapy for the AE of IPF has not been established. Although randomized trial data are lacking, treatment commonly involves systemic glucocorticoids [4]. Although lung transplantation provides a chance of survival, for those with acute deterioration, the perioperative risks of transplantation are clearly greater. For individuals transplanted in the context of mechanical ventilation or extracorporeal membrane oxygenation, short- and long-term survival after lung transplantation is decreased compared with that of stable patients undergoing lung transplantation [5]. Unfortunately, without transplantation, the median survival following an AE of IPF is only three to four months [6, 7].
Several previous studies identified the genes and/or pathways of IPF that are differentially expressed in comparison with the controls; thus, providing molecular signatures for IPF [8, 9, 10, 11, 12]. Furthermore, the peripheral blood profiling of IPF has suggested potential biomarkers. While these studies indicate pathways that could contribute to early, stable, or progressive IPF, knowledge of the pathways and mechanisms that contribute to the AEs of IPF remains limited. Few studies have screened differentially expressed genes (DEGs) associated with an AE of IPF using bioinformatics methods [13, 14]. Identifying the differences between steadily progressing IPF and the AEs of IPF can help in understanding the nature of the AEs. This knowledge would likely be valuable in the development of treatments for the AEs of IPF.
The present study investigated DEGs between cases of stable IPF and AE of IPF through the RNA sequencing (RNA-seq) of lung tissue and determined the hub genes via functional assays.
Explanted lung tissue samples for RNA sequencing analysis were obtained from the Pusan National University Yangsan Hospital (PNUYH) biobank. These included lung tissues from three patients with IPF and lung tissues from three patients with AEs of IPF. The criteria for the diagnosis of IPF were those of the American Thoracic Society and European Respiratory Society [14]. An AE of IPF was defined as an acute, clinically significant respiratory deterioration characterized by evidence of new widespread alveolar abnormality according to the 2016 revised criteria [4]. All cases were reviewed by expert pulmonologists and pathologists. Detailed clinical information regarding the subjects is provided in Table 1. The mean forced vital capacity (expressed as a percentage of the normal expected value; FVC %) and diffusing capacity for carbon monoxide (expressed as a percentage of the normal expected value; DLCO %) of patients are provided in Table 1. Lung tissue acquisition and analysis were conducted with the appropriate approval from the Institutional Review Board of Pusan National University Yangsan Hospital (PNUYH IRB No 05-2020-019).
| Variable | Stable IPF (n = 3) | AE of IPF (n = 3) |
| Age | 64.3 |
59.0 |
| Male | 3 (100) | 3 (100) |
| FVC % | 58.7 |
42 |
| DLCO % | 47.3 |
34.0 |
| Data presented as mean *denotes the last before AE of IPF. | ||
Total RNA from cell samples was extracted using a TRIzol reagent kit
(Invitrogen), according to the manufacturer’s protocol, and RNA integrity was
assessed using a TapStation RNA screentape. After total RNA extraction, RNA
libraries were independently prepared using the Illumina TruSeq Stranded Total
RNA Library Prep Gold Kit (Illumina, Inc., San Diego, CA, USA). The cleaved RNA
fragments were copied into first-strand cDNA using SuperScript II reverse
transcriptase (Invitrogen, Carlsbad, CA, USA) using random primers. Qualified
libraries were sequenced on an Illumina NovaSeq platform (Illumina, Inc., San
Diego, CA, USA). Total RNA concentration was calculated using the Quant-IT
RiboGreen Assay Kit (Invitrogen, Waltham, MA, USA). To determine the values of
DV200 (percentage of RNA fragments
Expression profiling array data for IPF was obtained from the Gene Expression Omnibus (GEO) database (http://www.ncbi.nlm.nih.gov/geo/; accession numbers GSE44723 and GSE10667). All datasets included data related to gene expression in the lung tissue of the AE group and/or that of the stable IPF group. The data were downloaded for DEG analysis. The characteristics of the included datasets are listed in Table 2 (Ref. [15, 16]).
| GSE10667 | GSE44723 | PNUYH | ||||
| Stable | Acute exacerbation | Stable | Acute exacerbation | Stable | Acute exacerbation | |
| Type of tissue | Lung tissue | Lung tissue | Lung tissue | |||
| Platform | AGILENT-014850 Whole Human Genome Microarray 4 |
Affymetrix Human Genome U133 Plus 2.0 Array | Illumina NovaSeq 6000 | |||
| Sample size | 23 | 8 | 6 | 4 | 3 | 3 |
| References | Konishi K et al., 2009 [15] | Sridhar S et al., 2013 [16] | ||||
DEGs of each dataset were identified using the GEO2R online analytic tool
provided by GEO. Adjusted p
A PPI network was constructed using the Search Tool for the Retrieval of Interacting Genes (STRING) database [22] to identify the relevant pathways and functions of common DEGs. The minimum required interaction score used to construct the PPI network was 0.4. The molecular complex detection (MCODE) [23] was used for optimal module selection. The parameters used in MCODE were: degree cutoff = 2; cluster finding, node score cutoff = 0.2; k-core = 2; and maximum depth = 100. CytoHubba [24] was used to identify the highest-linkage hub genes in the network. The parameters used in CytoHubba were the top 10 nodes ranked by degree and the display option in which the expanded subnetwork was displayed.
GO analyses were performed using the R package “clusterProfiler” (v 3.14.3)
[25]. The common DEGs identified in each dataset were included in the GO term
enrichment analysis, which was performed separately for up- and downregulated
genes. Terms with five or more associated genes and two or more DEGs in each
experiment were included. The adjusted p-values were calculated using
the Benjamini-Hochberg method. Statistical significance was set at p
The flowchart for this study is shown in Fig. 1. Detailed information on the datasets is presented in Table 1. DEG analysis of GSE10667 identified 4155 DEGs, of which 1832 genes were upregulated and 2325 genes were downregulated (Fig. 2). DEG analysis of PNUH RNA-seq identified 1819 DEGs, of which 897 genes were upregulated and 922 genes were downregulated (Fig. 2). DEG analysis results for each dataset are in Supplementary files2.1, 2.2, and 2.3. We performed GO analysis of common DEGs and the results are in Supplementary files 2.4 and 2.5. Overlapping genes in each dataset included 76 upregulated genes and 135 downregulated genes, and the included genes list is in Supplementary files 2.6.
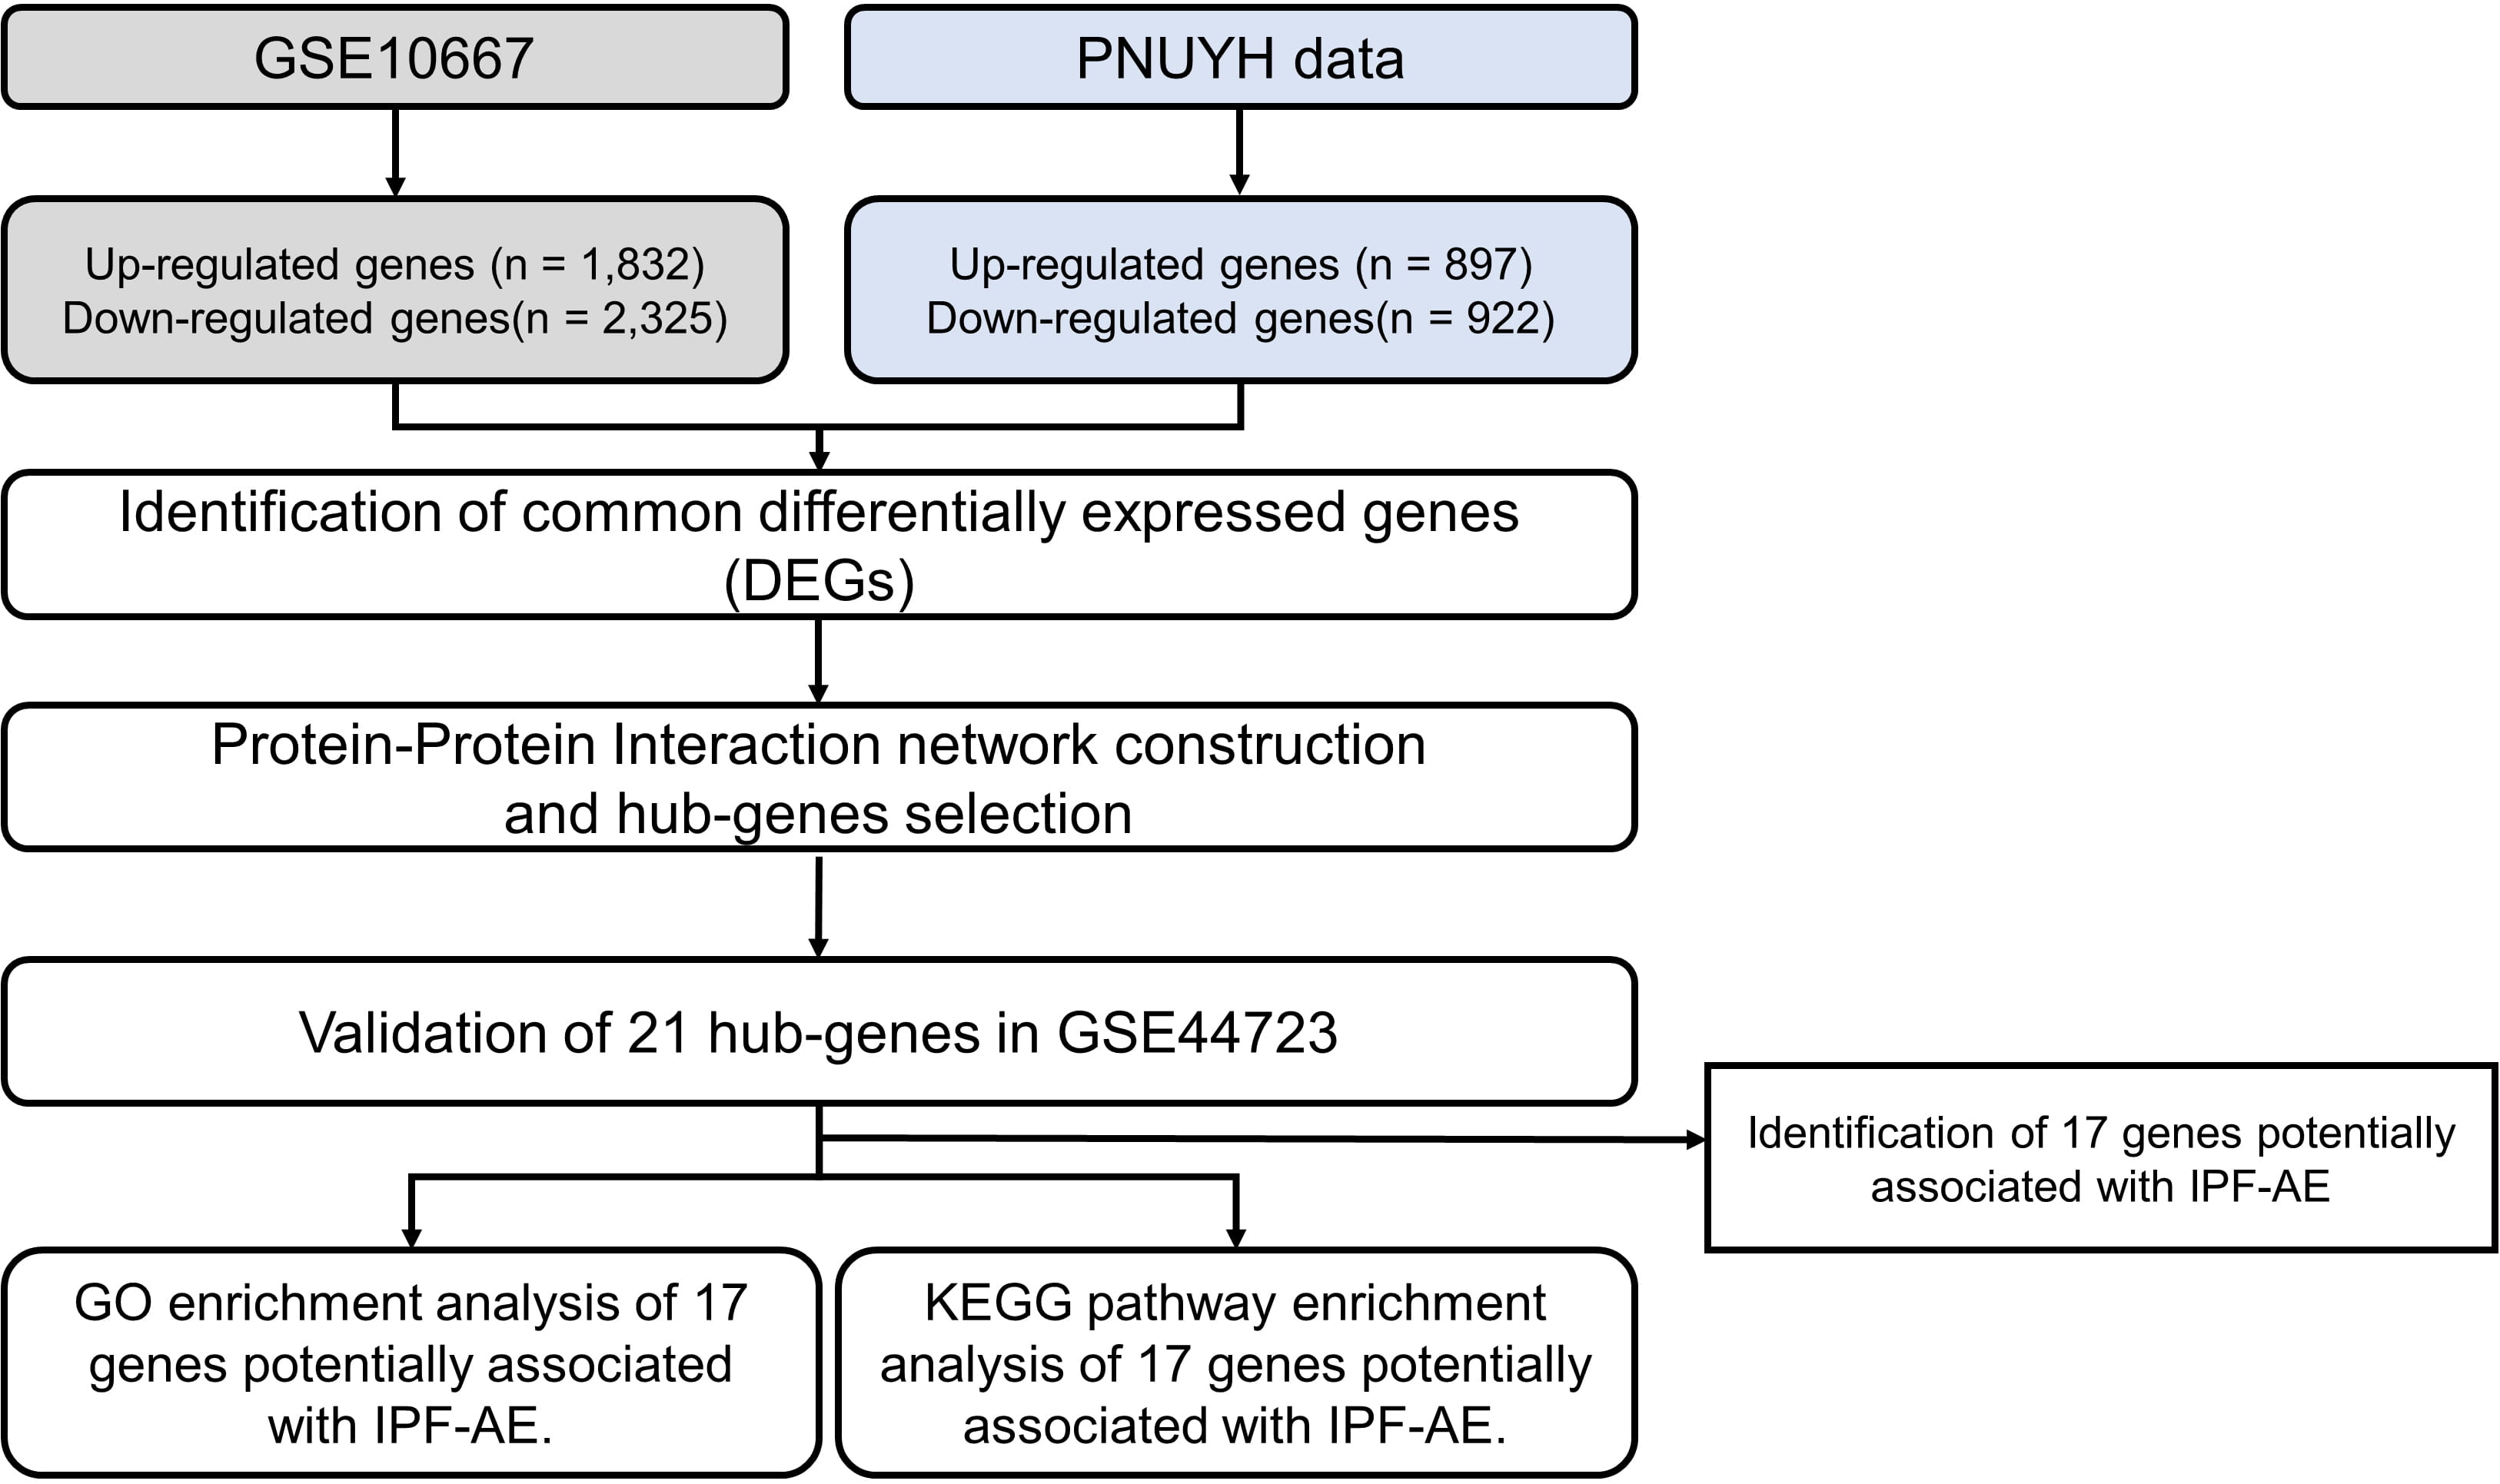 Fig. 1.
Flow chart of the study.
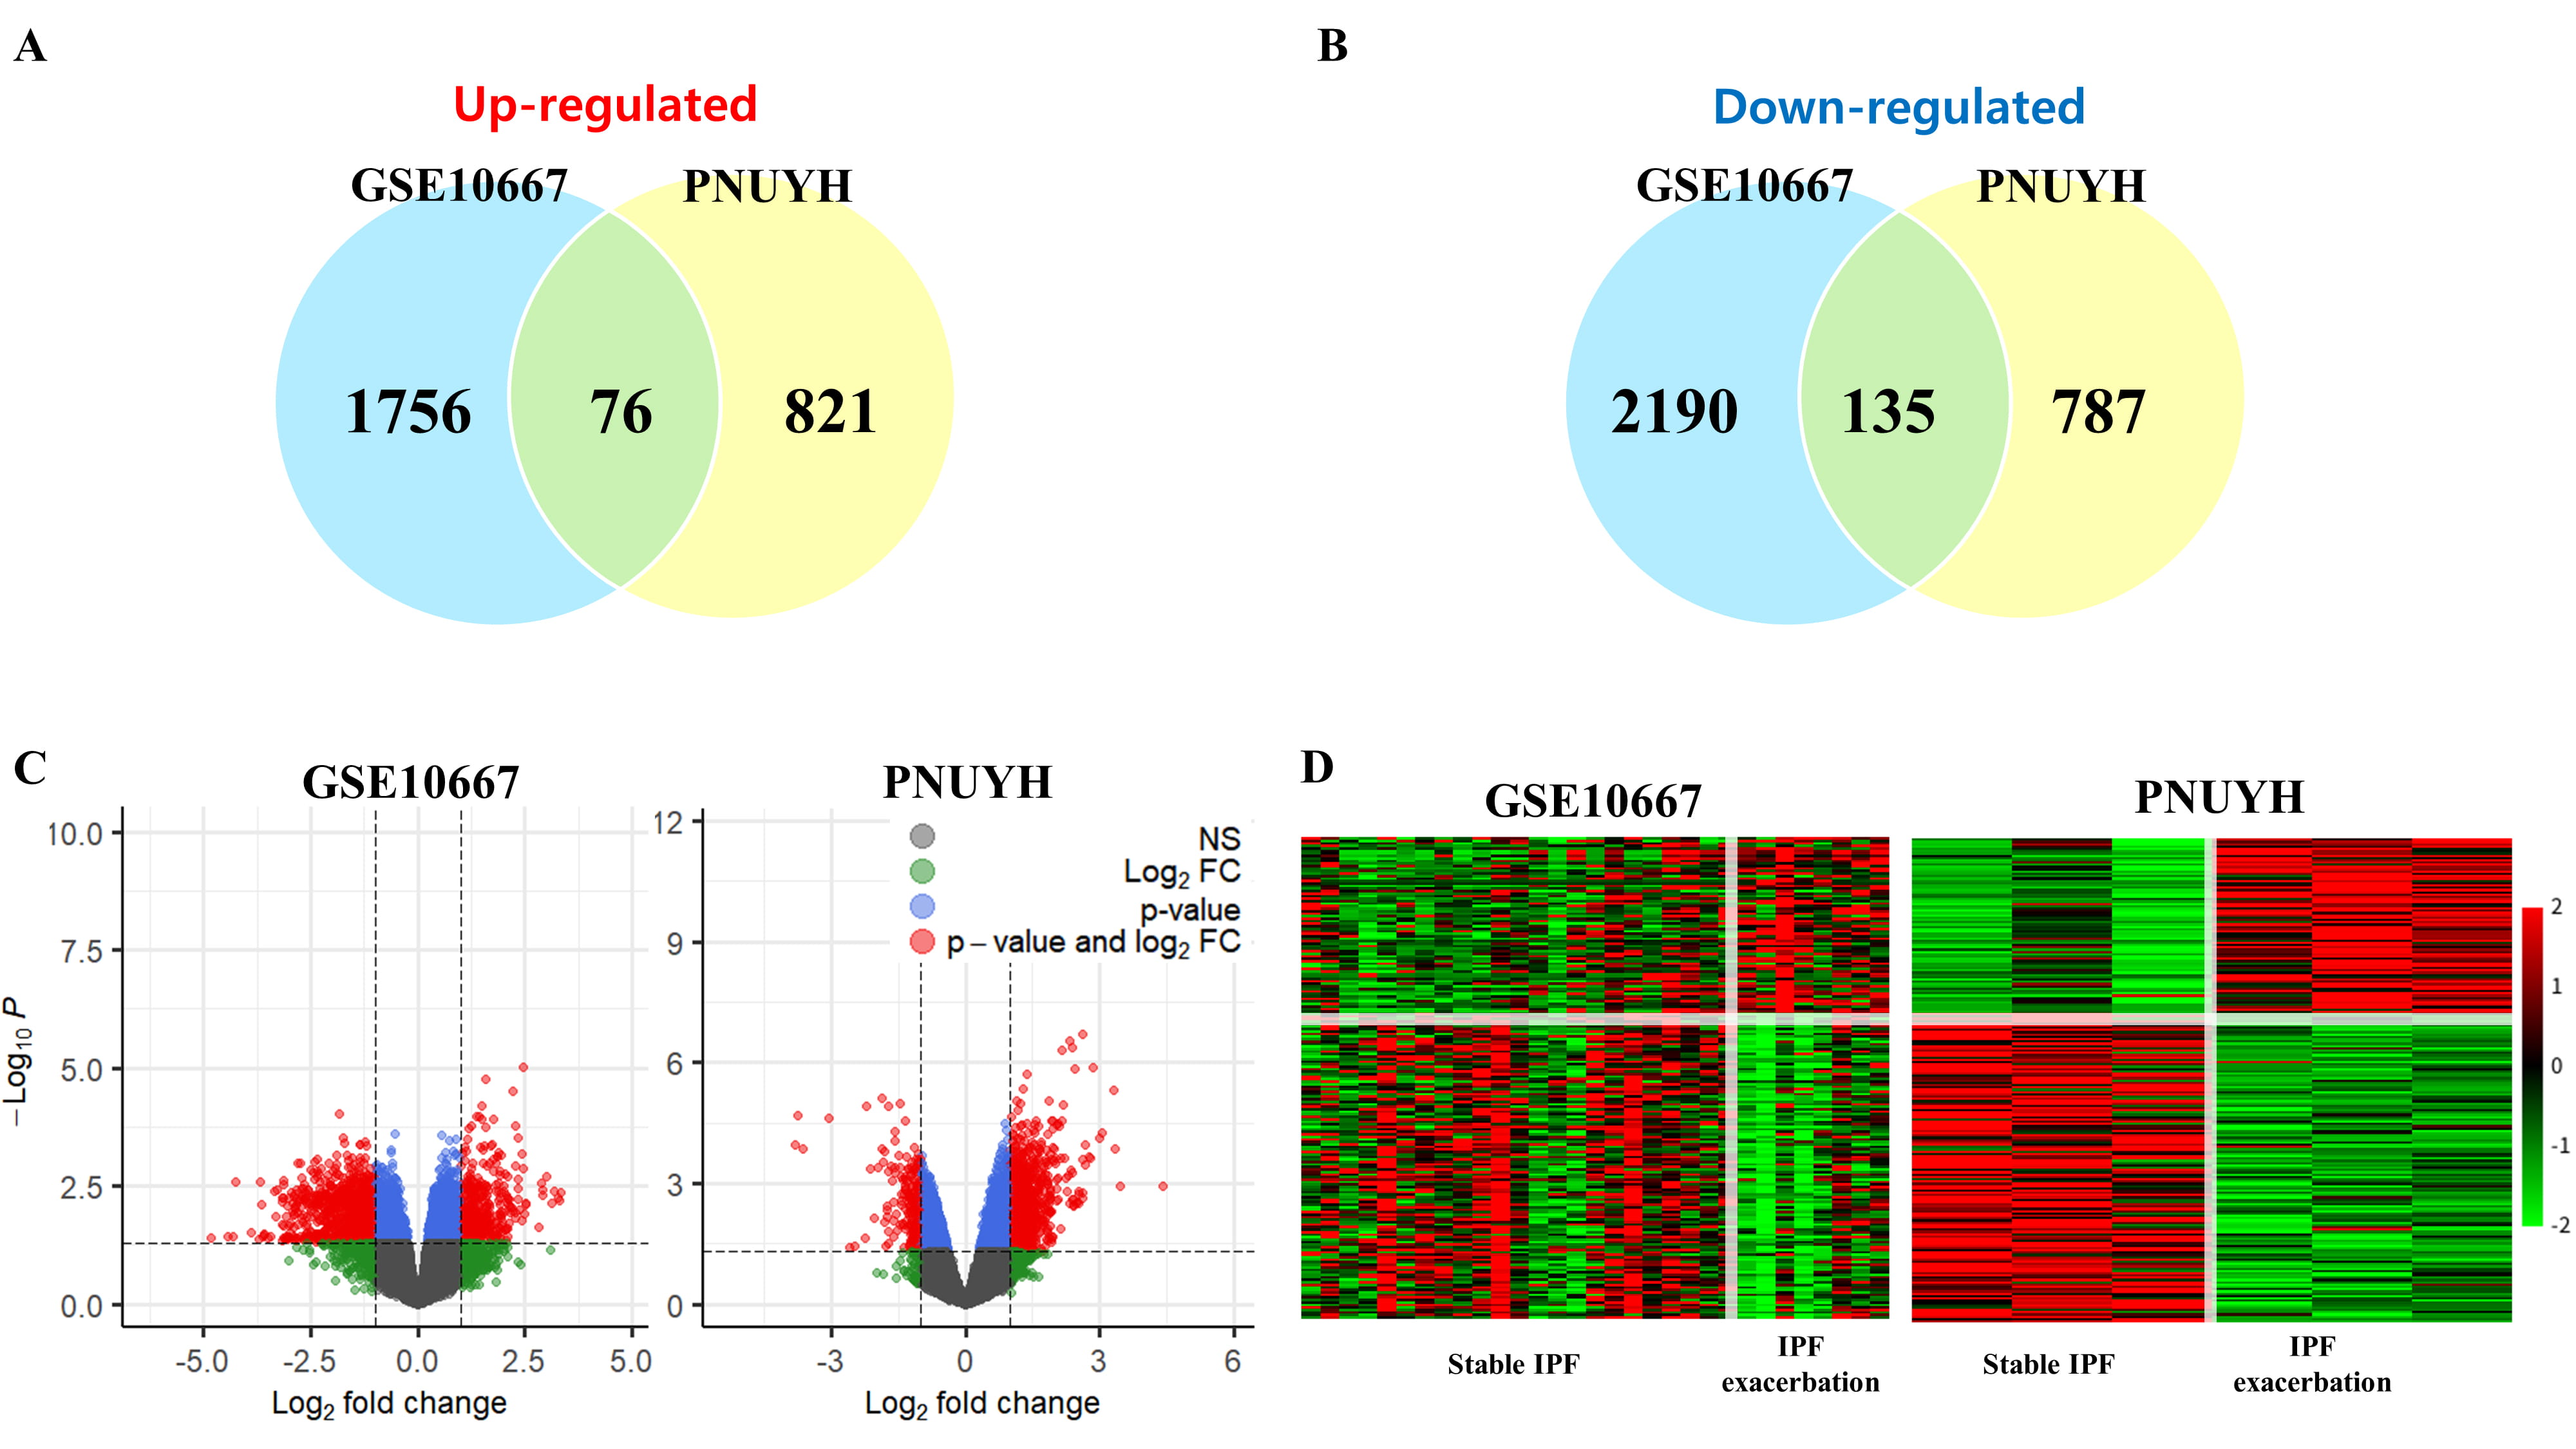 Fig. 2.
Analysis of the differentially expressed genes. (A) Venn
diagram of upregulated genes. (B) Venn diagram of downregulated genes. (C)
Volcano plot of each cohort. In the plot, genes that met the p-value and
log
To identify the PPIs of common DEGs, the STRING network-based protein
interaction assay was used to create a PPI network. To confirm the interaction
between common DEGs, a PPI network was constructed. Three significant modules
(confidence score
 Fig. 3.
Protein-protein interaction (PPI) network construction and significant module selection involving the common differentially expressed genes (DEGs). (A) PPI network of upregulated genes. (B) PPI network of downregulated genes. (C) The module with the highest confidence score among the PPI network of upregulated genes. (D) Module with the second-highest confidence score among the PPI network of upregulated genes. (E) The module with the highest confidence score among the PPI network of downregulated genes.
To validate the genes included in significant modules, the independent cohort GSE44723 was used. Eleven upregulated genes (ASPM, CCNA2, CDC25B, CENPE, CLSPN, KIF14, PTTG1, RECQL4,SKA3,SPAG5, and TROAP) and six downregulated genes (BTG2, CYR61, EGR1, FOS, FOSB, and NR4A1) were significantly altered in the cases presenting AEs of IPF compared to those presenting stable IPF (Fig. 4). Interestingly, the histone-associated genes and E2F7 gene were not significantly increased in AEs of IPF patients.
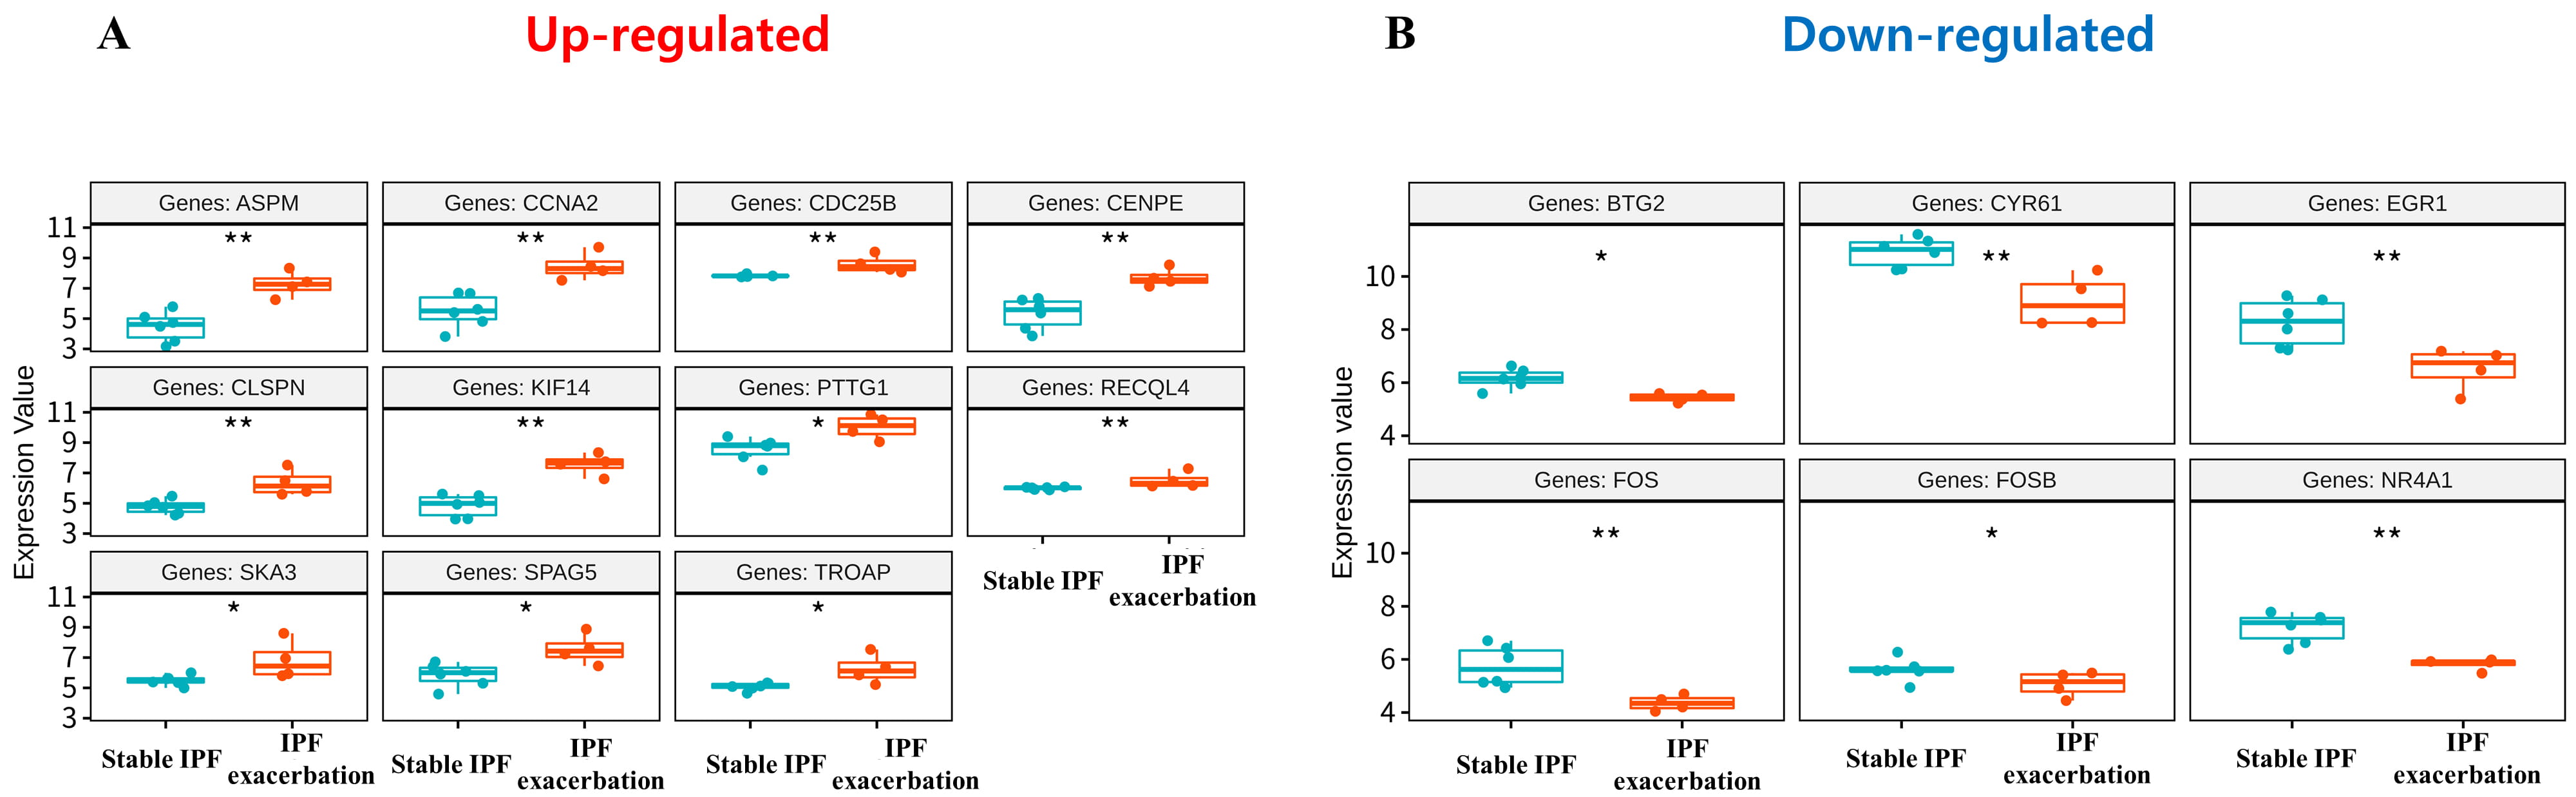 Fig. 4.
Boxplots of 17 genes with statistically significant differences in expression values in GSE44723 among 24 genes included in significant modules. (A) Upregulated genes. (B) Downregulated genes. The blue boxplot indicates stable IPF and the red boxplot indicates acute exacerbation of IPF.
To investigate the functional role and the associated signaling pathways of the common DEGs, GO analysis was performed. The total significantly enriched GO terms from the up- and downregulated common DEGs are shown in Fig. 5. The top biological processes (BPs) of the eleven upregulated and six downregulated genes associated with the AEs of IPF were nuclear division, organelle fission, skeletal muscle cell differentiation, skeletal muscle tissue development, skeletal muscle organ development, response to mechanical stimulus, regulation of neuron death, and neuron death, respectively. The top cellular components of the upregulated and downregulated genes were spindle and transcription regulator complexes. The top molecular functions were microtubule binding, tubulin binding, and RNA polymerase II-specific DNA binding transcription factor binding for upregulated proteins, and DNA binding transcription factor binding for downregulated proteins.
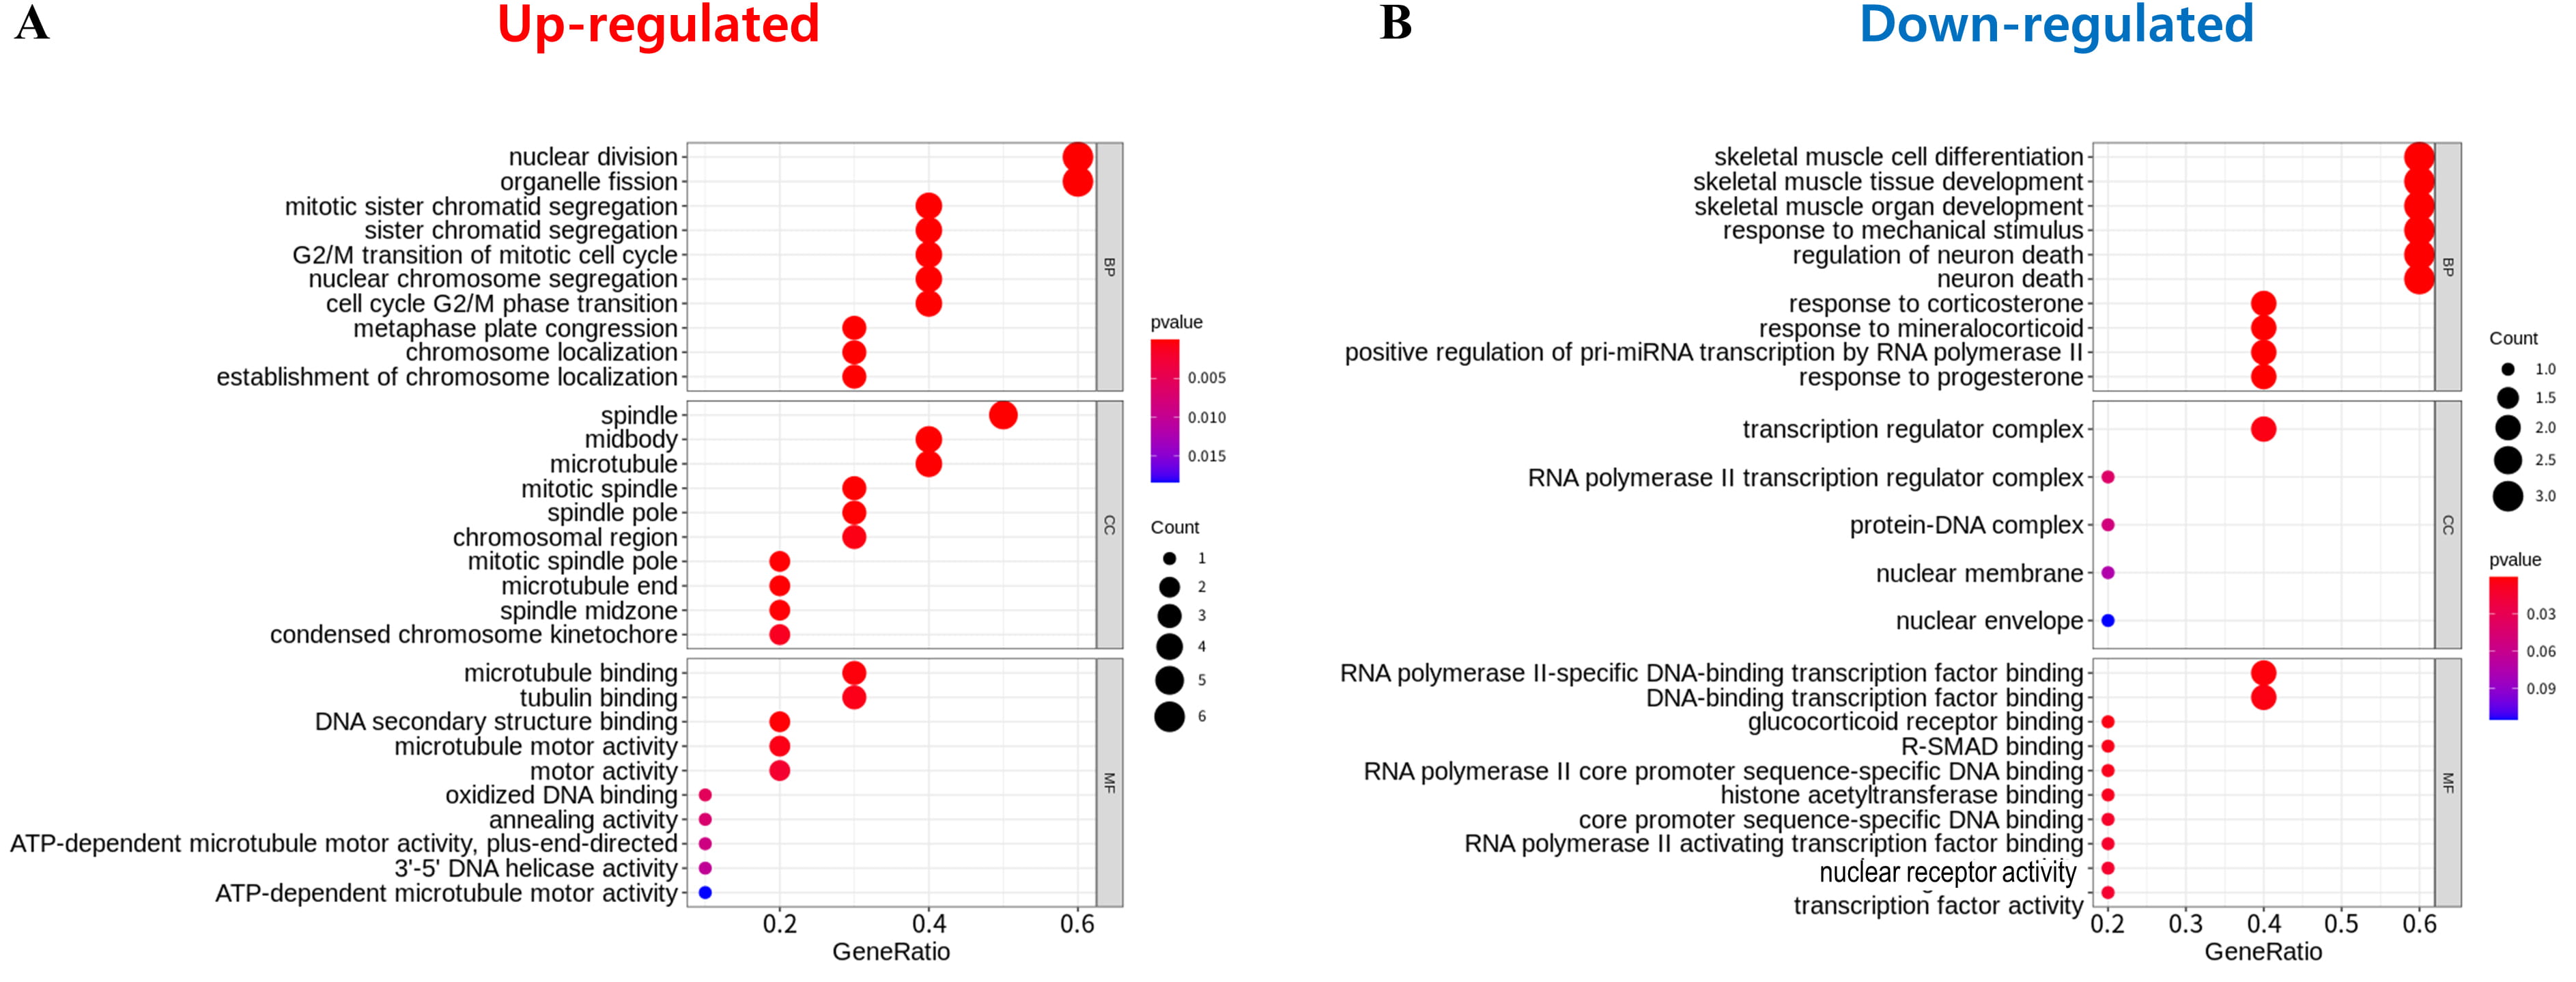 Fig. 5.
Gene ontology assay of 17 genes identified through protein–protein interaction network and module selection. (A) Upregulated genes. (B) Downregulated genes. The gene ontology analysis result is composed of biological process (BP), cellular component (CC), and molecular function (MF) terms. The top 10 of each term is shown. The size of the circle indicates the number of genes corresponding to each term. The closer to red, the lower the p-value.
The AE of IPF is a fatal disease phenotype, for which, there is presently no effective treatment. Annually, 10% to 15% of IPF cases have a potential risk of AE and the fatality rate exceeds approximately 90% [7]. To understand this refractory disease, genome-wide transcriptional profiling of different phenotypes of IPF may be carried out, which would further provide knowledge that could lead to an effective therapy for the AE of IPF.
Here, we selected cohorts from the GEO database (GSE10667 and GSE44723) to identify and validate the distinguishing molecular patterns associated with the AEs of IPF. The DEGs identified from the microarray data may be incorrect for reasons that include a lack of reproducibility and lack of prediction accuracy because of the small sample size [26]. To avoid possible problems, differential expression analysis was performed using the GSE10667 dataset and PNUYH RNA-seq data. The GSE44723 cohort was used to verify gene expression. Seventeen genes were potentially related to AEs of IPF after validation. The functional and signaling pathways of these genes were analyzed. In GO analysis, the upregulated genes were significantly enriched in cell division, such as mitotic sister chromatid segregation, nuclear division, and the G2/M transition of mitotic cell cycle. Several studies have demonstrated the respective upregulated genes to promote cell cycle progression and contribute to cell proliferation. SKA3 promotes cell proliferation and activates the phosphoinositide 3-kinase/Akt signaling pathway in cervical cancer [27]. Centrosome-associated protein E promotes cell proliferation in lung adenocarcinoma [28]. Kinesin family member 14 promotes cell proliferation via the activation of Akt [29]. In vitro, knockdown of trophinin associated protein significantly inhibits cell proliferation and the ability to transition from G1 to S phase [30]. Pituitary tumor transforming gene 1 overexpression enhances proliferation and upregulates the expression of cyclin B1, cyclin-dependent kinase 1, and c-Myc at both the protein and mRNA levels [31]. Claspin reportedly displayed a significantly higher relative increase in its levels than Ki67 in tumor samples compared with normal tissues, and was suggested as a marker of abnormal proliferation [32]. RecQ like helicase 4 and Sperm associated antigen 5 are essential for cell proliferation, cell cycle progression, and mitotic stability in human cells and promote DNA repair [33, 34]. Knockdown of cyclin A2 (CCNA2) inhibits colorectal cancer cell growth by impairing cell cycle progression and inducing apoptosis [35]. In particular, a prior study described that CCNA2 was overexpressed during AEs of IPF, unlike other genes, and appeared locally in the alveolar epithelium, but not in fibroblasts or myofibroblasts [14]. CCNA2 upregulation in AEs of IPF was confirmed in the present study. Eleven upregulated gene expression signatures, including CCNA2, could be potential biomarkers for evaluating patients with IPF.
The downregulated genes associated with AEs of IPF were FOS, BTG2, FOSB, CYR61, and NR4A1. GO analysis confirmed that they were most significantly enriched in skeletal muscle cell differentiation, development, and regulation of neuronal death. All downregulation was confirmed in previous studies to directly or indirectly affect cell proliferation when tumor suppressors are downregulated. Cysteine-rich angiogenic inducer 61 and nuclear receptor subfamily 4 group A member 1 inhibit cell proliferation as tumor suppressors in non-small cell lung cancer cells and triple-negative breast cancer, respectively [36, 37]. FOS and FOSB, also known together as “G0/G1 switch regulatory protein 3” in the FOS family, have been implicated as regulators of cell proliferation, differentiation, and transformation [38, 39]. BTG anti-proliferation factor 1 (BTG1) peaks in the G0/G1 phase of the cell cycle and decreases dramatically during the G1/S phase transition. This indicates that the overexpression of BTG1 normally inhibits cell growth [40]. Consistent with the results of the upregulated genes, the downregulated genes may affect cell proliferation.
Recently, many studies have addressed genomic alterations in specific diseases. Accordingly, tissue or blood sample RNA-seq, or single-cell RNA-seq data are providing a new paradigm for IPF research. However, RNA-seq data for AEs of IPF face some limitations. One of the main limitations is that it is very difficult to obtain tissue samples for tissue RNA-seq. In general, patients with AEs are critically ill, and tissue biopsy is not indicated, since it would further imperil the patients. In this study, we obtained whole Pleuroparenchymal fibroelastosis samples from explanted lungs after lung transplantation. This is a very rare and precious material for basic research on AEs of IPF. Because there were a limited number of samples, a pooled analysis was performed along with pre-existing dataset from other studies on AEs of IPF. To our knowledge, this is the first report of 17 genes involved in the AEs of IPF. The involvement of CCNA2 has been described previously. The remaining 16 genes described in this study are novel. It is essential to verify these genes through additional experiments. Pending these results, these genes may prove to be new therapeutic targets and potential predictive biomarkers for AEs of IPF.
YHJ, KYH, and CWH contributed to the conception of the work and critical revision of the manuscript. YHJ and CWH contributed to the data acquisition. KJ contributed to the interpretation of the data and analysis. KJ, YHJ, KYH, and CWH drafted and finalized the manuscript. All authors approved the submitted manuscript.
The study was approved by the appropriate approval from the Institutional Review Board (PNUYH IRB No 05-2020-019).
Not applicable.
This study was supported by the Research Institute for Convergence of Biomedical Science and Technology Grant (30-2019-004), Pusan National University Yangsan Hospital. This work was supported by (NRF-2020R1F1A1075212, NRF-2020R1C1C1003741, NRF-2018R1A5A2023879).
The authors declare no conflict of interest.
PNUYH, pusan national university yangsan hospital; GO, gene ontology; AEs, acute exacerbations; IPF, idiopathic pulmonary fibrosis; DEGs, differentially expressed genes; PPI, protein–protein interaction; RNA-seq, RNA sequencing; GEO, Gene Expression Omnibus; MCODE, molecular complex detection; STRING, Search Tool for the Retrieval of Interacting Genes; BP, biological process; CC, cellular component; MF, molecular function; BTG1, BTG anti-proliferation factor 1; CCNA2, cyclin A2.