
Background: Plants have evolved the dual capacity for maximizing light assimilation through stem growth (phototropism) and maximizing water and nutrient absorption through root growth (gravitropism). Previous studies have revealed the physiological and molecular mechanisms of these two processes, but the genetic basis for how gravitropism and phototropism interact and coordinate with one another to determine plant growth remains poorly understood. Methods: We designed a seed germination experiment using a full-sib F1 family of Populus euphratica to simultaneously monitor the gravitropic growth of the radicle and the phototropic growth of the plumule throughout seedling ontogeny. We implemented three functional mapping models to identify quantitative trait loci (QTLs) that regulate gravitropic and phototropic growth. Univariate functional mapping dissected each growth trait separately, bivariate functional mapping mapped two growth traits simultaneously, and composite functional mapping mapped the sum of gravitropic and phototropic growth as a main axis. Results: Bivariate model detected 8 QTLs for gravitropism and phototropism (QWRF, GLUR, F-box, PCFS4, UBQ, TAF12, BHLH95, TMN8), composite model detected 7 QTLs for growth of main axis (ATL8, NEFH, PCFS4, UBQ, SOT16, MOR1, PCMP-H), of which, PCFS4 and UBQ were pleiotropically detected with the both model. Many of these QTLs are situated within the genomic regions of candidate genes. Conclusions: The results from our models provide new insight into the mechanisms of genetic control of gravitropism and phototropism in a desert tree, and will stimulate our understanding of the relationships between gravity and light signal transduction pathways and tree adaptation to arid soil.
Plants have evolved a diverse array of sensory systems that allow them to respond adaptively to the environment [1]. For example, to maximize light and nutrient capture, developing embryos direct their plumules upward, towards light and against gravity. Meanwhile, they also direct their radicles away from light and toward gravity. The basic mechanisms of tropisms have traditionally been investigated using mutants with tropic impairments [2, 3]. Within the past decade, significant advances have been made at the whole-genome level in understanding transcript and metabolite participants in the processes of sensing, transducing, and responding to light and gravity [4]. Employing the microgravity environment, the decoupled molecular mechanism regarding phototropism and gravitropism had been explained preliminarily [5, 6, 7]. However, few studies have genetically dissected gravitropism and phototropism as complex phenotypes, and we do not yet have a clear picture of how genes modulate organ specificity in response to gravity and light or how these processes evolved.
Gravitropism and phototropism are two distinct but interdependent biological processes. Traditional genetic mapping based on static thinking is limited in that no methods have been developed to map gravitropic and phototropic responses that co-vary allometrically across time and space. Because the plant’s main stem is subject to phototropism, the taproot is subject to gravitropism and phototropism under particular environment. The main axis, consisting of the main root and the main stem, composed a composite trait to explore the genetic structure of plant gravitropism and phototropism. The main axis is the same as other composite traits that are common in nature [8, 9, 10, 11]. For example, fruit yield is a function of fruit number and fruit weight, leaf area is the combination of large leaf cells and high-density leaf cells, and stemwood volume can be calculated as a geometric function of stem height, diameter at stem breast height, and stem form factor. These components interact with one another, and each is subject to a different level of selection pressure. However, genes might also be shared by both gravitropism and phototropism, e.g., in microgravity environment, light-associated pathway genes were significantly downregulated, this indicated the potential connection between gravity and the phototropical growth [12, 13, 14, 15, 16].
Quantitative trait locus (QTL) mapping is a powerful tool for analyzing the genetic structure of quantitative traits. However, traditional QTL mapping approaches regard composite traits as a single trait rather than a function of multiple biological processes. Some researchers have realized the importance of developing specific models for mapping composite traits [17]. Nevertheless, the purpose of such models is only to relax the basic statistical assumptions essential for genetic mapping; they do not substantively address how to integrate the principles of biology into the statistical framework of QTL mapping.
The main purpose of the present article is to explore the genetic structure of gravitropism and phototropism in Populus euphratica, the only tree species in the world that is naturally distributed at the edge of barren deserts or semi-barren deserts [18]. Poplars in salt deserts are ecologically important because their roots stabilize the sand and protect oases from wandering dunes [19, 20, 21, 22]. Given P. euphratica’s high tolerance for salinity and atmospheric drought, focusing on the genetic control of its gravitropism and phototropism is likely to yield meaningful results [23, 24]. Our research is based on a full-sib family derived from two different trees sampled from a natural stand in Northwestern China and germinated into seedlings in isolated tubes. Germination and seedling establishment are critical stages in the life cycle of P. euphratica, and have a profound influence on its subsequent development [25, 26]. Unlike previous studies purporting to identify transcription factors related to gravitropism and phototropism, the present work focuses on mapping the genetic architecture of gravitropism and phototropism as a composite trait using a composite trait model based on the biological decomposition of the plant’s main axis. We divide the main axis into the main stem and taproot to identify specific quantitative trait loci (QTLs) that govern gravitropism and phototropism.
We explored the genetic structure of gravitropism and phototropism and its
internal relations in a forest poplar tree. According to Zhang et al.
[27], a full-sib F1 population of 345 members was derived from a cross between
two dioecious P. euphratica trees in Korla, Xinjiang, China
(41
Among all seeds growing in culture, 345 normal-growth progeny were ultimately obtained. After planting in the glass tubes, the first observation time was individual-dependent and varied from 6 to 23 days. Main stem length and taproot length were measured repeatedly for each progeny once per week until the fastest-growing seedlings filled the tubes. A total of 12 or 16 measurements were taken over 3 months. Owing to the differences in the emerging stage of seedlings among progeny, and our efforts to reduce measurement errors by limiting the number of surveyors, the measurement schedules were slightly progeny-dependent.
Based on Zhang et al. [27], a total of 8279 single nucleotide polymorphisms (SNPs) were available, of which 6868 and 1411 were testcross and intercross markers, respectively. Testcross markers are those that segregate based on single-parent heterozygosity, whereas intercross markers segregate based on the heterozygosity of both parents.
From the perspective of the univariate model, the mechanisms of gravitropism and phototropism can be associated with QTLs through main stem height (S) and taproot length (R), respectively. As longitudinal traits, the growth of each trait can be fitted by a logistic function based on fundamental principles of biophysics and biochemistry [28]. This leads to the growth equation, expressed as:
where
Main stem height and taproot length as longitudinal traits can be assumed to follow a normal distribution. Phenotypic values measured at a series of time points
Where
Considering that a multigeneration of trees is not easy to achieve, and the genotypes of trees cannot be completely pure, we carried out QTL mapping within the F1 generation. We assumed that it is composed of n progeny, each genotyped at the genome level for molecular markers from which a genome-wide genetic linkage map can be constructed.
Because the specific measurement time for each individual was different, the likelihood of main stem height and taproot length at a marker locus of J genotypes is formulated as
where J is the number of genotype at a marker locus.
The bivariate model is capable of locating significant QTL sites that affect both phototropism and gravitropism based on phenotypic variation in main stem height and taproot length at a given time point. Phenotypic values can be defined as vectors, i.e.,
We make a few simplifications of the structure of
where
According to Eqn. 10, even for constant innovation variances, the residual variance can change over time [31]. It also can be seen from Eqn. 11 that the correlation function is unsteady for the SAD model because the time intervals are not the only determinants of the correlation.
Second, we assume that the innovation correlation exists only between the two
component traits at the same time point, not at different time points, and that
such an innovation (i.e.,
where
According to Eqn. 12, the across-correlation functions are not symmetrical for the SAD model. That is, the correlation between the main stem trait at time
Thus, by implementing these expressions in Eqn. 10,11,12 into the matrix in Eqn. 9, we can achieve a parsimonious matrix structure without losing much information.
Under the bivariate functional model, given that the specific measurement time for each individual is different, the likelihood of the two phenotypes at a marker locus of J genotypes is formulated as
where J is the number of genotype at a marker locus.
Through the anatomical analysis of the plant’s main axis, a composite trait, we can determine how the significant loci affect the growth of the entire whole plant through phototropism and gravitropism. The relationship between the main axis and the two component traits is shown in Fig. 1. We partition the overall growth of the main axis, M, into two parts, expressed as:
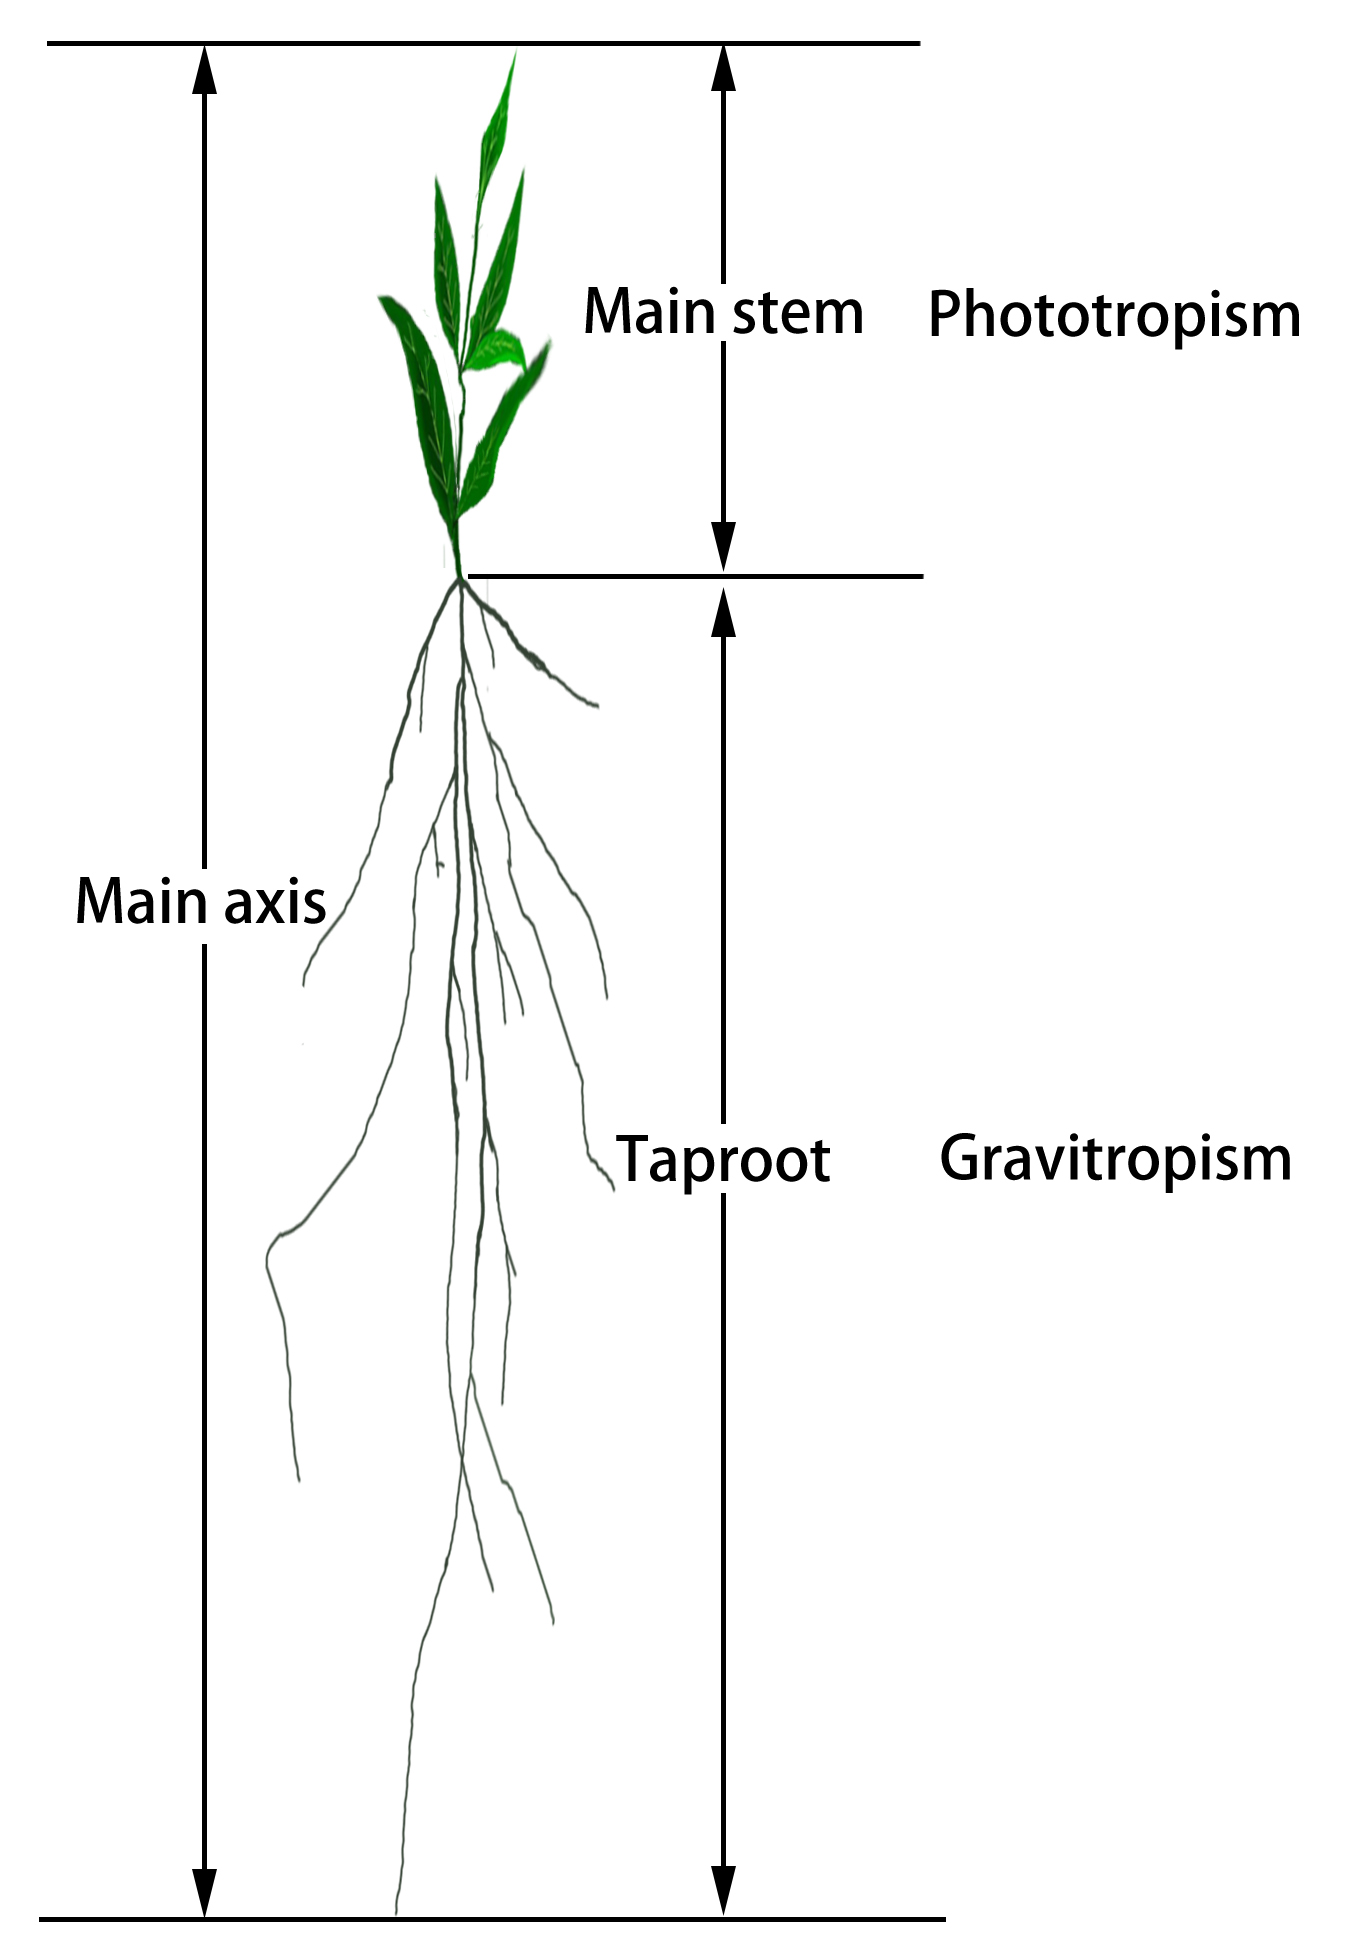 Fig. 1.
The main axis of a plant can be broadly classified into the main stem and taproot. Main stem height is defined as the length of the main stem from the stem–root connection to the stem tip. Taproot length is defined as the length of the main stem from the stem–root connection to the root tip.
Main stem height and taproot length can be studied allometrically. According to the allometric growth equation, the main stem equation is represented by the taproot formula. We make the summation of logistic functions fit multiple parts (main stem and taproot) of the main axis, leading to a composite growth equation, expressed as:
where
The main axis as a longitudinal trait is actually the sum of two variables, which are also longitudinal traits can be assumed to follow a normal distribution. Phenotypic values can be defined as vectors:
Under the composite trait model, given that the specific measurement time for each individual is different, the likelihood of the main axis at a marker locus of J genotypes is formulated as
where J is the number of genotype at a marker locus.
Many algorithms have been developed for parameter estimation (Eqns. 8,16). The simplex algorithm, which is derived from the optimization principle, has been widely applied to estimate growth parameters and matrix-structuring parameters [32]. In this study, we deployed the simplex algorithm for the estimation of all parameters contained in the equations.
According to the univariate functional mapping model, the presence of significant QTLs affecting phototropism or gravitropism can be tested by formulating the following hypothesis tests:
H1: the above equation is not valid. Under each case we obtain the maximum likelihood estimates of all growth parameters and matrix structure parameters. By calculating and plotting the likelihood ratio (LR) of the null hypothesis and alternative hypothesis at the whole genome level, we can detect the genomic distribution of significant QTLs. The critical threshold can be determined from the permutation tests by recombining the phenotypic data 1000 times. The LR value was calculated for each recombination, and the top 5% of LR values were used as the critical threshold at the 5% significance level.
If Eqn. 17 is rejected, we can say that the QTL influences phototropism. If Eqn. 18 is rejected, we can say that the QTL influences gravitropism.
According to the bivariate functional mapping model, QTLs that significantly affect phototropism, gravitropism, or both can be identified by the following hypothesis tests:
H1: At least one of the above equations is not valid. Through genetic effects we can determine which QTLs have significant effects on phototropism, gravitropism, or both.
Based on the composite functional mapping model, we formulate the null hypothesis to test whether a particular QTL influences main axis growth by regulating phototropism or gravitropism:
H1: the above equation is not valid. Through genetic effects we can determine which QTLs have a significant effect upon the main axis and how these effects are related to phototropism and gravitropism.
By plotting main stem length and taproot length data over time for the progeny, we identified a logistic equation that fit the growth curve (Fig. 2). According to the univariate functional mapping model, Eqns. 1,2 can be directly incorporated into the likelihood model to map phototropism- or gravitropism-related QTLs. Eleven phototropism-related markers and eight gravitropism-related markers were identified as QTLs within, or adjacent to, candidate genes that have been observed to function in known plant growth-related pathways (Fig. 3). The significant sites related to phototropism were distributed mainly in multiple linkage groups, such as 2, 5, 10, 15, 17, and 18. Conversely, the significant sites related to gravitropism were distributed mainly in three linkage groups: 8, 10, and 12.
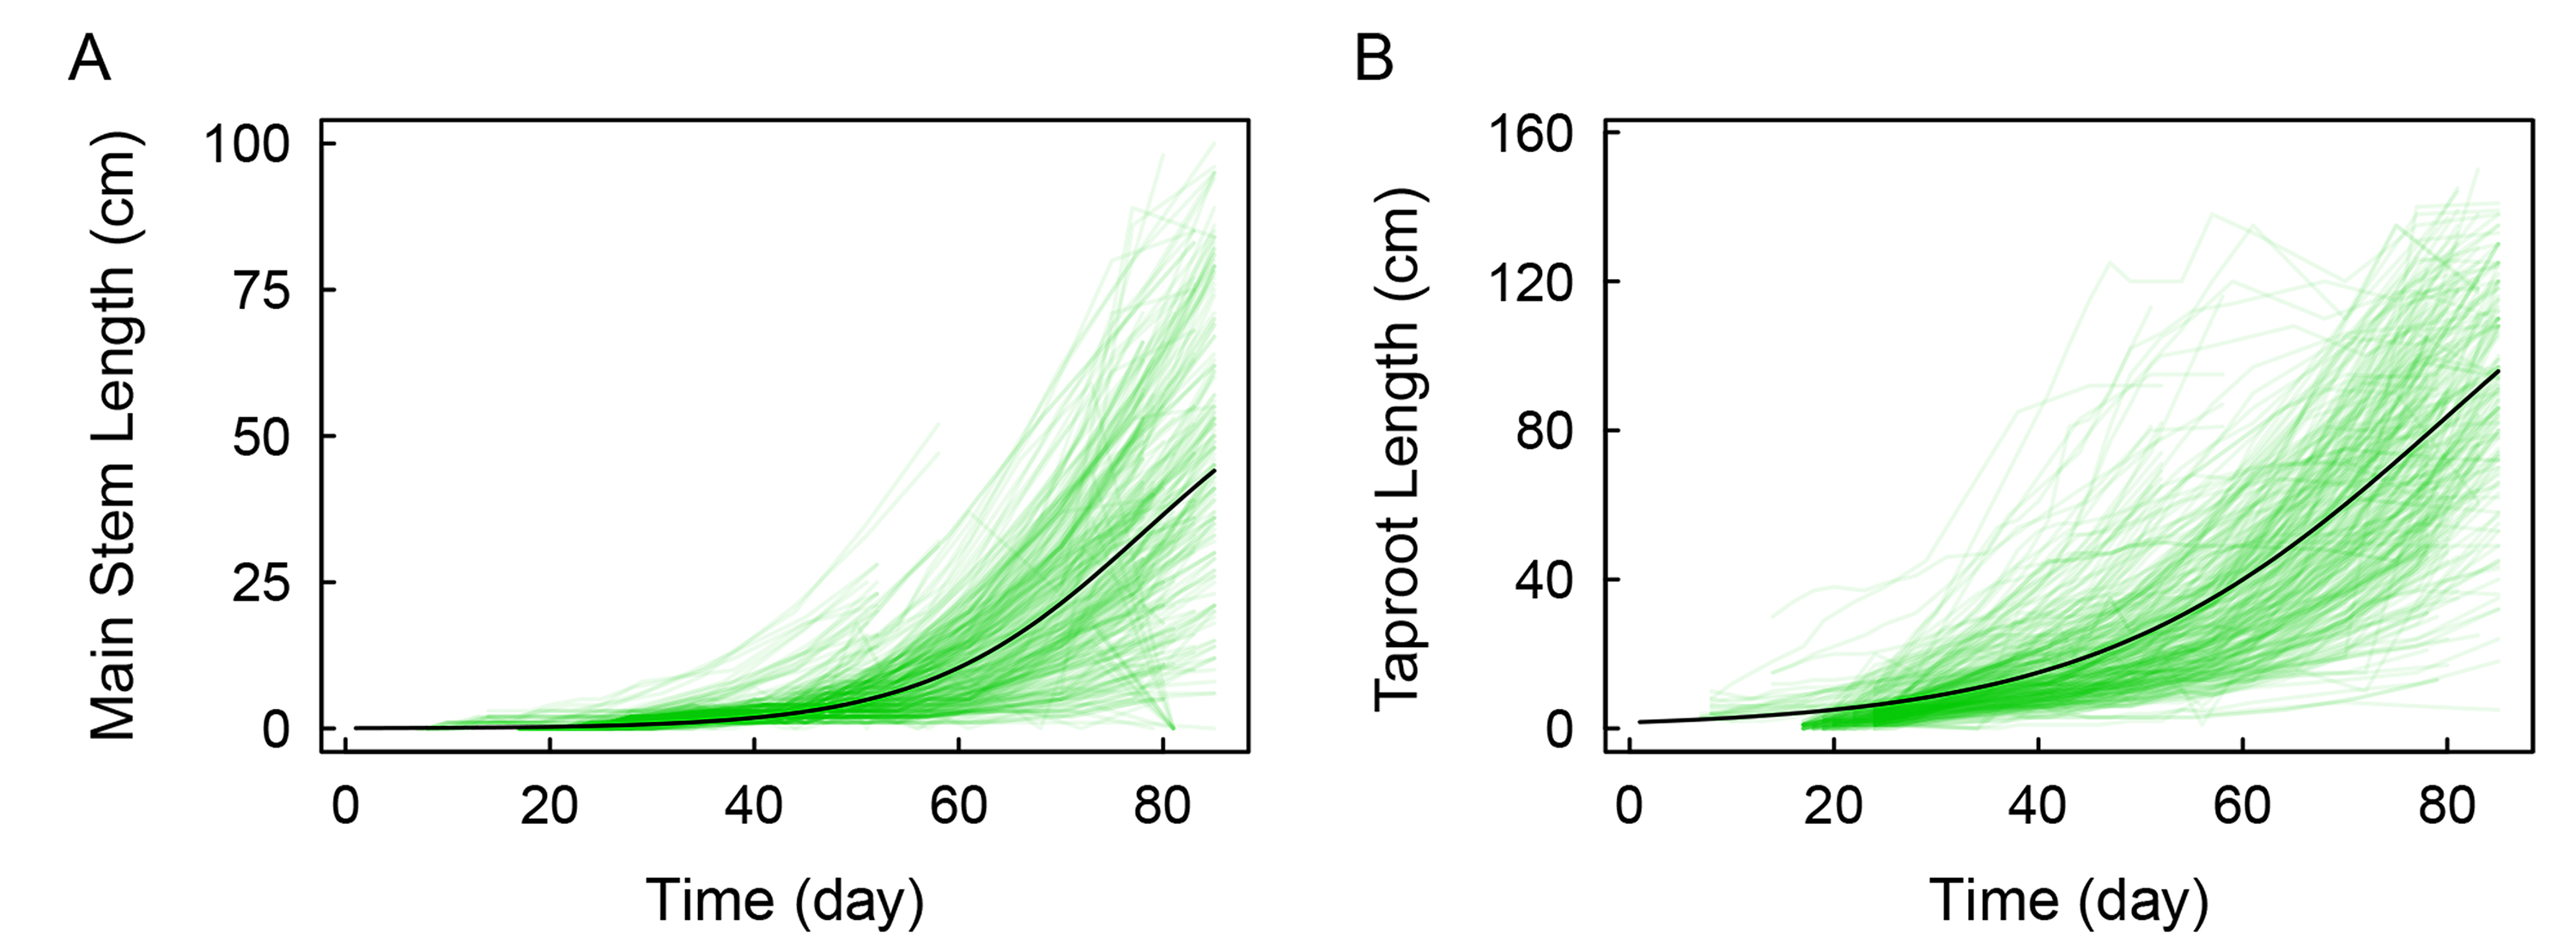 Fig. 2.
Growth trajectories of the main stem and taproot. Main stem length (A) and taproot length (B) are well-fitted by the mean curves.
 Fig. 3.
Manhattan plots of significance tests for all single nucleotide polymorphisms (SNPs) across linkage group 19 based on the univariate model of 3-month growth curves for main stem and taproot in a full-sib family of poplar. White font is used for linkage groups 2, 5, 8, 10, 12, 15, 17, and 18. Blue and red vertical lines indicate the critical thresholds at a 5% significance level. The abbreviations shown in the significant region are those genes with known biological functions.
The phototropism-associated QTL P. euphratica cytochrome P450 CYP72A219 (CYP72A219) is a tolerant gene that is continuously expressed at high levels in nearly all salt-tolerant crops. The gravitropism-related QTL ABC transporter B family member 8 (ABCB8) is related to ATPase activity and ATP-mediated material transport. We further characterized the genotypes and dominant genetic effects of the phototropism-related testcross QTL CYP72A219 and the gravitropism-related testcross QTL ABCB8 for each trait (Fig. 4).
 Fig. 4.
The separation curve of genotypes and the dominant genetic effects of testcross quantitative trait loci (QTLs) CYP72A219 and ABCB8 on each trait. The effects of these QTLs on the phototropic growth of the main stem (A) and geotropic growth of taproot (B) are shown in (C).
QTL CYP72A219 has a clear impact on phototropic growth, gradually increasing the growth of the main stem over time. Seedling tolerance to stress increases gradually, but at an increasing rate, within the first three months of growth. QTL ABCB8, which influences geotropic growth, has increasing effects throughout the early stages of seedling germination; however, its effects begin to decline in the third month of seedling germination, the key period for seedling establishment. Gravitropism is clearly a very important process during this period. Although this method is powerful for detecting QTLs influencing either phototropism or gravitropism, the model does not take into account the biological environment of the main stem and taproot or the genetic relationship between phototropism and gravitropism.
Using the bivariate functional mapping model, eight markers were identified as QTLs (Fig. 5) significantly related to phototropism, gravitropism, or both. We chose the five most significant QTLs, all of which were annotatable, for in-depth analysis. SNP lm_ll_12166 resides in the QWRF motif, which is related to microtubule-severing activity, which in turn plays an important role in intercellular spreading. SNP lm_ll_8106 was observed to reside within the F-box gene, which directs the interaction of the protein complex with a specific target for ubiquitylation. SNP lm_ll_12477 was located within the polyubiquitin (UBQ) gene, which plays distinct roles that include signaling and the inactivation of protein kinases. SNP lm_ll_12839 was found within the ethylene-responsive transcription factor 12-like (TAF12) gene, which is essential for mediating the regulation of RNA polymerase transcription and is likely involved in the negative regulation of cytokinin sensitivity. SNP hk_hk_1862 resides within the transcription factor bHLH95-like (BHLH95) gene, which encodes a transcription factor that controls embryonic growth. Polyadenylation and cleavage factor homolog 4-like (PCFS4) is involved in plant leaf shape changes and heteromorphic leaf variations, which may be related to plant environmental adaptability. Other significant SNPs can be similarly annotated (Table 1).
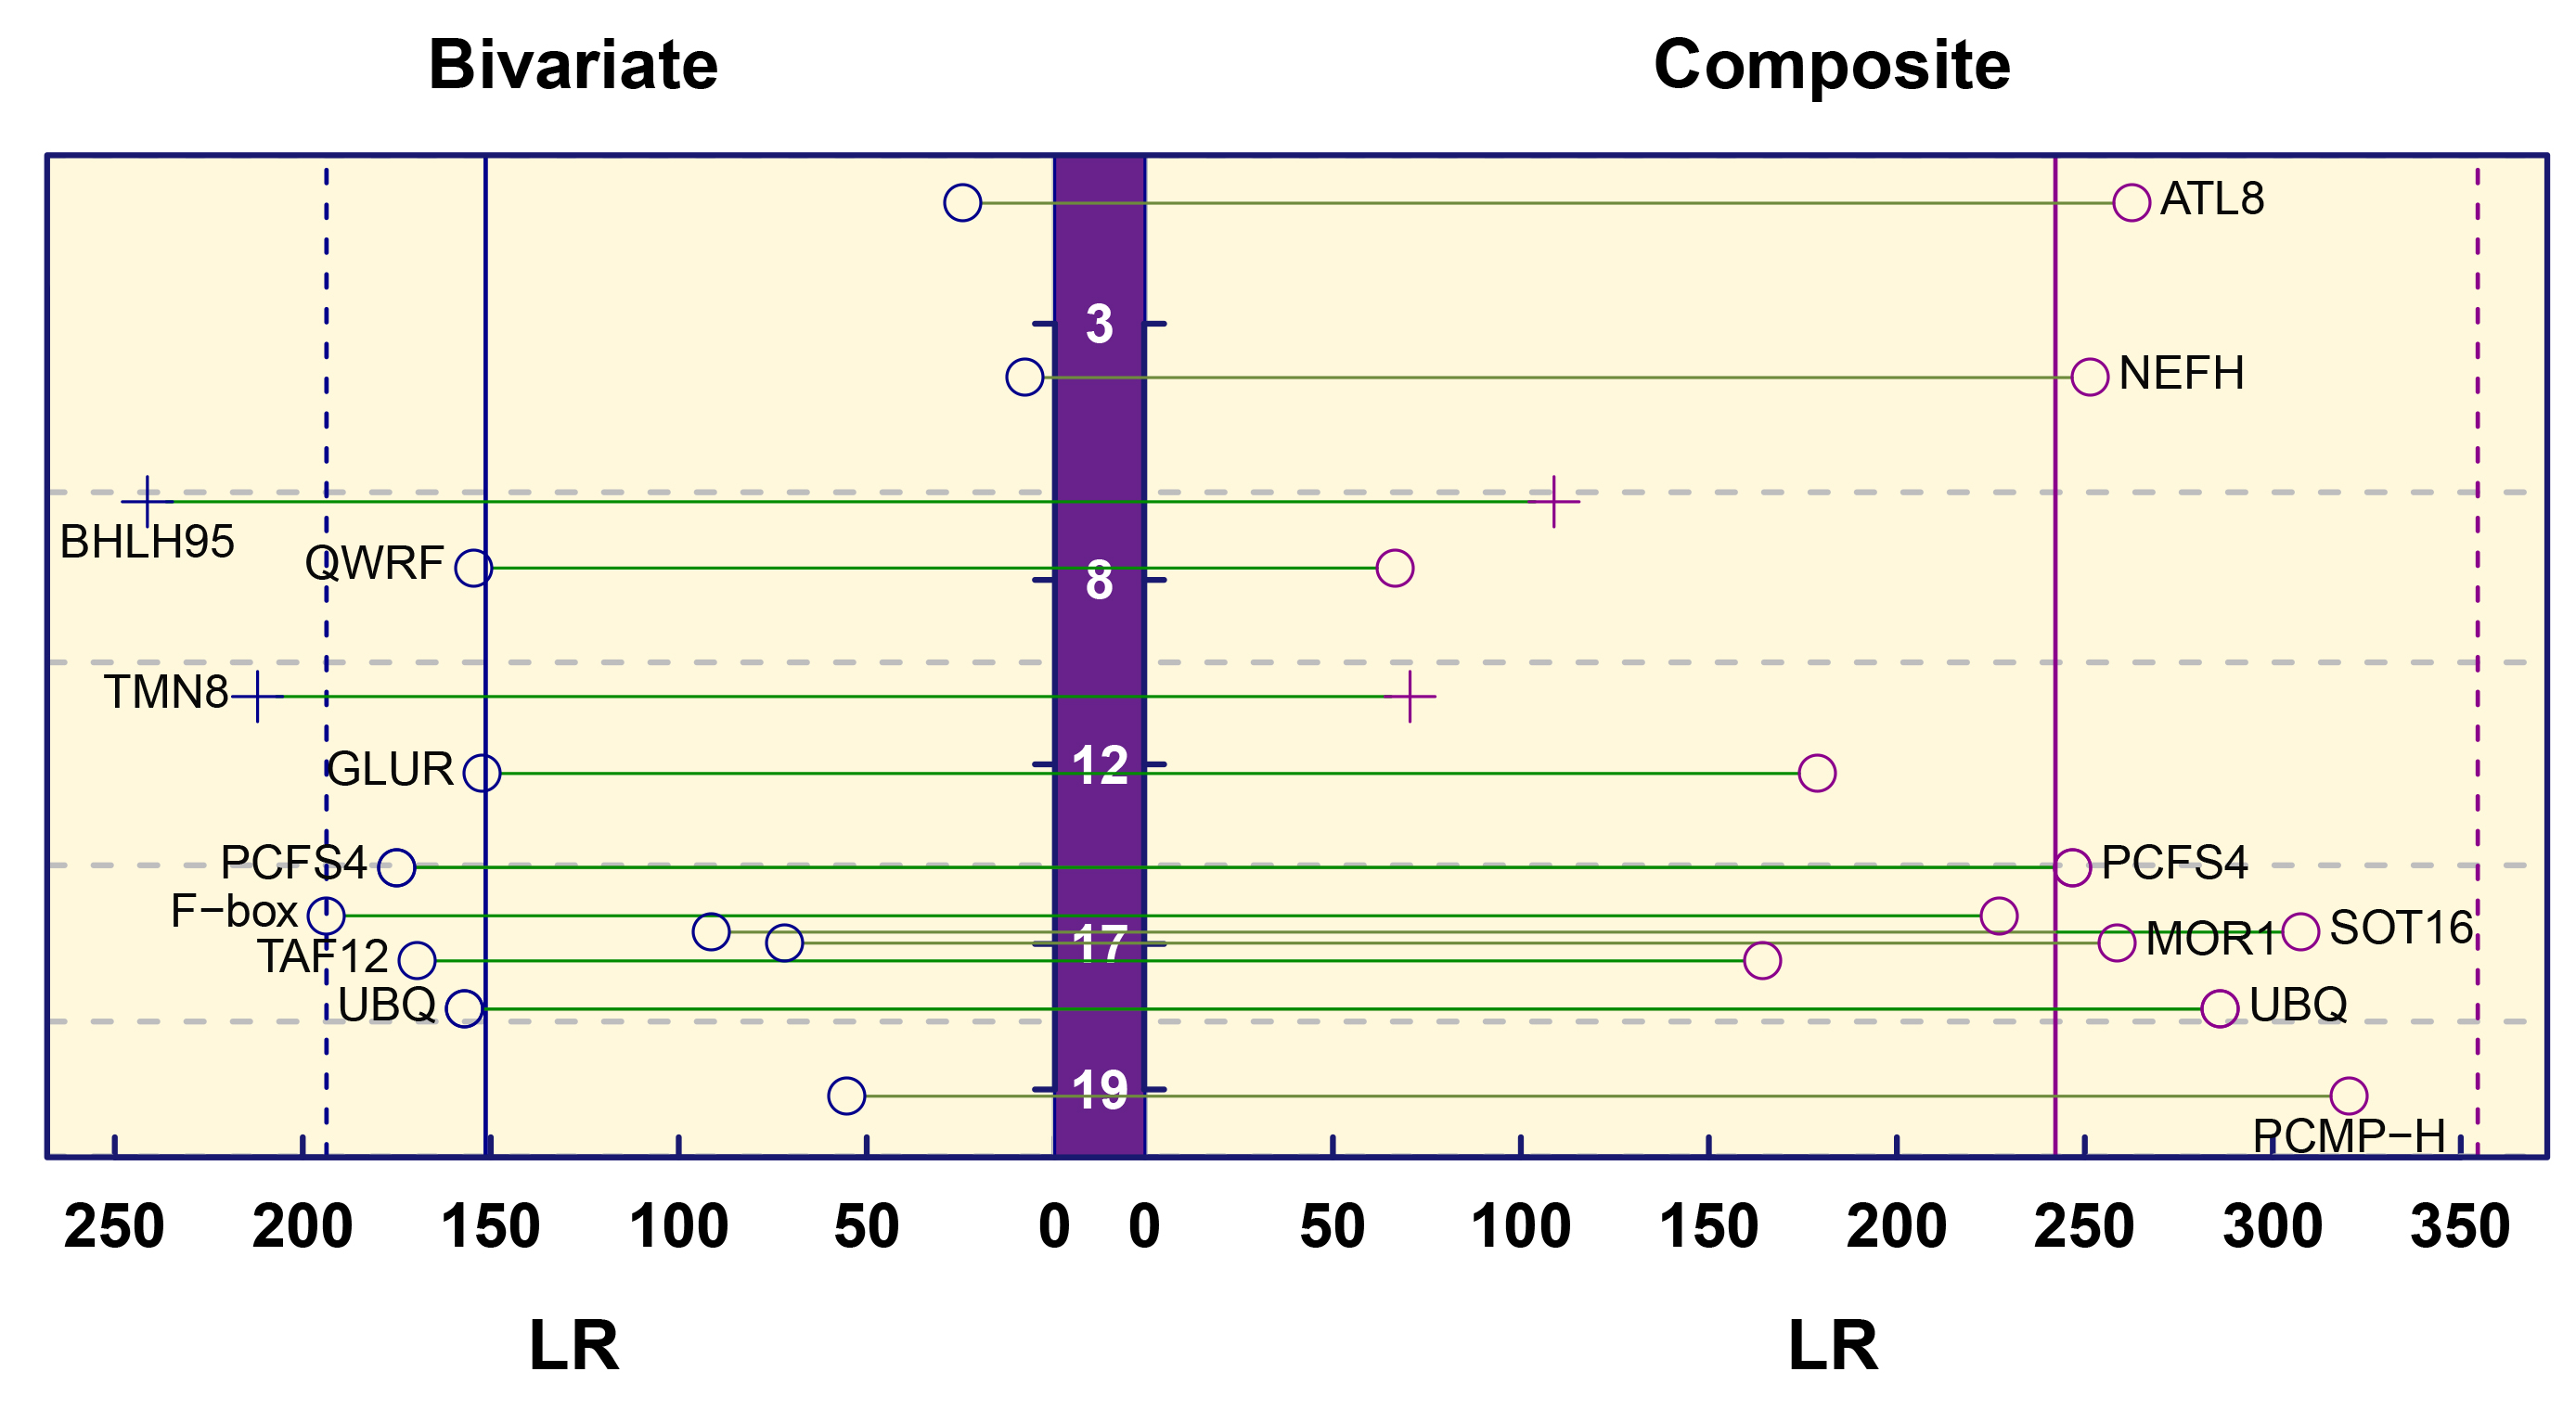 Fig. 5.
Manhattan plots of significance tests for all testcross and intercross SNPs across linkage group 19 based on the bivariate model and composite model. White font is used for linkage groups 3, 8, 12, 17, and 19. Blue and red vertical lines indicate the critical thresholds at a 5% significance level. The abbreviations shown in the significant region are those genes with known biological functions.
| Cross-type | Marker ID | Gene ID | Linkage group | Annotation | Description |
| Testcross | lm_ll_12166 | 105128730 | 8 | QWRF | Populus euphratica QWRF motif-containing protein 2-like (LOC105128730), transcript variant X2, mRNA |
| Testcross | lm_ll_11678 | 105117029 | 12 | GLUR | Populus euphratica glutamate receptor 2.1-like (LOC105117029), transcript variant X2, mRNA |
| Testcross | lm_ll_8106 | 105113529 | 17 | F-box | Populus euphratica probable F-box protein At4g22030 (LOC105113529), mRNA |
| Testcross | lm_ll_10991 | 105108183 | 17 | PCFS4 | Populus euphratica polyadenylation and cleavage factor homolog 4-like (LOC105108183), mRNA |
| Testcross | lm_ll_12477 | 105113422 | 17 | UBQ | Populus euphratica polyubiquitin (LOC105113422), mRNA |
| Testcross | lm_ll_12839 | 105138892 | 17 | TAF12 | Populus euphratica ethylene-responsive transcription factor 12-like (LOC105138892), mRNA |
| Intercross | hk_hk_1862 | 105129299 | 8 | BHLH95 | Populus euphratica transcription factor bHLH95-like (LOC105129299), mRNA |
| Intercross | hk_hk_682 | 105134105 | 12 | TMN8 | Populus euphratica transmembrane 9 superfamily member 8 (LOC105134105), mRNA |
We further modeled the separation curves of genotypes and the dominant genetic effects of testcross QTLs glutamate receptor 2.1-like (GLUR) and TAF12, mapped using the bivariate model, on each trait (Fig. 6, Supplementary Fig. 1). GLUR attenuates wound-induced surface potential changes and is involved in organ-organ long-distance trauma signaling. The first three months of seedling germination is a critical period for root formation. The effects of GLUR on root development initially increase in strength, then decrease. Roots can respond rapidly to their environment by transmitting internal and external environmental signals and adjusting their morphology. At the end of the first three months of germination, phototropic growth gradually increases, and GLUR begins to be actively expressed in the stem. TAF12 represents a group of plant AP2/ERF transcription factors, including the pathogenesis-related transcriptional activator PTI1-like tyrosine-protein kinase 6 (PTI6) and the ethylene-responsive transcription factor ERF. PTI6 binds to the GCC-box pathogenesis-related promoter element and activates plant defense genes. It is possible that this site is involved in the regulation of defense processes in the stem and promotes the photogenic growth of the stem. However, these effects do not explain the physiological components of main axis formation, and may therefore be limited in revealing the genetic machinery underlying how phototropism and gravitropism influence main axis growth.
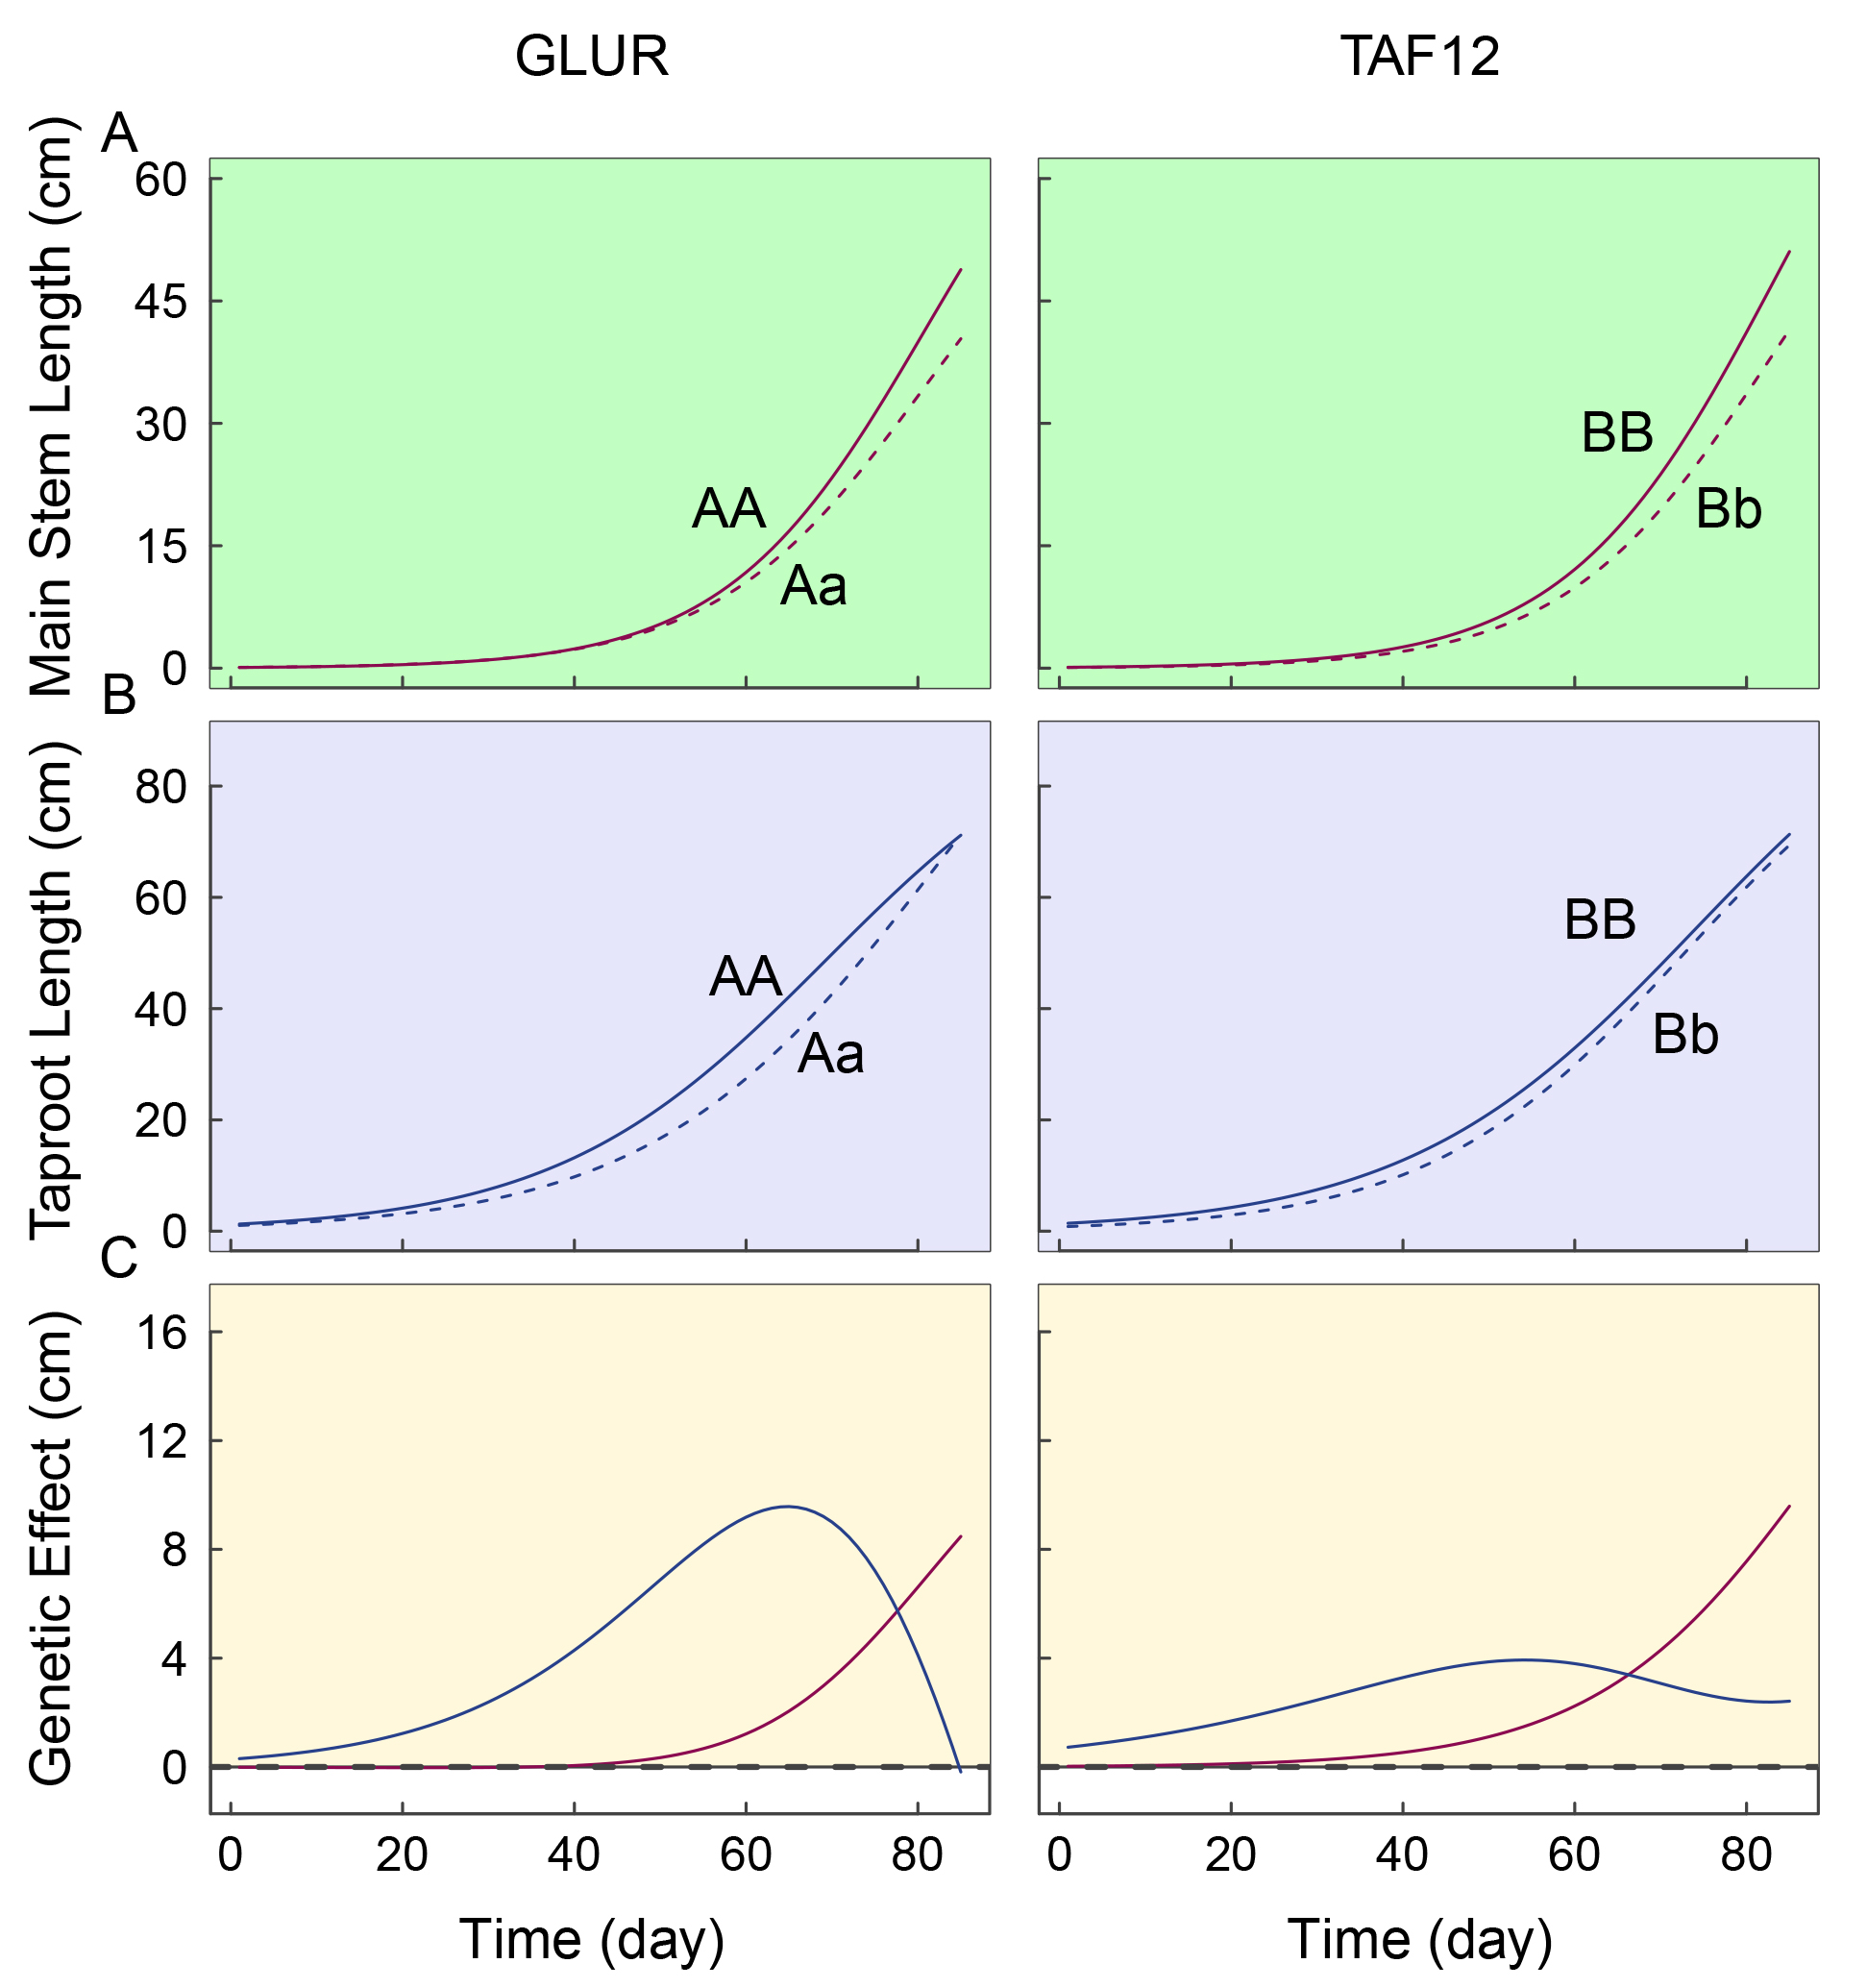 Fig. 6.
The separation curve of genotypes and dominant genetic effects of testcross QTLs GLUR and TAF12 on each trait. The effects of these QTLs on the phototropic growth of the main stem (A) and geotropic growth of taproot (B) are shown in (C).
We drew the dynamic trajectories of the main stem (Fig. 7A), main axis (Fig. 7B), and taproot (Fig. 7C) based on the maximum likelihood estimates for the
growth parameters of the two component traits (
By incorporating the composite growth equation (Eqn. 14) into the likelihood estimation (Eqn. 16), the composite trait model unified the physiological components of trait formation and identified seven QTLs (Fig. 5). Two of the seven significant sites were also identified using the bivariate functional model (Table 2). We further estimated the separation curves of genotypes and the dominant genetic effects of the two testcross QTLs, PCFS4 and UBQ, on each trait (Fig. 8).
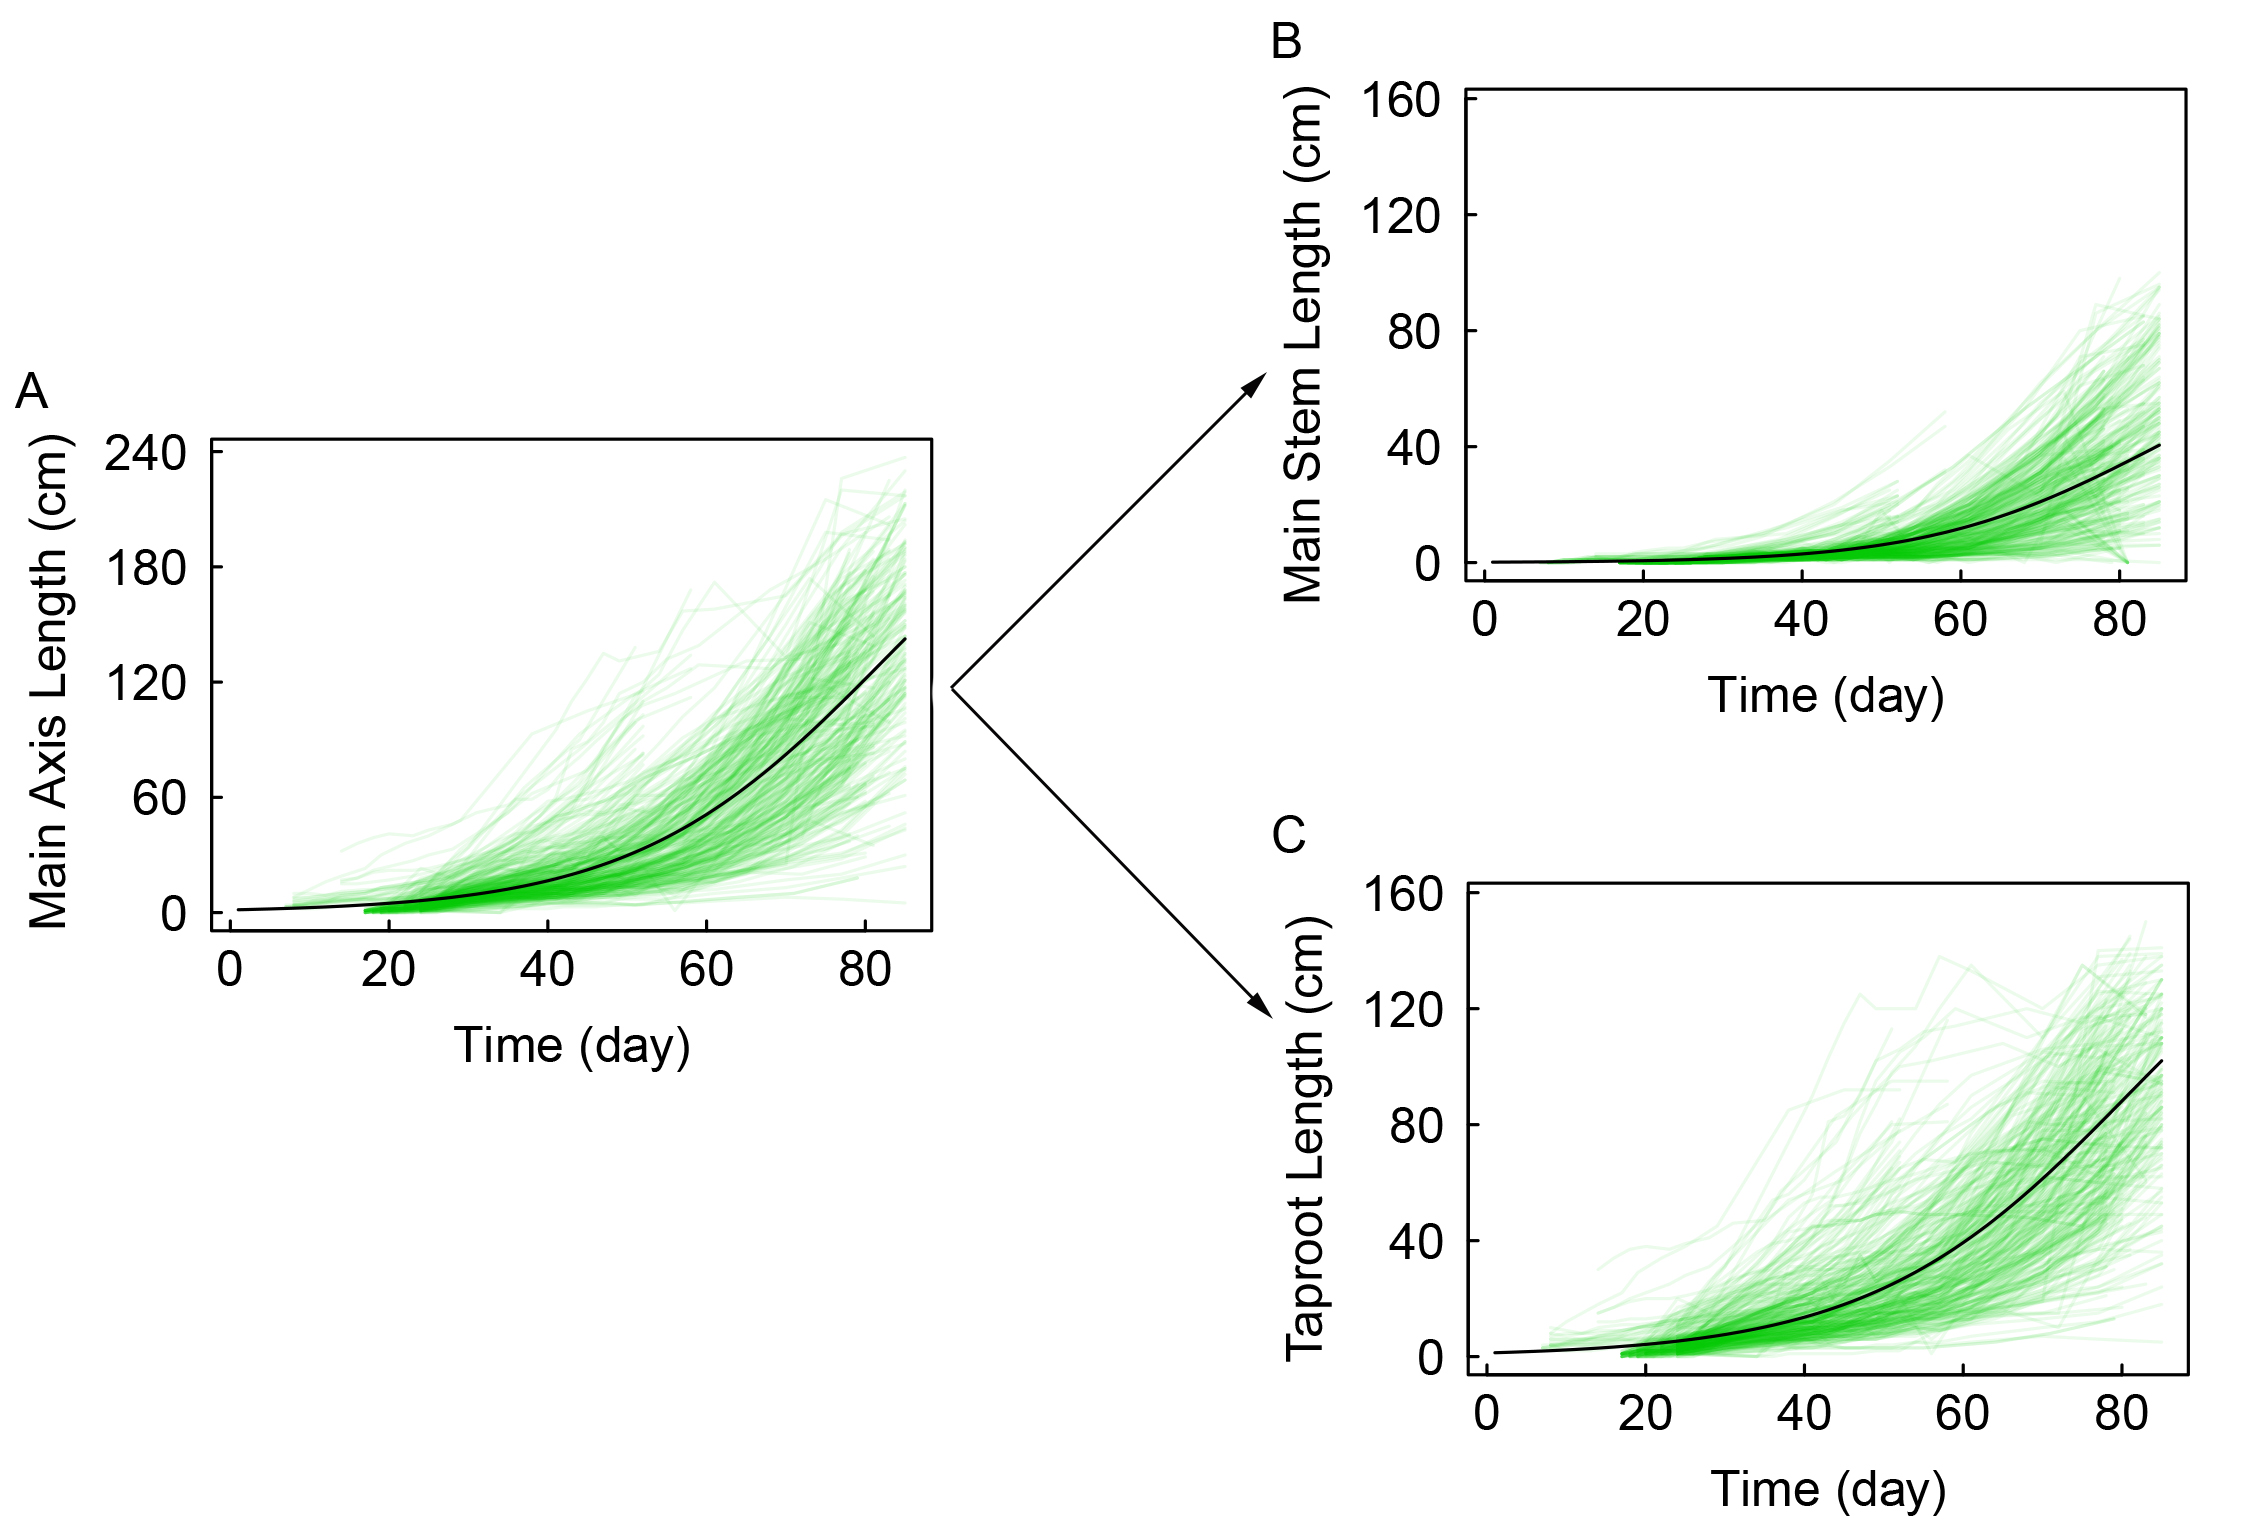 Fig. 7.
The decomposition of main axis growth trait into the main stem growth and the taproot. Mean growth trajectories of the main axis (A), dissected into its main stem (B) and taproot (C) components, in a full-sib poplar family.
 Fig. 8.
The separation curve of genotypes and dominant genetic effects of testcross QTLs PCFS4 and UBQ on each trait. The effects of these QTLs on the phototropic growth of the main stem (A) and geotropic growth of taproot (B) are shown in (C).
| Cross-type | Marker ID | Gene ID | Linkage group | Annotation | Description |
| Testcross | nn_np_6918 | 105132817 | 3 | ATL8 | Populus euphratica RING-H2 finger protein ATL8-like (LOC105132817) |
| Testcross | nn_np_10469 | 105132882 | 3 | NEFH | Populus euphratica neurofilament heavy polypeptide-like (LOC105132882), mRNA |
| Testcross | lm_ll_10991 | 105108183 | 17 | PCFS4 | Populus euphratica polyadenylation and cleavage factor homolog 4-like (LOC105108183), mRNA |
| Testcross | lm_ll_12477 | 105113422 | 17 | UBQ | Populus euphratica polyubiquitin (LOC105113422), mRNA |
| Testcross | lm_ll_10628 | 105112752 | 17 | SOT16 | Populus euphratica cytosolic sulfotransferase 16-like (LOC105112752), mRNA |
| Testcross | lm_ll_8209 | 105136801 | 17 | MOR1 | Populus euphratica protein MOR1-like (LOC105136801), mRNA |
| Testcross | nn_np_11424 | 105133873 | 19 | PCMP-H | Populus euphratica pentatricopeptide repeat-containing protein At3g04760 chloroplastic-like (LOC105133873), mRNA |
In the early stages of seedling growth, the boundary between root and stem is unclear, and root growth is critical to the successful establishment of poplar seedlings. In later stages of growth, the boundary between root and stem is obvious. PCFS4 has important effects on stem development. First, the main axis grows downward through root development. A stable root system is important for the growth of the stem. Photogenic growth causes the stem to grow upward on the main axis so that the plant can increase its exposure to sunlight and absorb more carbon. UBQ accepts ubiquitin from the E1 complex and catalyzes its covalent attachment to other proteins. UBQ can promote the bidirectional growth of the principal axis by inducing both stem and root growth.
Phototropism and gravitropism are key biological mechanisms underlying plant photosynthesis and nutrient absorption, and it is therefore important to investigate their genetic basis and relationship. The establishment of the main axis of P. euphratica through phototropism and gravitropism is an important component of its development in the desert. With the advent of next-generation sequencing technology, an increasing number of studies have attempted to reveal the genetic and regulatory pathways involved in stem and root phenotypic development [33, 34]. In the present study, we propose a new approach to genotype-phenotype mapping by dissecting the main axis into its physiological components, the main stem and taproot. The phototropic growth of the main stem and the geotropic growth of the taproot contribute to the development of the main axis in different ways: the main stem absorbs carbon, the taproot takes up nutrients and water, and both are subjected to different natural selection pressures. In this study, we identified how each component is controlled by genes and associated with the main axis phenotype.
To quantify the genetic and developmental mechanisms of phototropism and gravitropism, we developed and applied mathematical equations to dissect the growth trajectories of the main axis, and integrated these equations into a composite trait model for identifying specific QTLs that mediate main axis growth. This composite trait model unifies functional mapping and the principle of physiological functions through mathematical equations and offers advantages over traditional methods. First, it provides new insight into the physiological mechanisms of main axis formation. By integrating the growth curves of different components, the model elucidates how phototropism and gravitropism interact with one another during seedling development. Although the taproot and stem grow at the same rate, the taproot is almost twice the length of the main stem (Fig. 7). This phenomenon confirms that phototropism and gravitropism, used by main stem and taproot growth in competing for and preserving space advantage, operate independently. Taproot growth also begins much earlier than main stem growth (Fig. 7B). This indicates that different patterns of growth have emerged for above- and below-ground components in the Euphrates poplar: during their early stages of development, trees first rapidly establish a root system to facilitate water and nutrient uptake. These different patterns of growth can be explained by the influence of different ecological variables on the stem and taproot. Analyzing the growth of the main axis as a single trait cannot discriminate between these effects.
A second advantage of our composite trait model is that it allows us to visualize how a QTL governs a trait through its pleiotropic control over the trait’s underlying components. By comparing main stem and taproot growth curves for two or three different genotypes at all QTLs (Fig. 8), we found that QTLs have two distinct management modes on composite traits. In the first management mode, QTLs affect only the composite trait and one of the two component traits. In the second management mode, QTLs influence all three traits simultaneously, but to varying degrees. Consider a QTL located at the PCFS4 gene on linkage group 17 (Fig. 8, PCFS4). Its effect on the taproot is weak, but its effect on the main stem is stronger. It can therefore be said that this QTL influences the growth of the main axis mainly through phototropism. We can generalize this phenomenon by analyzing other QTLs. Whether and how QTLs affect a composite trait depends on whether and how they influence the component mechanisms, phototropism and gravitropism. Thus, the underlying genetic influences on the main axis composite trait can be better elucidated by dissecting the trait into its underlying components based on physiological rules.
Through functional annotation, seven QTLs were mapped to candidate genes in the bivariate functional mapping model. These genes encode QWRF motif-containing protein 2-like, GLUR, F-box protein (At4g22030 homolog), PCFS4, UBQ, TAF12, BHLH95, and transmembrane 9 superfamily member 8 (TMN8). F-box protein is one of the three components of the Skp-Cullin-F-box (SCF) complex [35]. F-box protein, the mediator for ubiquitination protein degradation by the 26S proteasome [36], is associated with cellular functions such as regulation of the cell cycle and hormone signal transduction [37, 38]. It also plays a key role in various biological processes, such as the plant stress response [39, 40], floral development [41], circadian clock regulation [42], self-incompatibility [43], and photomorphogenesis [44, 45]. PCFS4 promotes flowering [46] and mediates mRNA maturation [47]. These candidate genes are essential for plant defense, mRNA maturation, nodule formation, cation transportation, protein phosphorylation, RNA synthase, isoprenoid biosynthesis, hormone signal transduction, and other biological processes during seedling growth and development.
Through functional annotation, seven QTLs were mapped to candidate genes in the composite functional mapping model. RING-H2 finger protein ATL8-like (ATL8), PCFS4, UBQ, cytosolic sulfotransferase 16-like (SOT16), protein MOR1-like (MOR1), pentatricopeptide repeat-containing protein At3g04760 chloroplastic-like homolog (PCMP-H). ATL8 have been shown to participate in defense responses, play a role in the regulation of the carbon/nitrogen response during post-germinative seedling growth transition, in the regulation of cell death during root development, in endosperm development, or in the transition to flowering under short day conditions [48]. SOT16 that utilizes 3’-phospho-5’-adenylyl sulfate (PAPS) as sulfonate donor to catalyze the sulfate conjugation of desulfo-glucosinolates (dsGSs), the final step in the biosynthesis of the glucosinolate core structure [49]. PCMP-H proteins play constitutive, often essential roles in mitochondria and chloroplasts, probably via binding to organellar transcripts [50]. These candidate genes are related to the regulation mechanism of gravitropism and phototropism of plants in different ways.
The composite trait model we have described is flexible. The model can also accommodate other traits, such as fruit production and flowering phase. The model can describe the critical stages of organ development and determine how QTLs influence relevant traits. The practical and conceptual advantage of the composite trait model is that it uses dynamic modeling to synthesize genetic information into composite trait development research. For molecular mechanisms of plant tropism, many researches implemented the spaceflight experiments to create a microgravity environment, to get genes responsive to phototropism and gravitropism. With the help of transcriptomic and proteomic technique, genes related to phosphorylation event, cell wall adaptations, microtubule and redox homeostasis interaction, photosynthesis, porphyrin, and chlorophyll metabolism were identified. These results had deeply aided our understanding on mechanism of plant tropism [16, 51]. Significantly, in microgravity experiment, a connection between gravity response and the phototropical growth was built through the phototropic stimuli, suggesting the mutually inseparable role between phototropism and gravitropism [16].
Under such background, our study employs bivariate functional mapping model and the composite trait model to simultaneously integrate the above-ground trait and the under-ground trait of seedling, but from the perspective of plant axis development to reveal the genetic architecture of phototropism and gravitropism. The model would become an efficient tool to further identify responsive genes of plant tropism, results achieved by this model will further aid in elucidating mechanism of plant growth under multiple environment stimilis, and will provide new insight into the genetic control of composite traits and the internal linkages of component traits. To avoid the randomness with the model result, a cohesive connection between genes revealed in this work had been constructed through Gene Ontology analysis. Combining genes achieved from univariate model, bivariate model, composite model, first, genes for cell wall composition, e.g., ALTERED XYLOGLUCAN 4-like (AXY4L), wall-associated receptor kinase-like 1 (WAKL1), QWRF, UBQ, has the potential to enhance cytoskeletal organization and cell wall composition, during the establishment process of gravitropism and gravitropism [51]. AXYL4 and WAKL1 respectively found with the stem and taproot trait might probably indicate their physically supportive roles in strengthening these two tropism. This may form a link with the previous studies that cell wall adaptations were seen with spaceflight or microgravity experiment. Second, light-associated pathways play significant roles in both the aboveground trait and the growth under microgravity, which had indicated a link between gravity and phototropical growth [16], e.g., FAR1-RELATED SEQUENCE 3 (FRS3) was detected. Third, for the separate trait from the mainaxis integrating the two traits, ABC transporter C family member 10-like (ABCC10), ABCB8, probable auxin efflux carrier component 1c (PIN1C) were found important for the auxin transport. These may not directly associate with plant polarity, but their promoting role for the growth of aboveground and underground trait may further maintaine the plant tropism. Though these points are likely nowhere near the end toward ellucidating the true mechanism with plant tropism, this may stand for a head-start study for the further research in this area.
PJ derived the model and participated the field management of experimental materials; NM participated the construction of mapping population and derived part of the model; FS also participated part of phenotype investigation and the field management; MY guided all authors with the data analysis and revised the manuscript; RW conceived the idea of the whole experiment and took charge of the first version of this manuscript.
Not applicable.
Authors are very grateful to the two anonymous reviewers’ comments, and Dr. Wenhao Bo and Dr. Fang Xu for their contributions on population construction.
This work is supported by grant 32071796 and grant 31600536 from National Natural Science Foundation of China, Changjiang Scholars Award, ‘Thousand-person Plan’ Award.
The authors declare no conflict of interest.