2. Introduction
IVDD (Intervertebral disc degeneration) affects a large part of the world’s
population and is a major cause of lower back pain (LBP) and
can result in permanent disability [1]. Nucleus pulposus cells (NPCs) are
extracted from the intervertebral disc and are the most commonly used cell type
to explore the underlying mechanism of IVDD. In addition, NPCs are indispensable
in some promising therapies of IVDD like NPCs transplantation. The surrounding
environment of NPCs is avascular [2, 3, 4] and hypoxia as low as
1% O has been documented [5, 6]. Recent evidence has
revealed that hypoxia plays a crucial role in maintaining the physiological
functions of NPCs, including stable cell survival, coordinated metabolism and
extracellular matrix synthesis [7, 8, 9, 10]. It is logical to culture NPCs in
environments of hypoxia to investigate the biological behavior of NPCs in
vitro [11]. Low oxygen incubators are the most ideal apparatus to culture NPCs
under physical hypoxia, however, a problem encountered by many
researchers is access to a hypoxia incubator with downregulated oxygen levels, so
this is not feasible for many laboratories [12]. Consequently, discovering novel
and simple methods to mimic physical hypoxia in cultured NPCs is requisite and
beneficial for the research and therapy of IVDD.
Previous studies have shown that some chemical
compounds can be used to mimic physical hypoxia, such as divalent metals or iron
chelators [13, 14]. One of the most frequently used chemical compounds is cobalt
chloride (CoCl). CoCl has been used for many cell lines as a
hypoxia-mimetic compound, for it can stabilize hypoxia-inducible factors
1 (HIF1) under normoxic conditions based on
the inhibition of PHDs by substitution of the Fe [15, 16, 17]. The differences
between CoCl-generated hypoxia and physical hypoxia were demonstrated by
Munoz-Sanchez et al. [12], however, to our knowledge, few studies to
date have explored the possibility of using CoCl to induce mimetic-hypoxia
for NPCs in vitro. NPCs can maintain a certain level of HIF1
expression under normoxic conditions and some researchers regard HIF1
as one of the biomarkers of NPCs [18, 19]. Whether the biological behavior of
NPCs under cobalt chloride hypoxia is comparable to physical hypoxia requires
exploring. If so, CoCl can be regarded as a simple and accessible compound
to simulate a hypoxic environment for NPC experiments.
In these studies, we hypothesized that CoCl mimetic-hypoxia would have
analogous effects compared with physical hypoxia, and we aimed to verify the
possibility to use CoCl to induce mimetic-hypoxia for
NPCs. We conducted in-vitro experiments to prove our hypothesis through
detecting routine biological behaviors under hypoxia, such as cell survival,
apoptosis, migration, glycolysis, ROS generation and extracellular matrix
metabolism.
3. Materials and methods
3.1 Cell isolation and culture
NPCs were isolated from eight-week-old male Sprague-Dawley rats, which were
brought from Animal Center of the Xinqiao Hospital. All experiments were approved
by the Ethics Committee of the Army Medical University (Code: AMUWEC20211846).
Rats were sacrificed after appropriate anesthesia. Nucleus pulposus tissue was
separated from caudal vertebra and cut into small pieces. After digestion with
0.1% collagenase for 6 h, the suspension was centrifuged at 300 g for 5 min and
then resuspended in DMEM-F12 (BI,
Kibbutz Beit-Haemek, Israel) media with 10%
fetal bovine serum (FBS, LONSA, Canelones, UY) and 100 U/mL
penicillin-streptomycin. Afterwards, the partially digested tissue was cultured
in an incubator containing 5% CO, 20% O with humidified atmosphere
at 37 C. After 1-week incubation, NPCs migrated from the partially
digested tissue, then incubated in culture flasks in humidified atmosphere
containing 5% CO, 20% O at 37 C. Nonadherent cells were
removed by replacing the media after 48 h. At 90% confluence, NPCs were washed
with phosphate-buffered saline (PBS) twice, and then passaged in a 1:2 ratio.
Culture media was changed every 3 days. Cells used in this research were Passage
3–Passage 5.
3.2 Treatment with hypoxia condition and CoCl
NPCs in all groups were cultured in DMEM-F12 media with 10% fetal bovine serum
and 100 U/mL penicillin-streptomycin. CoCl (Sigma, Saint
Louis, MO, USA) was dissolved in DMEM-F12 for a stock concentration of 10 mmol/L
and then diluted in culture media for required concentrations. For physical
hypoxia, NPCs were cultured in an incubator with humidified atmosphere containing
1% O, 5% CO at 37 C. For mimetic-hypoxia, NPCs were
incubated with different concentrations of CoCl solution (50 M, 100
M, 200 M, 300 M, 400 M) and cultured in an incubator
with humidified atmosphere containing 20% O, 5% CO at 37
C.
3.3 Detection of cell viability by Cell Counting Kit-8 (CCK-8)
To measure the cell viability of NPCs, a CCK-8 assay (CCK-8,
Beyotime, Shanghai, China) was performed according to the manufacturer’s
instructions. CCK-8 is a colorimetric reaction-based assay that yields an orange
formazan dye to an extent proportional with the cell number. The cell viability
of NPCs was calculated by evaluating the absorbance at 450 nm on a
spectrophotometer [20]. NPCs were seeded into 96-well plates (2000 cells/100
L) and cultured in groups of normoxia, physical hypoxia (1% O)
and CoCl mimetic-hypoxia (50 M, 100 M, 200
M, 300 M, 400 M). After 24 h, 48 h and 72 h, cell culture
media was replaced with 110 L CCK-8 solution (10% concentration) per well
and incubated for 2.5 h, respectively. The OD value of each well was measured to
obtain Ac (absorbance of control well), As (absorbance of the experimental well),
Ab (absorbance of blank well) by a microplate reader at 450 nm (Spectra Max M2,
Molecular Devices, Sunnyvale, CA, USA). Cell viability (%) = [(As-Ab) / (Ac-Ab)]
100.
3.4 Detection of apoptosis rate by flow cytometry
Apoptosis was detected using the Annexin V-PE/7-AAD apoptosis detection kit
(BD Pharmingen, Franklin Lakes, NJ, USA)
according to the manufacturer’s instructions. After treatments
of normoxia, physical hypoxia (1% O) and CoCl mimetic-hypoxia for 24
h, 48 h and 72 h, NPCs were collected and suspended in 1 binding buffer
at a concentration of 1 10 cells/mL. 100 L of this cell
suspension (1 10 cells) was then transferred
to a 5 mL culture tube. After addition of 5 L of Annexin V-PE and 5
L of 7-AAD, the solution was gently mixed and incubated for 15 min at room
temperature in the dark. Subsequently, 400 L of 1 binding buffer
was added to each tube. Flow cytometry of NPCs was performed within 1 h, with
Annexin V positive cells representing the occurrence of apoptosis.
3.5 Migration assay of NPCs
Scratch tests were conducted to determine the effect of normoxia, physical
hypoxia (1% O), and CoCl mimetic-hypoxia on NPCs migration. A total
of 310 NPCs cells were seeded into 6-well plates and cultured
overnight in media containing 10% FBS. A scratch wound was generated in the
center of each well by a sterile 200 L pipette tip. After washing twice
with PBS, fresh serum-free culture media was added to the plates. Cells were then
cultured in physical hypoxia (1% O) and CoCl mimetic-hypoxia,
respectively. Images were taken at 0 h, 12 h, 24 h using an inverted phase
contrast microscope and cell migration area was quantified using ImageJ software
(National Institutes of Health, New York, NY, USA).
3.6 Extracellular pH detection
Cells were cultured in 6-well plates and incubated for 24 h, 48 h, 72 h under
normoxia (20% O), physical hypoxia (1% O) and CoCl mimetic-hypoxia (50 M, 100 M, 200 M, 300 M, 400
M). The conditioned cell media was
collected and analysed with a pH meter (Sartorius, Goettingen, Germany).
Data were collected and analysed to detect the extracellular pH
change.
3.7 Reactive oxygen species (ROS) detection with
flow cytometry
Intracellular accumulation of ROS was measured by DCFH-DA (Solarbio, Beijing,
China) following the manufacturer’s instructions. After physical hypoxia and
CoCl treatments for 6 h, cell samples were washed three times with
serum-free culture media and stained with 10 M of DCFH-DA in serum-free
culture media for 20 min at 37 C in the dark. The cells were
washed three times with serum-free culture media to remove
unbound probe outside of the cells. Cells were then collected in 5 mL polystyrene
tubes and the mean fluorescence intensity of DCF was analyzed with an excitation
wavelength of 488 nm and an emission wavelength of 525 nm.
3.8 Quantitative RT-PCR analysis
Following treatment of CoCl (0 M, 50 M, 300 M) and
hypoxia (1% O), NPCs were washed twice with PBS and then treated with the
RNAiso Plus (Takara, Tokyo, Japan) to extract
total RNA from samples based on manufacturer’s protocols. PrimeScript RT reagent
kit (Takara, Tokyo, Japan) was used for RNA reverse transcription to synthesize
cDNA. SYBR Premix Ex Taq II Kit (Takara, Tokyo, Japan) was used for amplification
and detecting the relative mRNA expression of target genes with
the Real-Time PCR System (Cobas z 480, Basel, Switzerland). The primers for
QRT-PCR are presented in Table 1. -actin was
used to normalize target gene mRNA and we utilized formula
2 to measure the relative mRNA expression.
Table 1.The primers for QRT-PCR.
| RNA sequence (5’-3’) |
| Sox9-Forward |
GCACATCAAGACGGAGCAACT |
| Sox9-Reverse |
TTCTGGTGGTCGGTGTAGTCAT |
| Glut1-Forward |
ATCCACCACACTCACCACACT |
| Glut1-Reverse |
CCATAAGCACGGCAGACACAA |
| Col2a1-Forward |
GCAGCAAGAGCAAGGAGAAGAA |
| Col2a1-Reverse |
CAGTGGACAGTAGACGGAGGAA |
| Mmp1-Forward |
TGCCGTTTGTGAGGAAGAGAC |
| Mmp1-Reverse |
CTGCGTTGAACTGATTGGTGAA |
| Timp1-Forward |
TGGCATCCTCTTGTTGCTATCA |
| Timp1-Reverse |
AACGCTGGTATAAGGTGGTCTC |
| Acan-Forward |
TGGCCTGCCTGACTTTAGTG |
| Acan-Reverse |
CCTGAACCACTGACGCTGAT |
| Hif1-Forward |
TTGATGTGGACAGCGATATGGT |
| Hif1-Reverse |
GGCAGTGACAGTGATGGTAGG |
| -actin-Forward |
CTGTGTGGATTGGTGGCTCT |
| -actin-Reverse |
CAGCTCAGTAACAGTCCGCC |
| Sox9, SRY-box transcription factor 9; Glut1, glucose
transporter 1; Col2a1, collagen type II alpha 1 chain; Mmp1,
matrix metallopeptidase 1; Timp1, tissue inhibitor of metalloproteinase
1; Acan, aggrecan; Hif1, hypoxia inducible factor 1
subunit alpha. |
3.9 Western blot analysis
NPCs were incubated under normoxia, with selected concentrations of CoCl
(50 M, 300 M) and physical hypoxia for 24 h,
respectively. Total protein was extracted by RIPA buffer (Beyotime Biotechnology,
Shanghai, China) containing 1% PMSF (Beyotime Biotechnology, Shanghai, China)
and then centrifuged at 12,000 g at 4 C for 5 min to discard the cell
debris. Protein concentrations were determined by standard bicinchoninic acid
(BCA; Beyotime Biotechnology, Shanghai, China) method. A total of 40
g of protein was loaded into each well and separated by sodium
dodecyl sulphate-polyacrylamide gel electrophoresis (SDS-PAGE) followed by
transfer to polyvinylidene fluoride membranes (PVDF; Merck Millipore, Darmstadt,
Germany). Membranes were blocked by 5% nonfat milk in TBST, incubated with
specific antibodies overnight at 4 C, and then washed with TBST three
times. The membranes were then incubated with horseradish peroxidase-labeled
secondary antibody (dilution 1:5000) for 1.5 h and visualized using an enhanced
chemiluminescence substrate (Bio-Rad, Hercules, CA, USA) and Bio-Rad Chemidoc
(Hercules, CA, USA). The relative level of target protein to -ACTIN was
calculated by using the ImageJ software. The antibodies used were as follows:
-ACTIN (Abcam, Cambridge, UK, 1:1000
dilution), COL2/ACAN/SOX9/MMP1/TIMP1/BAX/BCL2 (Proteintech, Wuhan, China, 1:500
dilution), P53 (Proteintech, Wuhan, China, 1:200 dilution), HIF1/GLUT1
(Abcam, Cambridge, UK, 1:1000 dilution).
3.10 Statistical analysis
Data are presented as mean standard deviation (SD) for at least three
independent experiments. SPSS 23.0 software (SPSS Inc. IL, New York, NY, USA) was
used to conduct statistical analysis. Multiple comparison of data among the
groups were determined by a one-way ANOVA followed by the least significant
difference test (Fisher test) and statistical significance was evaluated by an
unpaired Student’s test for comparisons between two means. Differences were
considered statistically significant when p 0.05.
4. Results
4.1 CoCl -mimetic and physical hypoxia effects on cell
viability
A dose response test of CoCl was performed to explore the effects of
various concentrations on cell viability. When CoCl concentration was
no more than 100 M, no significant difference in cell viability was found
in NPCs with normoxia (20% O) or physical hypoxia (1% O) at 24 h,
48 h and 72 h, respectively. However, when the concentration of CoCl
increased (over 200 M), the cell viability of NPCs under CoCl were
significantly inhibited compared with NPCs in normoxia or physical hypoxia at 24
h, 48 h and 72 h, respectively (p 0.05) (Fig. 1).
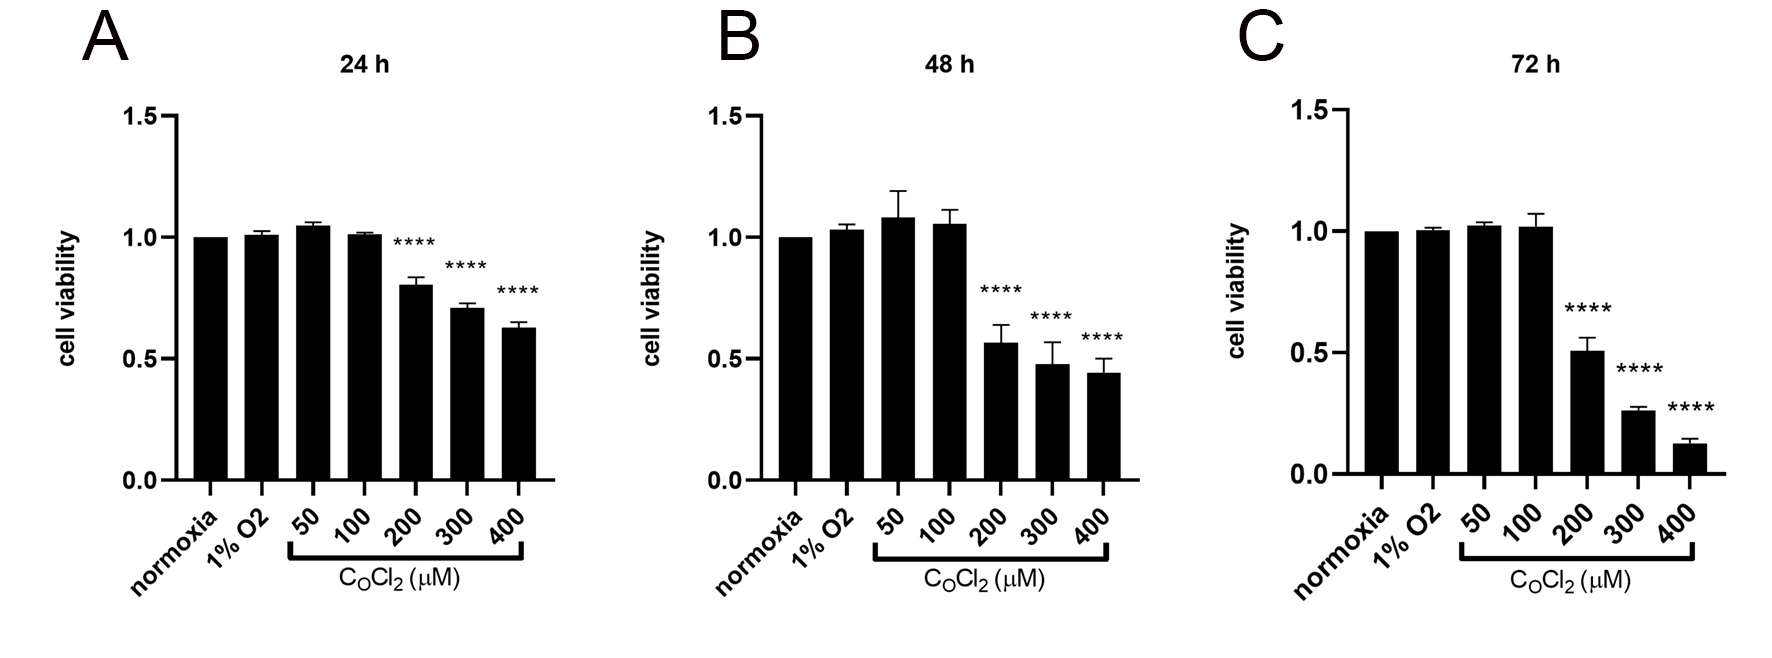 Fig. 1.
The cell viability of NPCs measured by CCK-8 assay in normoxia
(20% O), physical hypoxia (1% O), and
CoCl-mimetic hypoxia. Data are expressed as mean SD from
three independent experiments (*p 0.05, **p 0.01,
***p 0.001, ****p 0.0001 vs. normoxia; No statistical
significance/ns).
4.2 CoCl -mimetic and physical hypoxia effects on cell
apoptosis
Flow cytometry results demonstrated that there were no significant differences
between the apoptosis rates of NPCs under CoCl (50 M and 100
M), 1% O and normoxia (p 0.05). When the concentration
of CoCl was greater than 200 M, cell apoptosis rates increased (Fig. 2A,B).
 Fig. 2.
The apoptosis rates of NPCs measured by flow cytometry
assay in normoxia (20% O), physical hypoxia (1% O), and
CoCl-mimetic hypoxia. (A) Cell apoptosis detected by flow
cytometry analysis after Annexin V-PE/7-AAD double-staining. Apoptotic rate was
represented as a percentage of total cell populations. The proportion of dead
cells (annexin V-/7AAD+), live cells (annexin V-/7AAD-), early apoptotic cells
(annexin V+/7AAD-) and late apoptotic cells (annexin V+/PI+) was measured for
comparison; (B) Histograms showing the apoptosis rate (the sum of early and late
apoptotic cells) of NPCs treated for 24 h, 48 h and 72 h in normoxia, physical
hypoxia, and CoCl-mimetic hypoxia. The values are expressed as mean
SD from three independent experiments (***p 0.001, ****p 0.0001 vs. normoxia; No statistical significance/ns).
4.3 CoCl -mimetic and physical hypoxia effects on cell
migration
The scratch test was conducted to explore the effect of
physical hypoxia, and CoCl-mimetic hypoxia on NPCs
migration. 1% O stimulated hypoxia elicited stronger NPC migration than
CoCl-mimetic hypoxia and normoxia, as shown by the NPCs healing
area/wounded area at 0 h, 12 h and 24 h after scratch injury (p
0.05). The migration speed of NPCs under CoCl was negatively correlated
with the concentration of CoCl (p 0.05) (Fig. 3A,B).
 Fig. 3.
Effect of physical hypoxia, and CoCl-mimetic
hypoxia on NPC migration and extracellular pH. (A) Images illustrating NPCs
migration detected by scratch test at 0 h, 12 h, and 24 h; (B) Histogram showing
the migration ratio of NPCs treated with normoxia, physical hypoxia, and
CoCl-mimetic hypoxia for 12 h and 24 h; (C) Extracellular pH of NPCs culture
media collected at 24 h, 48 h, and 72 h under normoxia, physical hypoxia, and
CoCl-mimetic hypoxia; (D) Extracellular pH detected by pH meter at 24 h, 36
h and 72 h, respectively. pH of 1% O group was of the lowest at 24 h, 48 h
and 72 h. Data are expressed as mean SD from three independent
experiments (*p 0.05, **p 0.01, ***p
0.001, ****p 0.0001 vs. normoxia; No statistical significance/ns).
4.4 CoCl -mimetic and physical hypoxia effects on
extracellular pH
The pH of culture media was determined at 24 h, 48 h and 72 h after normoxia,
physical hypoxia, and CoCl-mimetic hypoxia. In each group, extracellular pH
was time-dependently downregulated. The pH of culture media under 1% O
were lower than those under normoxia and CoCl treatment at 24 h, 48 h and
72 h (p 0.05) (Fig. 3C,D).
4.5 CoCl -mimetic and physical hypoxia effects on ROS
generation
The intracellular ROS level was detected by flow cytometry. Compared with
normoxia, NPCs under physical hypoxia and CoCl mimetic-hypoxia exhibited
upregulated ROS generation. ROS fluorescence intensity was dose-dependent under
CoCl culture (Fig. 4A,B).
 Fig. 4.
The intracellular ROS of NPCs detected by flow cytometry after
DCFH-DA staining. (A) ROS detected by flow cytometry after treated with 1%
O and CoCl (50 M, 100 M, 200 M, 300 M,
400 M) for 6 h and DCFH-DA staining for 20 min (Red histogram represents
group of normoxia); (B) Histogram showing the ROS inside NPCs treated with 1%
O and CoCl for 6 h compared with normoxia. Data are expressed as mean
SD from three independent experiments (***p 0.001,
****p 0.0001).
4.6 Quantitative RT-PCR analysis
As 50 M CoCl appeared to have similar cell viability compared with
1% O, while 300 M induced cell apoptosis of NPCs, we analyzed the
mRNA expression of several biomarkers of NPCs under normoxia, physical hypoxia
and CoCl mimetic-hypoxia at low concentration (50 M) and high
concentration (300 M). Compared with
normoxia, both 1% O and CoCl groups upregulated the transcription of
Hif1. The elevation of Hif1of CoCl
groups was concentration-dependent. Acan, Col2a1, Sox9, Mmp1 and Timp1
had the same tendency with Hif1 while Glut1 was
upregulated most in the physical hypoxia group. The ratio of Mmp1/Timp1
was upregulated in CoCl (300 M) while it was downregulated in
physical hypoxia (Fig. 5A).
 Fig. 5.
The relative mRNA and protein expression of
Hif1, Glut1, Acan, Col2a1, Sox9, Mmp1 and Timp1 of
NPCs under normoxia, physical hypoxia, and CoCl-mimetic hypoxia.
(A) The relative mRNA expressions of target genes with QRT-PCR.
-actin was used to normalize target gene mRNA and formula
2 were utilized to measure the relative mRNA
expression compared to normoxia. Data are expressed as mean SD from three
independent experiments; (B) The Western blot bands of target protein
HIF1, GLUT1, ACAN, COL2A1, SOX9, MMP1 and TIMP1; (C) Histogram
exhibiting the relative protein level compared to normoxia group. Data are
expressed as mean SD from three independent experiments (*p
0.05, **p 0.01, ***p 0.001, ****p 0.0001;
No statistical significance/ns).
4.7 Western blot analysis
The protein levels of several biomarkers of NPCs were analysed
under normoxia, physical hypoxia and CoCl-mimetic-hypoxia at low
concentration (50 M) and high concentration (300 M). Compared with
normoxia (20% O), proteins such as HIF1, GLUT1, SOX9, ACAN,
COL2, MMP1 and TIMP1 had similar increased levels under physical
hypoxia and CoCl-mimetic-hypoxia (Fig. 5B,C). Under
1% O hypoxia, the level of GLUT1 was upregulated more than that under
CoCl-mimetic-hypoxia. The BAX/BCL2 ratio was upregulated in
CoCl compared with normoxia or physical hypoxia (p 0.05). P53
was detected in CoCl treated groups and the trend was coincident with
HIF1 expression, while it was expressed at low level under normoxia or
physical hypoxia (Fig. 6A,B).
 Fig. 6.
Relative expression of protein P53, BAX,
BCL2 of NPCs under normoxia, physical hypoxia, and
CoCl-mimetic hypoxia. (A) The Western blot bands of target protein
P53, BAX, BCL2; (B) Histogram exhibiting for statistical analysis of the relative
protein expression compared to normoxia group. Data are expressed as mean
SD from three independent experiments (*p 0.05, **p
0.01, ***p 0.001, ****p 0.0001; No statistical
significance/ns).
5. Discussion
The intervertebral disc is the largest avascular structure of
the human body [2]. In our study, the cell type studied was NPCs which have
adapted to the avascular and hypoxic environment of the intervertebral disc.
Therefore, culturing NPCs in an analogous hypoxic condition may be beneficial for
basic medical research and development of potential clinical therapies for IVVD
[21]. However, a problem exists for some researchers that do not have access to a
hypoxia incubator to maintain low oxygen during cell studies. Employing chemical
compounds is a feasible choice to induce mimetic-hypoxia. To this end, CoCl has been used in many cell lines to induce mimetic hypoxia because it can
stabilize HIF1 under normoxia. Based on the inhibition of PHDs by
substitution of the Fe, high levels of HIF1 could be
detected in the presence of CoCl. But according to some researchers,
differences between CoCl and physical hypoxia still exist and might be
specific for different cell lines [12]. Therefore, we did this research to
explore the possibility to use CoCl for NPCs as mimetic-hypoxia and compare
the similarities and differences between mimetic-hypoxia and physical hypoxia.
Though NPCs could maintain HIF1 under normoxia, it was found that
both CoCl mimetic-hypoxia and physical hypoxia
upregulated the mRNA and protein level of HIF1 in this study.
Additionally, some of the biological manifestations had the same trend under
physical hypoxia and mimetic hypoxia, such as ECM metabolism, cell viability, ROS
generation and apoptosis. However, in aspects
of cell migration and glycolysis, CoCl could not achieve similar results as
physical hypoxia, which should be noted.
5.1 ECM metabolism and cell phenotype
SOX9 is considered as one of the biomarkers for NPC [22, 23, 24]. In our study,
physical hypoxia and CoCl-mimetic hypoxia all upregulated the level of
SOX9. This result is consistent with previous studies [6] and that the
upregulation of SOX9 under hypoxia may be via HIF1 pathway [25].
Nucleus pulposus tissue contain abundant ECM including collagen II (COL2) and
aggrecan (ACAN) that are responsible for
maintaining the mechanical load of IVD [26, 27]. Over the years, many studies
have shown that hypoxia could induce various cell types to enhance COL2 and ACAN
expression via HIF1, including NPCs [10, 28, 29, 30, 31, 32].
Matrix metalloproteinases (MMPs) are endopeptidases of the ECM that have the
ability to degrade almost all known components of the ECM in IVDs. Among these,
MMP1 is a collagenase that is precisely regulated by its endogenous protein
inhibitors, the tissue inhibitors of metalloproteinases 1 (TIMP1) [33, 34]. In
our study, both physical hypoxia and CoCl -mimetic- hypoxia upregulated the
levels of COL2 and ACAN compared with normoxia. In addition, both groups
upregulated MMP1 and upregulated the level of TIMP1, which is consistent with
previous studies [35, 36]. The level of MMP1 was coincident with the increased
expression of HIF1. In the group treated with CoCl at 300
M concentration, the MMP1/TIMP1 ratio was higher than normoxia, 50
M CoCl, and physical hypoxia, which may be attributed to the high
level of HIF1 as has been previously reported [21].
5.2 Cell viability
It has been confirmed that hypoxia could slightly promote cell
viability for NPCs via HIF1 [7, 37]. But few studies have
focused on the impact of CoCl on NPCs cell viability. He et al. [38] performed CCK-8 tests and found that 10 M to 100
M CoCl was safe in mimetic-hypoxia for the
in vitro study of NPCs. Jiang et al. [39] treated NPCs with 200
M CoCl for mimetic hypoxia. In our study, both physical hypoxia and
low concentration CoCl (50 M, 100 M) slightly enhanced the
cell viability detected by CCK-8 assay but these differences were not
statistically significant. Nevertheless, high concentrations of
CoCl (200 M) appeared to inhibit cell viability. Thus, we
conclude that as a chemical compound, CoCl has some toxic effects on NPCs
viability, but the effects may be minimal at low concentrations. Once the
critical concentration of 200 M is exceeded, CoCl will be
detrimental to the NPCs.
5.3 Cell migration
Cell migration is a fundamental biological process involved in tissue
homeostasis and is an important part of cell transplantation. It has a complex
mechanism which is still not clear and may be related to the MAPK signaling
pathway, phosphatidylinositol signaling pathway and cytokine–cytokine receptor
pathway [40, 41]. Many studies have shown that cells migrate faster under hypoxia
than normoxia, including mesenchymal stem cells and carcinoma cells [42, 43, 44].
Magdaleno et al. [43] compared the migration of renal carcinoma cells
under hypoxia and CoCl and found that physical hypoxia promoted migration
but CoCl failed to achieve similar effect. They concluded
that HIF1 independent mechanisms modulate the divergent outcomes in
assembly of fibronectin, which is a core matrix protein that assembles to promote
cell migration. Heirani-Tabasi et al. [41] compared the effects of three
hypoxia-mimicking agents on migration-related signaling pathways in mesenchymal
stem cells and found that CoCl failed to promote cell migration and the
mechanism of which may be partly related to the MAPK signaling pathway through
IL8/CXCR2 axis or similar mechanisms. In addition, some studies found that
CoCl inhibited cell migration compared with normoxia [2, 45]. In our study,
it was obvious that NPCs migrated faster under physical hypoxia compared with
normoxia, while NPCs migrated slower in all groups under CoCl
mimetic-hypoxia. Our data indicated that stabilization of HIF1 under
mimetic-hypoxia is not sufficient to enhance cell migration and it requires the
synergistic contribution of some other signaling pathways driven by physical
hypoxia to affect this phenotype, the detailed mechanism of which still needs
further research.
5.4 Glycolysis
Under hypoxia, energy metabolism is switched from oxidative phosphorylation to
glycolysis by upregulating the expression of glycolytic enzymes and glucose
transporters [46]. Studies have shown that NPCs keep HIF1 under normoxia and generate energy through anaerobic glycolysis [19, 47]. Under
hypoxia, NPCs could express more GLUTs to facilitate glucose transport [48]. In
our study, both physical hypoxia and CoCl mimetic-hypoxia upregulated the
expression of GLUT1, but interestingly the physical hypoxia group expressed the
highest GLUT1 and downregulated the extracellular pH the most. This may
indicate that physical hypoxia promoted glycolysis in NPCs compared with normoxia
but CoCl did not. This result concurs with a recent research report by
Zhigalova et al. [49]. They performed RNA-seq experiments to explore
transcriptomes of human Caki-1 cells under real hypoxia and CoCl treatment
and found that glycolysis was not controlled by HIF1,
indicating that CoCl failed to affect some of the essential downstream
consequences of hypoxia, particularly the glycolysis/gluconeogenesis pathway.
There may be some underlying mechanisms which trigger the downstream events of
NPCs glycolysis in hypoxia apart from HIF1.
5.5 ROS generation
As our results have shown, both physical hypoxia and CoCl mimetic-hypoxia
upregulated the ROS level of NPCs. For the CoCl groups, ROS generation had
a positive correlation with concentration (400 M), which is
consistent with previous research that demonstrated that CoCl could
stimulate cells to generate more ROS and thus cause a negative impact on cell
survival [50]. Though the result may be similar, the mechanism could be
different. In research of Hep3B cells and wild-type Hep3B cells, using either
hypoxia (1.5% O) or CoCl incubation, it was found that physical
hypoxia activates ROS generation through a mitochondria-dependent
signaling pathway, while CoCl stimulating ROS generation via a
mitochondria-independent mechanism [51]. The precise details of this mechanism of
ROS generation under physical hypoxia and CoCl for NPCs still needs more
in-depth study.
5.6 Apoptosis
As is shown in our study, the apoptosis rates of NPCs under both physical
hypoxia and CoCl mimetic-hypoxia (200 M) had no obvious
difference compared with normoxia. But when the concentration of CoCl was
larger than 200 M (including 300 M, 400 M), the apoptosis
rates rose significantly. This is in line with the findings of
Bae et al. [52] that enhanced hypoxia
by further increasing CoCl concentrations can promote cell apoptosis. We
found that both the ratio of BAX/BCL2 and P53 expression have a positive
correlation with the concentration of CoCl, but they were all downregulated
under physical hypoxia. Previous studies reported that CoCl induces cell
apoptosis via different pathways. For example, CoCl-induced HIF1
expression correlated with apoptosis and may be related to the PI3K/Akt pathway
[53]. Other researchers revealed that apoptosis associated with
oxidative stress and DNA damage [54, 55, 56, 57], may involve P53. Rana
et al. [58] found that P53 in breast cancer cells is
HIF1-dependent and overexpression of HIF1-dependent
BAX ultimately leads to apoptosis. They speculated that hypoxia affects
the P53-dependent pathway in a HIF1-dependent manner, thereby targeting
the genes involved in P53 pathway which alters the expression of pro-apoptotic
genes. Additionally, Lee et al. [59] reported that CoCl induced
apoptosis, through both mitochondria and death receptor-mediated pathways, is
regulated by the BCL2 family in mES cells. In our study, NPCs under
hypoxia down-regulated P53 but CoCl up-regulated it. According to
Zhang et al. [60], hypoxia appears to regulate P53 and is related to the
severity of hypoxia, resulting in the increase or decrease of P53 levels
and activities in cells. We thus speculated that the way that high concentrations
of CoCl induces apoptosis in NPCs is through excessive HIF1, P53,
superfluous ROS or cell toxicity of CO. The mechanisms of these
processes need to be further explored in future studies.
5.7 Limitations
There are some shortcomings in our experiments. Firstly, we just compared the
similarity and difference of some primary phenotypes between physical hypoxia and
CoCl mimetic-hypoxia but didn’t investigate further underlying mechanisms.
Secondly, the hypoxia incubator we used could only be set at 1% O as
hypoxia, and the effects of different O concentrations on NPCs were not
examined.
Generally, this research has presented an experimental study of the CoCl
for mimetic-hypoxia environment for culturing NPCs in vitro. This may
bring convenience and enlightenment for other researchers studying NPCs and IVVD.
