
Recent studies indicate that MEG3, a long non-coding RNA (lncRNA) and microRNA-184 (miR-184) are abnormally expressed in osteosarcoma (OS). To this end, we show here that MEG3 negatively regulates the expression of miR-184 and down-stream effectors of WNT/β-catenin pathway including β-catenin, T-cell factor 4 (TCF4) and c-MYC. MEG3 overexpression by adenoviral vectors down-regulate proliferation, migration and apoptosis of OS in vitro and restrict the tumor growth in vivo. We also show that the effects of MEG3 can be effectively reversed by miR-184 mimic. Together these studies show that both MEG3 and miR-184 cooperatively regulate the proliferation, migration and apoptosis of OS.
Osteosarcoma (OS) is one of the most common solid bone cancers in children and adolescents that carries a high morbidity and mortality. This tumor usualy affects proximal humerus or tibia and the metaphysis of distal femur (1). Typical symptoms of OS include limitation of joint movement, trabecular fracture, local swelling and pain (2). Other than surgery, the traditional treatments including post-operative radiotherapy and chemotherapy may lead to life-threatening side effects such as nephrotoxicity, infertility and cardiotoxicity. Therefore, There is a need for better understanding of the pathogenesis of OS with the hope to develop better treatment strategies with fewer side effects.
Maternally Expressed Gene 3 (MEG3), is a lncRNA, with key role in various cancers (3,4). Some earlier work suggested that MEG3 is poorly expressed in OS and might be a potential target for the treatment of this cancer (5). Other studies have shown that the expression of diverse miRNAs including miRNA-184 is deregulated in OS and other cancers and these changes might be used for assessment of prognosis (6-9). MEG3 interacted with miR-184 and subsequently alleviated the proliferation and invasion of leukemia cells by down-regulating related proteins (10). Wnt/β-catenin pathway plays essential roles in the tumorigenesis and EMT and is thought to be involved in the occurrence and tumor progression and metastasis of OS (11,12). It has also been shown that in retinoblastoma, reduced MEG3, resulted led to the tumor progression by regulating the activity of Wnt/β-catenin pathway (13-14). Based on such a background, we hypothesized and tesed whether miR-184/MEG3/β-catenin axis may be involved in the pathogenesis of OS.
MG63, U2OS and normal osteoblast hFOB1.19 cell lines were purchased from American Type Culture Collection (ATCC; Rockville, MD, USA). All cells were cultured in RPMI-1640 (Gibco, Rockville, MD, USA) supplemented with 10% FBS at 37°C with 5% CO2. Samples of OS tumors the adjacent non-involved tissues of 55 patients who underwent surgery were frozen and stored at -80°C from following an approved protocol of the Ethics Committee of Nanchong central hospital. Patients did not receive radiotherapy or chemotherapy before surgery. Nude mice (6-8 weeks old) were obtained from Animal Experimental Center of Nanchong central hospital following a protocol approved by the Committee on the Ethics of Nanchong central hospital. MG63 cells with good growth were made as a single cell suspension of 5 × 10⁶ cells. U2OS cells with good growth were made as a single cell suspension of 5 × 10⁵. 0.4 mL 5×10⁶ MG63 cells were subcutaneously injected into the right armpit and 2×10⁶ MG63 cells were introduced to the skin to form xenograft tumors.
TargetScan and miRanda software revealed the existence of a high probability of interaction between miR-184 and MEG3. MEG3 wild type (MEG3 wt), MEG3 mutant (MEG3 mut), negative control mimics (miR-NC), miR-184 mimic, pcDNA-MEG3 and pcDNA vector were obtained from GenePharma Co., Ltd (Shanghai, China). MG63 and U2OS cells were transfected using Lipofectamine 2000 (Invitrogen, Camarillo, CA, USA). The experimental protocol was performed according to the manufacture’s instruction. Cells were used 48 h after transduction with pcDNA or after transfection.
Nude mice were randomly divided into two groups (n=18). Control group was comprised of nude mice receiving subcutaneous injection of 2×10⁶ MG63 cells transfected with empty vector; pcDNA-MEG3, and those receiving subcutaneous injection of 2×10⁶ MG63 cells transfected with pcDNA-MEG3. Tumor volume was assessed every five days including the day 30 after injection using the formula: volume=length×width2×0.5. Percent survival was recorded every three days up to and including the day 27 after injection.
Total RNA and miRNA were isolated from OS, and its adjacent non-involved tissues and MG63, U2OS and hFOB1.19 cell lines according to the manufacturer’s instructions. The PCR primers for MEG3, miR-184 and GAPDH were purchased from RiBoBio (Guangzhou, China) (the primer sequences in Table 1). 10 ng total RNA of each sample was used to analysis miRNA expression.Total RNA transcribed into cDNA using TaqMan® MicroRNA Reverse Transcription kit (Huiying, Shanghai, China). TaqMan® 2× Universal PCR Master Mix no UNG (Applied Biosystems) was used to performe qRT-PCR. PCR parameters were as follows 55°C1 min, followed by 35 cycles(denature:92°C for 30 sec then 58°C for 45 sec; elongation at 72°C for 35 sec). CT values of all samples and standard reference were calculated by fluorescent quantitative PCR cycler (PE, US). All experiments were carried out in triplicates and results of qPCR were assessed using ABI 7500 Fast Realtime PCR system (Applied Biosystems, Life Technologies, USA). The relative expression of miR-184 and MEG3 was determined using the 2-ΔΔCt method.
| Gene | Forward primer 5’-3’ | Reverse primer 5’-3’ |
|---|---|---|
| MEG3 | CTGCCCATCTACACCTCACG | CTCTCCGCCGTCTGCGCTAGGGGCT |
| miR-184 | TACGACTATGTGACCTGCCTG | TGGTTCAACT CTCCT TTCCA |
| GAPDH | GGCCTTCCGTGTTCCTAC | TGTCATCATATCTGGCAGGTT |
The viability of MG63 and U2OS cell lines was evaluated using CCK-8 assay that allows sensitive colorimetric determination of cytotoxicity, cell viability and cell proliferation as described previously (15). The kit was obtained from Shanghai Xiya Biotechnology Co., Ltd (Shanghai, China). and analysis was carried out 48 h post-transfection. The OD values were assessed using a spectrophotometer (Bio-Rad Laboratories, Hercules, CA, USA).
Using fluorescein isothiocyanate (FITC) -labeled Annexin V (KeyGEN Biotech, Nanjing, China), apoptosis in MG63 and U2OS cells was assessed by flow cytomerty 48 h after transfection as described previously (16). Apoptotic cells were also identified in 3 µm thick sections of OS tumors from mice by TUNEL assay by a kite (Name of company, City and state) and as described previously (17). Images (×400) were captured using a light microscope (Olympus, Tokyo, Japan).
The transfected cells were lysed with trypsin and adjusted at 1 × 10⁵ cells/mL density. Then cells added into the upper chambers coated with 150 µg of Matrigel (BD, New Jersey, USA) and the lower chamber was filled with RPMI-1640 medium containing 10% FBS. Upon 24h incubation, non-invasive cells were washed away and the invasive cells were fixed in methanol and stained with crystal violet (Sigma, MO, USA) for 15 min. Finally, the invading cells were photographed under an optical microscope (Olympus, Tokyo, Japan).
The abundance of Ki67, cleaved caspase-3, vascular endothelial growth factor (VEGF), β-catenin, T-cell factor 4 (TCF4) and c-MYC (Abcam, Cambridge, UK) were assessed by Western bloting refered to previous literature reports (18,19). GAPDH was used as the house-keeping control. Immunoreactive bands were visualized by Chemiluminescent ECL Reagent Kit (Millipore, Bedford, MA, USA). Quantitation of signal intensities was performed by densitometry on a Xerox scanner using NIH ImageJ software.
TOP/FOP-FLASH is a method for measuring intracellular β-catenin-mediated transcriptional activity (classic wnt signaling pathway). Interactions between Tcf4 and β-catenin are responsible for activation of transcription of many tumor-related proteins (20). β-catenin and TCF4 can show co-localization relationship.TOP/FOP-FLASH luciferase reporter assay was performed as reported previously (21). Briefly, transfected MG63 cells in each group were incubated with mixture containing serum-free DMEM (20 µL), β-catenin expression vector (1.5 µg), TCF4 expression vector (0.15 µg) and Renilla luciferase vector phRG-TK (0.8 ng). 24 h later, luciferase activity was measured by a luminometer (Zhongmei, Xi'an, China).
Tumor were fixed in 10% formalin, embedded in paraffin, sectioned at 3 µm and immunostained using antibodies to Ki67 (Abcam, Cambridge, UK), anti-caspase-3 (Abcam, Cambridge, UK), anti-VEGF (Abcam, Cambridge, UK), anti-β-catenin (Abcam, Cambridge, UK). using antibodies. Sections were photographed (×400) using a optical microscope.
All statistical analysis were conducted using the SPSS statistical software program (version 17.0; SPSS, Inc., Chicago, IL). The data presented in this study were expressed as means± SD. Statistical differences were analyzed by one-way ANOVA. P values < 0.05 were considered statistically significant.
The expression of MEG3 and miR-184 was assed by RT-PCR followed by qPCR. The expression of MEG3 was reduced while the expression of miR-184 was increased in OS as compared to adjacent non-involved tissues showing an inverse relationship between the expression of MEG3 and miR-184 (Figure 1A-B). Carrying out the same analysis in normal osteoblast cell line, hFOB1.19, and human OS cell lines (MG63 and U2OS) showed the same trend and of existence of an inverse relation between the expression of MEG3 and miR-184 (Figure 1C).
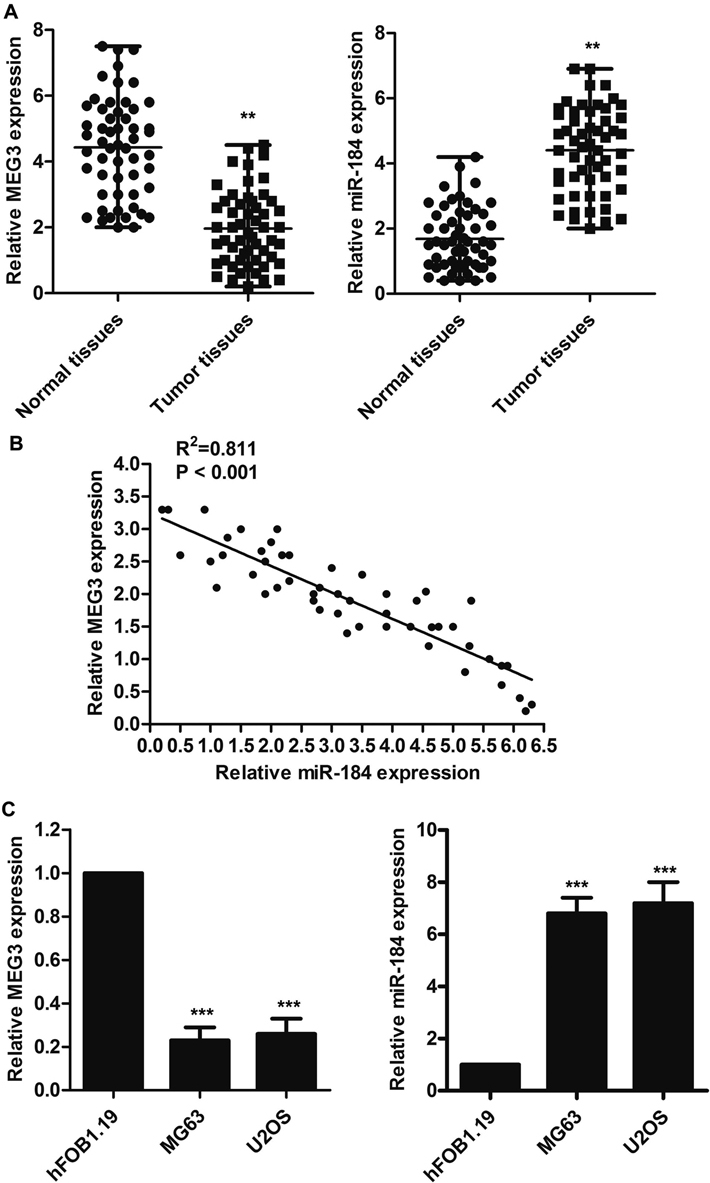 Figure 1
Expression levels of MEG3 and miR-184. A. The relative expressions of MEG3 and miR-184 were assessed by using RT-PCR followed by qPCR in normal and tumor tissues. B. Scatter diagram representing the non-linear relationship between MEG3 and miR-184 based on the result of RT-PCR followed by qPCR. C. The levels of MEG3 and miR-184 expression were quantified by RT-PCR followed by qPCR in Hfob1.19, MG63 and U2OS cell lines. The experiments were repeated at least 3 times. Error bars represent ± SD. (**P < 0.01, ***P < 0.001 versus control group; # P < 0.05, ## P < 0.01 versus control mimic group).
To decipher of the cause of such an inverse correlation, using the online software Diana Tools (http://diana.imis.athena-innovation.gr), we analyzed the MEG3 elements that were complementary to and were potetinal binding site for miR-184. This analysis revealed of existence of many elements that were complementary to miR-184 in MEG3 (Figure 2A). To formally test such an interaction, we transduced MEG63 and U2OS cells with empty control, pcDNA vector and pcDNA-MEG3(20 μg/mL). Following transduction, while the expression of MEG3 was increased significantly in MG63 and U2OS cells, the expression of miR-184 was significantly reduced (Figure 2B). In addition, we transfected MEG63 and U2OS cells with empty control, NC mimics and miR-184 mimic. Upon transfection, the expression of miR-184 was increased significantly in MG63 and U2OS cells compared with transfected by empty control and NC mimics (Figure 2C).
 Figure 2
MEG3 directly interacts with miR-184. A. The sequence of miR-184, MEG3 wt and MEG3 mut. B. The expression levels of MEG3 and miR-184 were evaluated by RT-PCR followed by qPCR in MG63 and U2OS cells transfected with or without pcDNA-MEG3. C. The level of miR-184 was assessed using RT-PCR followed by qPCR in MG63 and U2OS cells transfected with or without miR-184 mimic. D. Relative luciferase activities of wild type (WT) and mutated (Mut) MEG3 reporter plasmid in MG63 and U2OS cells co-transfected with miR-184. Description: The experiments were repeated at least 3 times. Error bars represent ± SD. (**P < 0.01, ***P < 0.001 versus control group; ## P < 0.01 versus miR-184 mimic group). Notice: the expression of MEG3 and miR-184 in the control was considered as 1; miR NC: negative control miR mimics; control: cells did not be transfected.
To further validate direct evidence for the interaction between MEG3 and miR-184, we subcloned wild-type (MEG3 -wt) and mutated (MEG3 -mut) miR-184 binding site into dual-luciferase reporters. Figure 2D shows that the relative luciferase activity of MEG3 wt in MG63 and U2OS cells were obviously reduced after co-transfection of miR-106a-3p mimic, but did not change the activity of MEG3 mut, which suggest that miR-184 is a direct target of MEG3.
Based on existence of a reverse relation between expression of MEG3 and miR-184, we formally tested the biologic impact of this relation as it relates to the proliferation, and apoptosis of OS cells. As shown in Figure 3A, cells over-expression of MEG3 inhibited cell proliferation. However, while transfection with miR-184 mimic did not by itself changed proliferation as compared to the control group, its transfection in conjunction with pc-MEG3 erased the effect of MEG3 on proliferation. Consistent with these results, flow cyomtetric analysis of apoptosis showed miR-184 mimic did not alter apoptosis while transduction with pcDNA-MEG3 increased apoptosis in OS cells (Figure 3B). However, joint transduction of cells with pcDNA-MEG3 and transfection with miR-184 decreased the apoptosis which was inducible by pcDNA-MEG3 (Figure 3B). These findings were further validated by examining the relative abundance of Ki67 as a marker of proliferation as well as cleaved caspase 3 as a measure of apoptosis (Figure 3C).
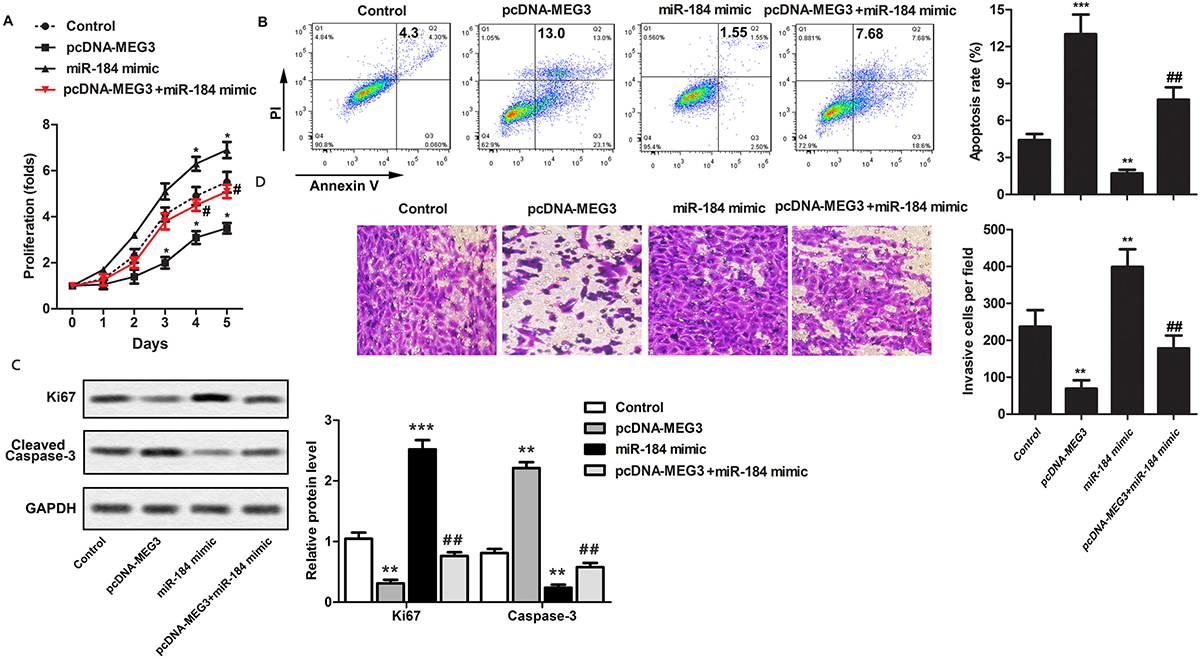 Figure 3
Up-regulation of MEG3 inhibits the OS tumor cell properties via targeting miR-184. MG63 cells were randomly divided into 4 groups: Control group, pcDNA-MEG3 group, miR-184 mimic group, pcDNA-MEG3 + miR-184 mimic group. A. The proliferation of MG63 cells was measured using CCK-8. B. Apoptosis was assessed by flow cytometric analysis of Annexin V. C. Western blotting of Ki67, and cleaved caspase-3. D. Mobility of MG63 cells was assessed by transwell assay. The experiments were repeated at least 3 times. Error bars represent ± SD. (*P < 0.05, **P < 0.01, ***P < 0.001 versus control group; # P < 0.05, ## P < 0.01 versus miR-184 mimic group).
We, then, examined the effect of MEG3 and miR-184 mimic on in vitro mobility and invasiveness of OS. Figure 3D shows that while cells that transduction with pcDNA-MEG3 decreased the number of cells that migrated from the upper to the lower chamber, this mobility was enhanced by transfection of cells with miR-184 mimic (Figure 3D). Moreover, the number of invasive cells was reduced in pcDNA-MEG3 group as compared to the control or miR-184 mimic group and this enhanced mobility was recovered after transfection with miR-184 (Figure 3D).
Given that Wnt/β-catenin is involved in tumor progression, we considered the possibility that MEG3/miR-184 might down-regulate Wnt/β-catenin in OS. To do this, we carried out Western blotting of Wnt/β-catenin including its members and effectors such as GSK3 β Axin1, APC, β -catenin, TCF4, c-Myc, using GAPDH as a houskeeping control. Transduction with pcDNA-MEG3 decreased β-catenin, TCF4 and c-MYC while transfection with miR-184 enhanced such effects (Figure 4A).
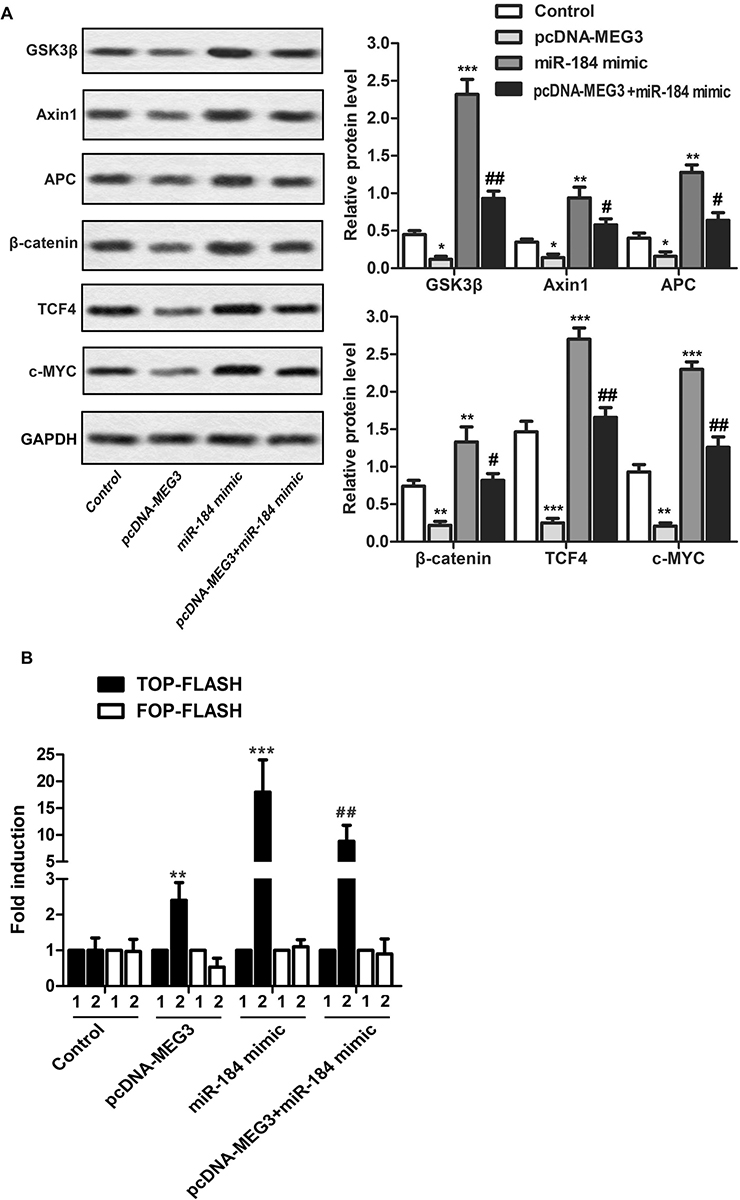 Figure 4
MEG3 suppresses the Wnt/β-catenin pathway via targeting miR-184. MG63 cells were randomly divided into 4 groups. MG63 cells were randomly divided into 4 groups: Control group, pcDNA-MEG3 group, miR-184 mimic group, pcDNA-MEG3 + miR-184 mimic group. A. Western blotting of GSK3β, Axin1, APC, β-catenin, TCF4, and c-MYC. B. lane 1: MG63 cells were transfected with the TOP- or FOP-FLASH firefly luciferase reporter plasmids including empty expression vectors, or with β-catenin and TCF-4 expression vectors. Data are presented as fold induction relative to the co-transfection of the reporter plasmid (either TOP- or FOP-FLASH) with the empty expression vectors. The experiments were repeated at least 3 times. Error bars represent ± SD. (*P < 0.05, **P < 0.01, ***P < 0.001 versus control group; # P < 0.05, ## P < 0.01 versus miR-184 mimic group).
To further validate these results, cells were transfected with Renilla luciferase vector phRG-TK (0.8 ng), β-catenin expression vector (1.5 µg), or TCF4 expression vector (0.15 µg). Compared with the control group, the expression of β-catenin was decreased in cells transfected with pcDNA-MEG3, showing lower reporter gene activity, while the cells transfected with miR-184 mimics significantly enhanced β-catenin expression, showing higher TOP-FLASH transactivation (Figure 4B).
Together, these findings show that MEG3 regulates different attributes of OS. To further validate these findings, in vivo, MG63 tumor cells were transduced without and with pcDNA-MEG3 and then the tumor volume was assessed every five days up to 30 days. In these while the expression of MEG3 was significantly increased the expression of miR-184 was highly suppressed (Figure 5C). Moreover, tumor volume was significantly decreased and the survival of mice increased in mice with tumors that were transduced with pcDNA-MEG3 (Figure 5A-B).
 Figure 5
MEG3 inhibits OS via targeting miR-184 in vivo. Nude mice were randomly divided into groups; those received MG63 tumor cells without or after being transduced with pcDNA-MEG3. Tumor volume (A), percent survival (B) were assessed on different days after introduction to the tumor cells. C. Paraffin sections of tumors were immunostained for Ki67, β-catenin, caspase 3 and TUNEL. The experiments were repeated at least 3 times. Error bars represent ± SD. (*P < 0.05, **P < 0.01, ***P < 0.001 versus control group).
Tumors that were tranduced with pcDNA-MEG3 showed a decreased β-catenin, marked reduced Ki67 and a higher level of apoptosis as evidenced by TUNEL and caspase 3 immunostaining as compared with the control group (Figure 5D ).
Available evidence suggests that lncRNAs are implicated in tumor development and that their expression is subjected to silencing X chromosome, transcriptional activation, genomic imprinting and chromatin modification (22). Here, we carried out TargetScan and miRanda and, as orginally suggested by Li J et al., the results predicted the probability of an interaction between miR-184 and MEG3 (10). Moreover, we find that the expression of miRNA-184 is signficantly increased in OS, and OS cell lines (MG63 and U2OS) while in the same tumors MEG3 was represssed. We further valided of the inverse relation between miR-184 and MEG3 using the online software Diana Tools (http://diana.imis.athena-innovation.gr), and find that the there are elements in MEG3 that are complementary to and are potetinal binding site for miR-184. Following transduction of cells with MEG3, while the expression of MEG3 was increased significantly in MG63 and U2OS cells, the expression of miR-184 was significantly reduced. We also showed that while the luciferase activity of miR-184 is reduced in MG63 and U2OS cells that overexpressed MEG3. Thus, the results of this study conform of existence of an inverse correlation between the expression of miR-184 and MEG3. Moreover, we showed that the interplay between MEG3 and miR-184 jointly regulate tumor cell attributes including proliferation, apoptosis and mobility of cancer cells lines in vitro. MEG3 overexpression led to a decreased Ki67 positive cells, while increasing caspase-3.
As previoulsy suggested, our findings are consistent with the notion that MEG3 lncRNA appears to be a tumor suppressor in OS (23). Sahin et al. showed that miR-664a and MEG3 interact and that inhibition of miR-664a interferes with the migration of osteosarcoma cells via modulation of MEG3 (5). Sun et al. demonstrated that growth and metastasis of OS cells were promoted by lncRNA EWSAT1 by repressing the expression of MEG3 (24). Moreover, the expression of miRNAs, which is regulated at a post-transcriptional level, has been shown to be deregulated in diverse forms of cancer (25). Among these, miR-184 seems to control proliferation, and apoptosis of diverse forms of cancers including ovarian cancer (7). In line with such role, the upregulation of miR-184 enhanced the malignant biological behavior of human glioma cell line A172 by targeting FIH-1 (26).
These findings are consistent with other reports including regulation of growth and migration and apoptosis in diverse tumors and cell types. For example, the proliferation of human hepatoma cells was strongly suppressed and apoptosis was induced by ectopic expression of MEG3 in vivo (27). The migration and proliferation of artery smooth muscle cells were triggered by down-regulation of MEG3 through p53 signaling pathway (28). As a prognostic factor for colorectal cancer, MEG3 promoted chemosensitivity by elevating oxapliplatin-induced cell apoptosis (29). It has also been reported that miR-184 plays an important role in proliferation of hepatocellular carcinoma by loss of INPPL1 and serves as an anti-apoptotic factor by suppressing the expression of caspase-3 and caspase-7 (30). In a nude mouse breast cancer xenograft model, overexpression of MEG3 suppressed angiogenesis and tumorigenesis (31). Similarly, in our study, the growth rate of tumor was significantly repressed while survival rate and apoptosis remarkably elevated by MEG3 overexpression in vivo.
Under normal conditions, osteoblast differentiation and bone formation appear to be under the regultion of Wnt/β-catenin pathway (32). Wnt/β-catenin pathway also seems to play a significant role in diverse cancers in regulating their proliferation, motility and differentiation. For example, Gao Y et al. showed that MEG3 negatively regulated the activity of Wnt/β-catenin pathway in the development of retinoblastoma (13). Cisplatin resistance of lung cancer cells was increased by down-regulated MEG3 via the activation of the Wnt/β-catenin (33). In keeping with these studies, we showed that in OS cell lines, MEG3 suppressed the expression of β-catenin, TCF4 and c-MYC that was inducible by miR-184 in MG63 cells in vitro and also suppressed the β-catenin only in tumor cells that were transduced with pcDNA-MEG3 in vivo. Together, the results of this study demonstrated that MEG3 is involved in regulation of OS tumor cell behavior by regulation of miR-184 and impacting the Wnt/β-catenin (Figure 6). This result can provide a basis for target research in the treatment of osteosarcoma.
 Figure 6
Schematic diagram of the regulatory mechanism of MEG3/miR-184/β-catenin axis in the inhibition of osteosarcoma proliferation.
lncRNA
long non-coding RNA
Maternally Expressed Gene 3
osteosarcoma
MicroRNA
vascular endothelial growth factor
T-cell factor 4
fluorescein isothiocyanate
Protein levels of proliferating cell nuclear antigen
B-cell lymphoma 2
matrix metalloproteinase 9
negative control mimics
wt
wild type
mut
mutant.