
Rho GTPase-activating proteins (RhoGAPs) are implicated in the development and progression of hepatocellular carcinoma (HCC). We tested the idea that RICH2 is a tumor suppressor in HCC. Consistent with this, RICH2 was downregulated in HCC and HCC cell lines and RICH2 expression negatively correlated with the tumor size, TNM stage and metastasis in HCC. RICH2, in a Cdc42 dependent manner, regulated the formation of filopodia in HCC and stable overexpression of RICH2 significantly inhibited the clone formation, proliferation and invasion of HCC cells in vitro. Gene set enrichment analysis (GSEA) showed that the expression of RICH 2 positively correlated with the expression of WNT5a, that exert antagonistic effect on canonical WNT signalling whereas RICH2 expression inversely correlated with the expression of β-catenin (CTNNB1), that is involved in the proliferation and invasion HCC. These findings concurred with co-immunoprecipation of RICH2 with endogenous Cdc42, Rac1, and β-catenin. Finally, RICH2 overexpression suppressed tumor growth in vivo. The findings support the idea that RICH2 might act as a tumor suppressor in HCC.
Hepatocellular carcinoma (HCC) is one of the most common cancers and the second leading fatal cancer worldwide (1). China alone accounts for approximately 50% (466,100) of the new cases and deaths (422,100) in 2015 (2). Gene-environment interactions are involved in the development of HCC in humans. HCC commonly occurs in patients with chronic hepatitis B and C virus infection, cirrhosis, consumption of aflatoxin B1, cigarette smoking, and heavy alcohol use (3, 4). However, the molecular mechanisms leading to the development and progression of HCC remain unclear.
In HCC, allelic losses occur and such losses are associated with more advanced tumor stages and more aggressive tumor behaviour. These losses are nonrandom chromosomal deletions which occur more commonly in the chromosome arms of 1p, 4q, 8p, 13q, 16q, and 17p (5-7). These findings suggest that continuous loss of chromosomal materials during tumor progression inactivates genes that regulate cell adhesion and growth, and provides a selection advantage for increased tumor aggressiveness (8, 9).
By using the Affymetrix Genome-Wide Human SNP Array 6.0, we identified that RhoGAP interacting with Cdc42-interacting protein 4 (CIP4) homologues 2 (RICH2) gene, which is located in 17p12, is frequently deleted in HCC (unpublished data). RICH2, also known as Rho GTPase-activating protein 44 (ARHGAP44), is a Rho GTPase-activating protein (GAP) domain-containing protein (10). This gene is a homologue of RhoGAP and interacts with CIP4 homologues (RICH1) and has selective GAP activity for the small Rho GTPases Ras-related C3 botulinum toxin substrate 1 (Rac1) and Cell division control protein 42 (Cdc42) (11). Most of the Rho GTPases cycle between guanosine triphosphate (GTP)-bound (active) and guanosine diphosphate (GDP)-bound (inactive) states (12). Rho GTP-bound forms are able to interact with and thereby activate a wide range of downstream targets, thus triggering the signalling pathways that reside downstream of Rho. GTPase-activating proteins (GAPs), which enhance the intrinsic GTPase activity, thus return the GTPases to their basal GDP-bound state (12). Based on the available evidence, Rho GTPases appear to be involved in the development and progression of human cancer (13). A growing number of studies strongly suggest that altered Rho GTPase signalling plays an important role in the initiation and progression of HCC (12). However, little is known about the function of RICH2 in HCC.
We hypothesized that RICH2 might act as a tumor suppressor in HCC. Consistent with this, the expression of RICH2 was decreased in HCC tissues and such a decrease correlated with a poor clinical outcome. RICH2 inhibits Cdc42-mediated formation of filopodia and restricts the in vitro invasion and proliferation of HCC.
After approval by the Human Research Ethics Committee, and acquiring written informed consent, ninety-three HCC and adjacent normal tissue samples were collected from patients who underwent hepatectomy. None of the patients received chemotherapy or radiation therapy before surgery. These samples were fixed in 10% buffered formalin and embedded in paraffin.
Human HCC cell lines (HepG2, HCCLM3, 97h, SK-Hep1, and Huh7) and normal human hepatocytes (HL-7702) were obtained from the China Academia Sinica Cell Repository (Shanghai, China) and maintained at 37° C with 5% CO2 in a humidified incubator. The cells were maintained in DMEM or RPMI 1640 supplemented with 10% fetal bovine serum, 100 U/ml penicillin sodium and 100 μg/ml streptomycin sulfate.
Total cellular RNA was extracted from the cells using an RNAsimple universal RNA extraction kit (TIANGEN, Beijing, China). These were reverse transcribed using a QuantiNova Reverse Transcription Kit (Qiagen, Hilden, Germany) according to the manufacturer's instructions. The expression level of RICH2 was assessed using a QuantiFast SYBR Green PCR Kit (Qiagen, Hilden, Germany) and an ABI 7500 fast real-time PCR system (ABI, Foster City, CA, US) using GAPDH as an internal control. The primers used in qPCR are included in Table 1.
| Gene | Forward primer 5'-3' | Reverse primer 5'-3' |
| GAPDH | GACAACAGCCTCAAGATCATCA | 5'-TGAGTCCTTCCACGATACCAA |
| RICH2 | CCTTCCACCCATCTCAAGTC | 5'-GGCCCCCAGAATCCTAGTAA |
Briefly, the endogenous peroxidase activity was suppressed with 3% H2O2 for 12 min. The epitope retrieval was achieve with 0.1 mol/l citrate buffer at pH 6.0. Sections from paraffin-embedded tissues were then immunostained with a rabbit polyclonal antibody to RICH2 (dilution: 1:300, Sigma, St. Louis, MO, US) followed by the MaxVision HRP-polymer anti-rabbit IHC kit (Maixin Ltd Company, Fuzhou, China). Staining was carried with 3, 3’-diami-nobenzidine (DAB) and then sections were counterstained with haematoxylin. Nonspecific IgG was used as a negative control.
Total, cytosolic and nuclear proteins were extracted using RIPA lysis and extraction buffer (Thermo Fisher Scientific, Rockford, IL, US) and a Subcellular Protein Fractionation Kit (Thermo Fisher Scientific, Rockford, IL, US) according to the manufacturer's instruction. The samples were centrifuged at 12,000 xg for 20 min and then, the supernatants were collected. Protein concentration in the supernatantas was quantitated by BCA assay (Beyotime Inc, China). Equal amounts of protein were subjected to 10% SDS-PAGE, and they were electro-transferred onto a PVDF membrane and analysed by Western blotting using an enhanced chemiluminescence system (GE Healthcare, US). Membranes were probed with primary antibodies to RICH2, Cdc42, Rac1, p-Rac1 (Sigma, St. Louis, MO, US), LIMK1, p-LIMK1, PAK1, p-PAK1, CTNNB1 (β-catenin), Wnt3, Wnt5a, and GAPDH (Abcam, Cambridge, MA, US) followed by application of horseradish peroxidase-conjugated goat anti-mouse and goat anti-rabbit secondary antibodies (Beyotime, Shanghai, China), washing and development in DAB. Band intensities were quantitated using Image J and results were normalized to the intensity of the GAPDH bands.
A RICH2 open reading frame (ORF)-expressing clone containing a cytomegalomavirus promoter and a selectable marker for neomycin resistance was obtained from GeneCopoeia (Guangzhou, China). Cell transfections were performed using X-tremeGENE HP transfection reagent (Roche, Germany) according to the manufacturer’s instructions. To establish stable RICH2-expressing clones, 24 h after transfection with the RICH2 full-length-expressing plasmid, cells were subjected to Geneticin (0.2-0.6 mg/ml) for at least 10 days. Control groups included a mock group, cells transfected with an empty pReceiver-M98 pcDNA3.1+ plasmid and a blank group that were treated with the transfection reagent. RICH2 overexpression in HepG2 and LM3 cell lines was confirmed by qPCR.
For RICH2 knockdown, three RICH2-specific short hairpin (sh) RNA lentiviruses were generated with the following sequences (GenePharma, Shanghai, China): sh1 5’-GACATGGATTCCTCACGAACC -3’, sh2 5’-GTTGGGATCATTGAACCTATC-3’, and sh3 5’-CACTTTGATATTCCCTCGATC -3’. After transfections to establish stable cell lines, cells were treated with 200 µg/mL G418 (Invitrogen, Carlsbad, CA, US). The efficacy of RICH2 knockdown was confirmed by qPCR. The sequence yielding the most effective knockdown of RICH2 was then selected for the studies.
Cell invasion assays were performed in a Matrigel-coated Transwell plate with 1 x 10⁴ HepG2 or cells or 4 x 10⁵ LM3 transfected cells 96 h after transfection. Cells were placed in 200 μl serum-free medium in the top chamber of the Transwell and the standard medium with 10% fetal bovine serum (FBS) was placed in the lower chamber. After 24 hr incubation, the membranes were isolated and fixed with formalin, stained with a 0.05% crystal violet solution, and cells were imaged and counted under a light microscope.
Cell proliferation and viability were assessed using a 3-(4-, 5-dimethylthiazol-2-yl)-2,5-diphenyl tetrazolium bromide (MTT) assay. In brief, 24 h after transfection, 100 μl culture medium with 2000 cells from each group was added, in triplicate, to each well of five identical 96-well plates. The absorbance (490 nm) of samples was measured at 24 h, 48 h, 72 h, 96 h, and 120 h after inoculation.
For the colony formation assay, transfected cells were seeded into 6-well plates at a final concentration of 2500 cells per well and dishes were incubated for two weeks. Cells were fixed with methanol and visualized by 1% crystal violet staining.
Cells were fixed in 2.5% glutaraldehyde and 2% paraformaldehyde, postfixed with 1% OsO4, dehydrated in a graded series of acetone, and critical point dried. Samples were sputtered with gold and examined with a scanning electron microscope (S4800, HITACHI Ltd, Japan).
Membrane protrusions supported with F-actin bundles were defined as filopodia in SEM analysis. Digital images were acquired at 500-5,000x magnification. The quantity and lengths of filopodial determined with Image J software as previously described (12). Filopodial quantity was determined in five randomly selected cells from each group. Length, of filopodia was assessed in five filopedia for each randomly selected cell.
HepG2 cells were suspended in 100 μL PBS and injected subcutaneously into the right flanks of 5-week-old male Balb/c nude mice (1×10⁷ cells/mouse). Mice were housed in a pathogen-free animal facility and assigned randomly to the control or experimental group (five mice per group). Tumor volume was quantiated every 4 days using the following formula:
Tumor volume=1/2 × length × width2
All mice were sacrificed after 34 days. The animal study was carried out in accordance with the guidelines approved by the Animal Experimentation Ethics Committee of the institution.
LIHC (liver hepatocellular carcinoma) cohort was obtained from TCGA (https://tcga-data.nci.nih.gov/tcga/) and analysed by GSEA as previously described (15). GSEA was performed with the JAVA program (http://www.broadinstitute.org/gsea) using MSigDB (c2.cp.kegg.v6.2.symbols.gmt). The expression level of the RICH2 gene was used as a phenotype label, and ‘Metric for ranking genes’ was used for the Pearson correlation.
A RICH2 antibody was coupled with protein A-Sepharose beads (Sigma, St. Louis, MO, US) in RIPA buffer for 2 h or overnight at 4 °C. The immune complexs were then added to cell lysates and incubated at 4 °C for 2 h. After centrifugation, the immunoprecipitates were resuspended in Laemmli sample buffer, boiled at 95-100 °C for 5 min, separated on SDS-PAGE gels, transferred onto PVDF membranes and analysed by Western blotting.
The data were analysed using version 17.0 of SPSS (SPSS, Chicago, IL, US) software. Three independent experiments were performed, and the values are presented as the mean ± SD. Continuous variables between two groups were analysed using independent Student’s t-tests, categorical variables were analysed using Pearson's χ2 tests, and the differences among three or more groups were assessed by a one-way analysis of variance. A two-tailed p value < 0.05 was considered statistically significant.
Microarray-based gene expression data in UALCAN based on the Cancer Genome Atlas revealed that RICH2 expression, at RNA and protein levels, was significantly (P<0.01) lower in HCC as compared by adjacent normal tissue (P<0.0001)(Figure 1A-B)(16). RICH2 was detected in 94.6% (88/93) of normal liver tissues and only in 64.5% (60/93) of HCC tissues. Comparatively, RICH2 expression in tumor cells was absent or present at a lower level in 66.7% (62/93) of the cases and at an equal or a greater level in 33.3% (31/93) of the HCC cases (Table 2). The RICH2 mRNA in five HCC cell lines (HepG2, HCCLM3, 97h, SK-Hep1, and Huh7)) was significantly lower as compared with the expression found in the normal human hepatocytes (HL-7702) (Figure 1C). Similarly, the protein expression of RICH2 in five HCC cell lines was significantly lower than that in a normal liver cell line (Figure 1D). These data indicated that RICH2 expression is downregulated in HCC.
| Variants | n | RICH2 expression | p value | |
| High | Low | (2-sided) | ||
| Total cases | 93 | 31 | 62 | |
| Age (years) | 0.183 | |||
| ≤50 | 40 | 10 | 30 | |
| >50 | 53 | 21 | 32 | |
| Gender | 0.096 | |||
| Male | 81 | 24 | 57 | |
| Female | 12 | 7 | 5 | |
| HBsAg | 0.347 | |||
| (+) | 80 | 25 | 55 | |
| (-) | 13 | 6 | 7 | |
| AFP(µg/L) | 0.235 | |||
| <20 | 28 | 12 | 16 | |
| ≥20 | 65 | 19 | 46 | |
| Tumuor size (cm) | 0.0411 | |||
| ≤5 | 34 | 16 | 18 | |
| >5 | 59 | 15 | 44 | |
| Live cirrhosis | 0.508 | |||
| Yes | 55 | 20 | 35 | |
| No | 38 | 11 | 27 | |
| Metastasis | 0.0081 | |||
| Yes | 43 | 8 | 35 | |
| No | 50 | 23 | 27 | |
| TNM stage | 0.0261 | |||
| i—ii | 41 | 19 | 22 | |
| iii—iv | 52 | 12 | 40 | |
| 1p<0.05, Statistical analyses by Pearson's c2 test or Fisher’s exact test. | ||||
 Figure 1.
(A) In the TCGA dataset, RICH2 is downregulated in HCC tissues compared with that in normal tissues. (B) RICH2 protein IHC staining in HCC tissues. The staining is negative (left) or weaker (right) than that of the adjacent non-tumor cells. T: Tumor, NT: Non-tumor tissues. scale bars, 100 μm. (C) RICH2 expression as assessed by qPCR is lower in HCC cell lines as compared with that in normal liver cell line. (D) As assessed by WB, RICH2 is lower in HCC cell lines than in a normal liver cell.
While, there was no significant correlation between RICH2 expression and age, HBV positivity, AFP level, tumor number, vascular invasion, or presence of liver cirrhosis, RICH2 expression was negatively correlated with tumor size (p=0.041), TNM stage (p=0.026) and metastasis (p=0.008) in a total of 93 patients with HCC with 31 showing a high and 62 having a low expression of RICH2 in their HCC (Table 2).
To further explore the role of RICH2 in tumor progression, we examined its impact on formation of filopodia. Compared with the control cells, RICH2 overexpression in HepG2 and LM3 HCC cells significantly reduced the number of filopodia from 39.2±9.88 to 14.2±3.11 (p=0.001) and from 75.2±13.71 to 41.8±11.98 (p=0.003), respectively (Figure 2). Overexpression of RICH2 in HepG2 and LM3 HCC cells also significantly decreased the length of filopodia from 8.56±2.27µm to 2.16±0.73 µm (p<0.001) and from 12.0±3.05 µm to 6.58±1.70 µm (p=0.009), respectively (Figure 2). Whereas the mock group of LM3 cells frequently exhibited a sucker-like structure in the terminus of filopodia, similar structures were lacking after RICH2 overexpression.
In contrast, knockdown of RICH2 in the 97h HCC cell line had the opposite effect and significantly increased the number of filopodia from 28.8±8.26 to 47.4±9.34 (p=0.01) and also significantly increased the length of filopodia from 7.74±1.78 µm to 12.92±2.09 µm (p=0.003) and led to formation of branches (Figure 2).
 Figure 2.
The filopodia are less abundant, are thinner and shorter in length after RICH2 overexpression in HepG2 and LM cells. However, filopodia are thicker and longer in 97h cells after RICH2 knockdown and such changes are reversed by the Cdc42-selective inhibitor ZCL278. scale bars, 10 μm. The white dashed rectangle in the left panel indicates the region in the middle panel that is magnified, and the black dashed rectangle in the middle panel shows the region in the right panel that is magnified. The black triangle shows a sucker-like structure in the terminus of the filopodia. The black asterisk shows a secondary filopodia branch.
Consistent with the vital role of Cdc42 in formation of filopodia, the Cdc42-selective inhibitor, ZCL278, antagonized the changes in filopodia induced by RICH2 knockdown suggesting that RICH2 effects are mediated by Cdc42 (Figure 2).
RICH2 knock-down by shRNA or its overexpression of did not impact the migration of the HCC cell line and control NC groups (Figure 3A). On the other hand, knock-down led to increased the invasive property of 97h HCC cell line as compared with that of the blank and NC groups while RICH2 overexpression had the opposite effect and led to increased invasion of HepG2 and LM3 HCC cell lines (Figure 3B).
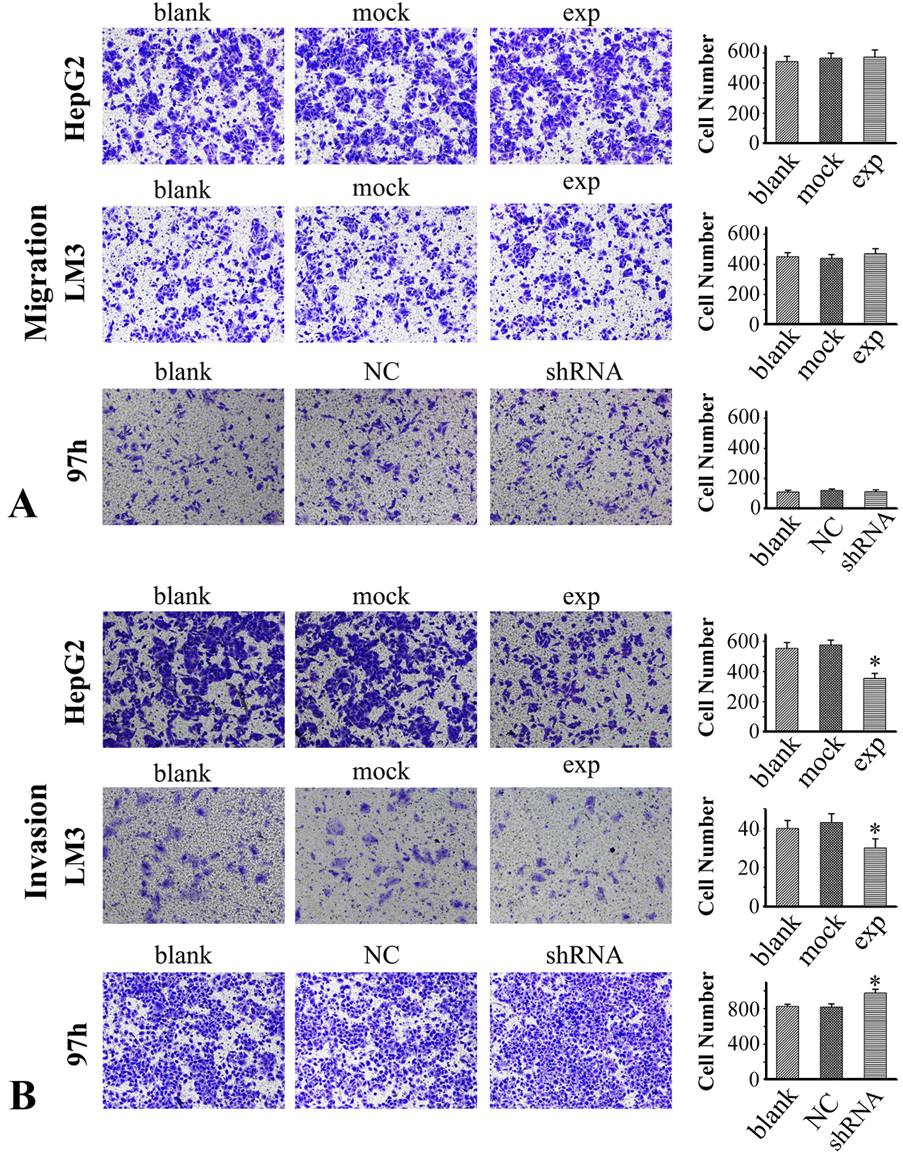 Figure 3.
(A) Migration in HepG2 and LM3 cells that overexpress RICH2 and in 97h cells with RICH2 knockdown. (B) Invasion in HepG2 and LM3 cells that overexpress RICH2 and in 97h cells with RICH2 knockdown. The data represent the means ± SD from three independent experiments. Blank: cells with no transfection; Mock: cells transfected with empty pcDNA3.1 vector; NC: negative control group transfected with GFP lentiviral vectors. *p< 0.05.
As compared with negative control cells, RICH2 knockdown with the shRNA led to an increased clone formation (Figure 4A) and proliferation (Figure 4B) in 97h HCC cell line. In contrast, as compared with the cells, transfected with the empty plasmid, RICH2-overexpressing LM3 and HepG2 cells showed a decreased ability to form clones (Figure 4A) and to proliferate (Figure 4B).
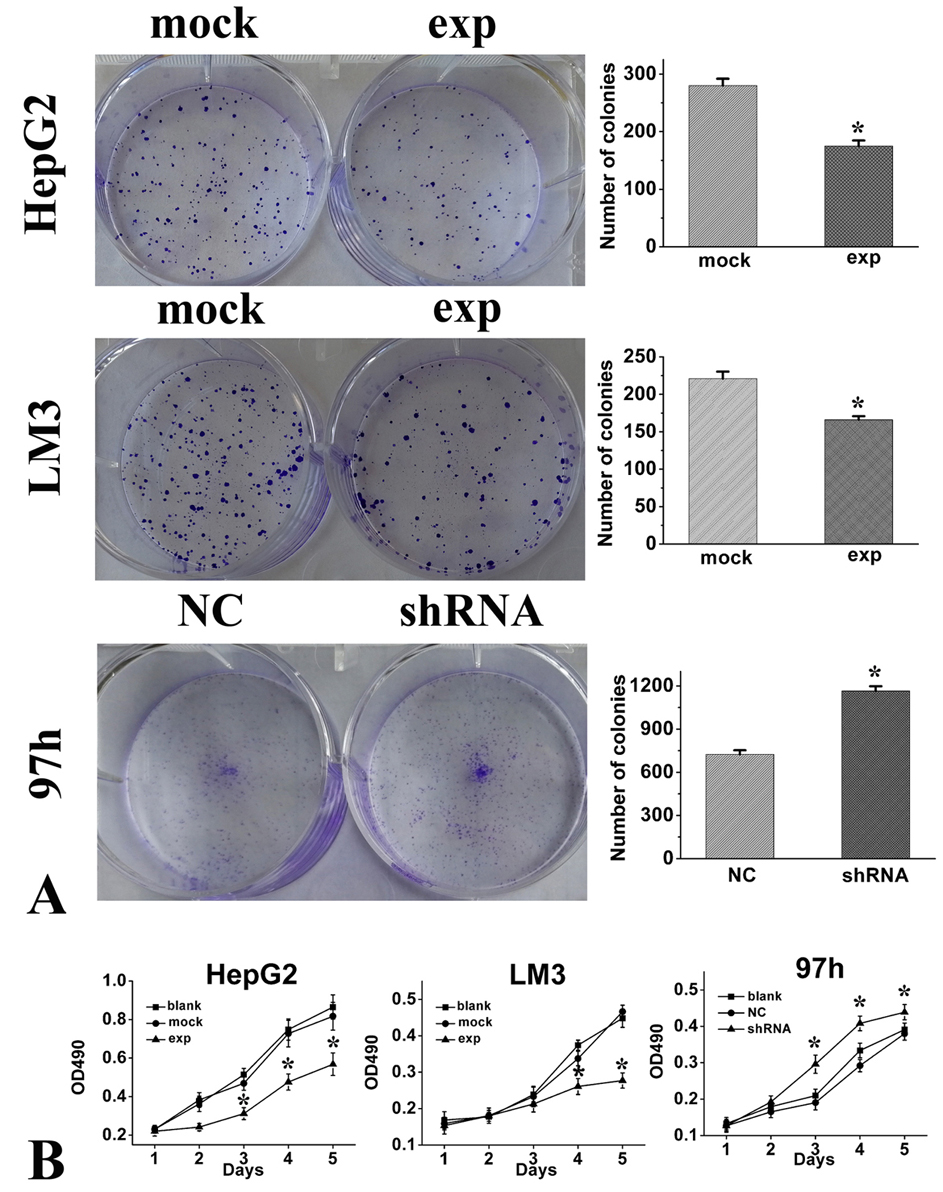 Figure 4.
RICH2 inhibited HCC cell clone formation and proliferation in vitro. (A) Colony formation assays for evaluating the proliferation of HepG2, LM3, and 97h cells and count statistics for the colony formation assay. (B) MTT assays were performed. HepG2 and LM3 cells were transfected with a mock or RICH2 plasmid, and 97h cells were transfected with NC or shRNA. At the indicated time points, the numbers of cells per well were measured according to the absorbance (490 nm). The data are presented as the means ± SD. *p < 0.05.
To directly show the role of RICH2 in tumorigenicity, equal numbers of HepG2 cells that were stably expressed with either a MOCK or RICH2 construct were subcutaneously introduced into nude mice, and tumor size were determined every four days for 34 days (Figure 5). Although MOCK or RICH2 cells formed tumors, the size (volume and weights) of the tumors were significantly lower in RICH2-overexpressing cells (Figure 5). Collectively, these findings indicated that the overexpression of RICH2 suppresses tumor growth in vivo.
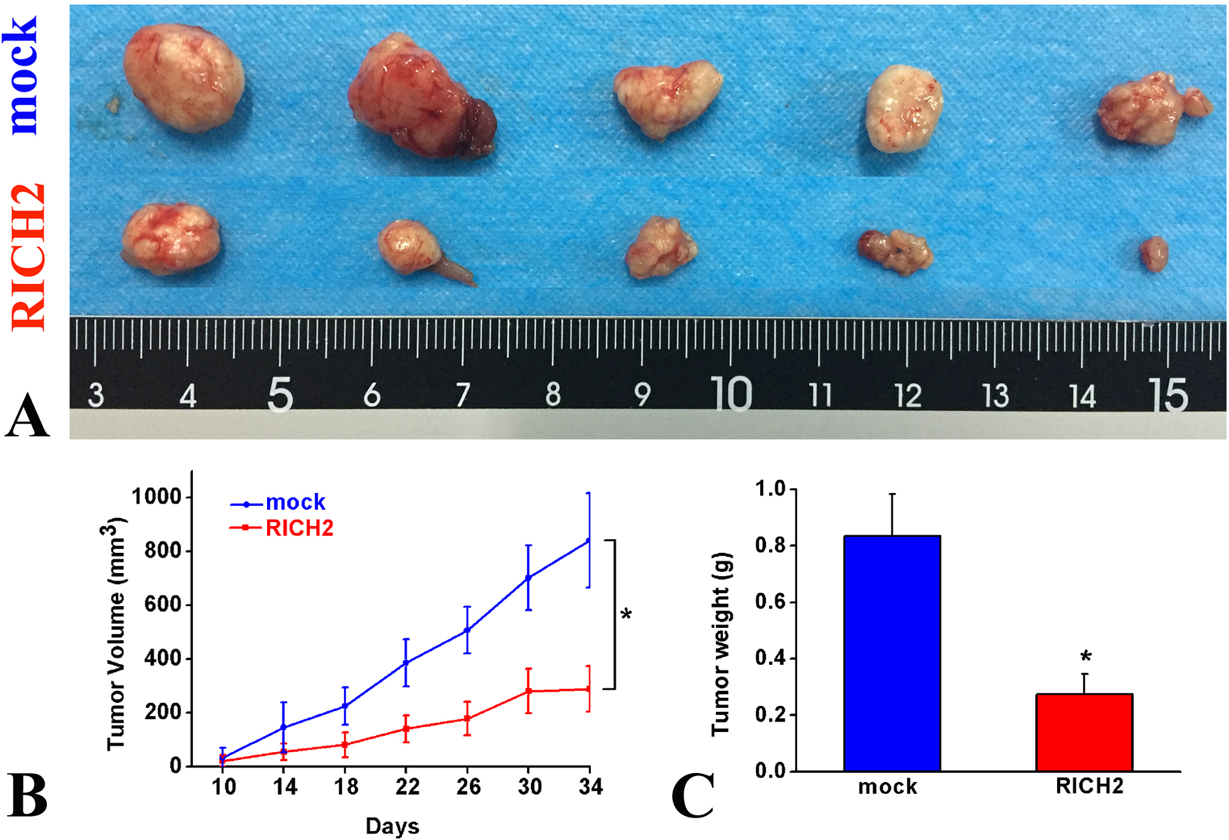 Figure 5.
(A) Representative images showing the nude mouse tumors in the mock transfected and and RICH2-overexpressing group. (B) Tumor size. (C) Weights of tumors. The data are presented as the mean ± SD. n=5, *p< 0.05.
To further probe the RICH2-associated pathways on an unbiased basis, we performed GSEA using data from an HCC cohort from TCGA (374 patients) (Figure 6A). GSEA is designed to detect coordinated differences in the expression of predefined sets of functionally related genes (17). This analysis showed a significant correlation between the expression of RICH2 and the members of KEGG WNT signaling pathway (Figure 6A).
 Figure 6.
(A) GSEA of a TCGA hepatocellular carcinoma dataset reveals a strong association between RICH2 expression and the expression of the members of KEGG WNT pathway. (B) Western blotting of RICH2, WNT3, WNT5a, and β-catenin in RICH2-overexpressing LM3 cells. (C) Normalization of protein levels using GAPDH as the housekeeping control gene. (D) Western blotting of Cdc42, PAK1, p-PAK1, LIMK1, p-LIMK1, RAC1, and p-RAC1 in RICH2-overexpressing LM3 cells. (E) Normalization of protein levels using GAPDH as the housekeeping control gene. (F) Immunoprecipitation (IP) of Cdc42, Rac1, and β-catenin with Rich2 using a rabbit anti-Rich2 antibody in LM3 cells. The data shown as the mean± S.D. *p<0.05 were obtained in at least three independent experiments.
Consistent with such correlative results, overexpression of RICH2, positively correlated with the expression of WNT5a, that exert antagonistic effect on canonical WNT signalling whereas its expression inversely correlated with the expression of β-catenin (CTNNB1), that is involved in the proliferation and invasion HCC (Figure 6B-C).
RICH2 is a potent GTPase-activating proteins for the small Rho GTPases Rac1 and Cdc42. Consistent with this, the expression of Cdc42, Rac1, and LIMK1 was higher in the cells overexpressing RICH2 than in the control cells (Figure 6D-E). Moreover, endogenous Cdc42, Rac1, and β-catenin co-immunoprecipitated with RICH2 (Figure 6F).
RICH2 is a RhoGAP protein that negatively regulates Rho GTPases. The roles of RhoGAP proteins including Deleted in Liver Cancer 1 (DLC-1) and Deleted in Liver Cancer 2 (DLC-2), have been documented in the development and progression of HCC (9, 18). However, little is known about the role of RICH2 in HCC. The findings provided here show that RICH2 is significantly downregulated in HCC as compared to the corresponding adjacent normal tissues. Moreover, the RICH2 expression negatively correlates with tumor size, metastasis, and TNM stage.
RICH2 appear to have a vital role in the organization of the sub-apical actin cytoskeleton of polarized epithelial cells (19). In neurons, RICH2 controls dendritic spine morphogenesis, regulates synaptic spine plasticity and limits the formation of new filopodia. Such findings suggest that RICH2 direct the neurons to transition from a dynamic exploratory mode to a mature, more static, state (10, 20).
Recent findings in the human non-small cell lung carcinoma cell line, H1299, suggests that, by antagonizing mutant p53, RICH2 functions in cell spreading, and invasion and might act as a tumor suppressor (21-22). Our findings are consistent with this hypothesis since, overexpression of RICH2 in two HCC cell lines, results in a significant inhibition of filopodia formation in a Cdc42-dependent manner, proliferation, clone formation, and invasion and suppression of tumorigenicity in nude mice. On the other hand, the downregulation of RICH2 by shRNA transfection in HCC cell lines that overexpress RICH2 has opposite effects. There are additional findings that support the viewpoint that RICH2 is a tumor suppressor. For example, reduced expression of RICH2 in HCC significantly correlates with the TNM stage and chance of metastasis.
Cancer cell migration, invasion, and metastasis are preceded by the formation of filopodia. The role of RICH2 in formation of filopedia, rod-like extensions of tightly bundled actin fibres that penetrate into the surrounding environment to detect and assimilate signals that play important roles in invasion and migration. These functions are consistent with the well known functions of the small Rho GTPases Cdc42, Rac1, and RhoA in actin remodelling (23). More specifically, RICH2 has GAP activity that is selective for Rac1 and Cdc42 (11). While Rac1 is involved in formation of lamellipodia and membrane ruffle, Cdc42 is involved in formation of filopodia (24, 25). Intriguingly, metastatic cells are rich in filopodia-like structures and development of these structures directly correlates with the tumor invasiveness (26). In the HCC cells, the reduction of filopodia contributes to the lower ability of the tumor cells to invade surrounding tissues, an effect that is mediated through Cdc42.
We showed by gene set enrichment analysis that RICH2 expression inversely correlates with the expression of β-catenin, a member of KEGG WNT pathway that is involved in the proliferation and invasion of mouse and human cancers including HCC (27-29). Furthermore, fascin, an actin-bundling protein that is essential for filopodia formation and cancer cell invasion, is a direct target of the beta-catenin/Tcf signalling pathway (30). On the other hand, the expression of RICH2 positively correlated with the expression of WNT5a, a noncanonical WNT pathway ligand, that is best known for its antagonistic effect on canonical WNT signalling (31-32). Moreover, forced RICH2 overexpression significantly increased the expression of Wnt5a. Together, these results are consistent with the idea that RICH2 acts as a tumor suppressor in HCC.
Jiarui Zhang and Chen Yang contributed equally to the manuscript. This work was supported by the National Natural Science Foundation of China (No.81372226 (WZ) and No.81701304 (CY)), the National Key Basic Research Development Program (973 Program) of China (No.2015CB553700 (WZ)), the Shaanxi Province Innovation Project Co-ordinator (No.2011KTCL03-11 (WZ)), and the Shaanxi Province General Project (No.2017SF-150 (JRZ) and No.2017SF-176 (CY)).
Abbreviations: RhoGAPs: Rho GTPase-activating proteins; HCC: hepatocellular carcinoma; GAP: GTPase-activating protein; CIP4: Cdc42-interacting protein 4; RICH-1: RhoGAP interacting with CIP4 homologues; RICH2: RhoGAP interacting with Cdc42-interacting protein 4 (CIP4) homologues 2; Rac1: Ras-related C3 botulinum toxin substrate 1; Cdc42: Cell division control protein 42; GTP: guanosine triphosphate; GDP: guanosine diphosphate ; TNM: T:Tumor, N:Lymph Node, M:Metastasis; DLC-1: Deleted in Liver Cancer 1; DLC-2: Deleted in Liver Cancer 2; qRT-PCR: quantitative real-time PCR analysis; IHC: immunohistochemistry; WB: western blotting; ORF: open reading frame; FBS: foetal bovine serum; MTT: 3-(4-, 5-dimethylthiazol-2-yl)-2,5-diphenyl tetrazolium bromide; SEM: scanning electron microscopy; GSEA: gene set enrichment analysis