
Silver nanoparticles (AgNPs) are commonly found in consumer products due to their antimicrobial properties. This study evaluated the effects of AgNPs on the murine macrophage cell line RAW 264.7 and human whole blood cell cultures (WBCs). Effects of AgNPs on RAW cells were assessed in the presence or absence of lipopolysaccharide (LPS). Effects of AgNPs on WBCs were monitored under basal conditions and in the presence of either LPS or phytohaemmagglutinin (PHA). AgNPs were cytotoxic to WBCs at 250 μg/ml. Under basal conditions, RAW cells ≥ 62.5. μg/ml and WBCs > 25 μg/ml AgNPs induced biomarkers associated with inflammation. Under LPS stimulated conditions, 250 μg/ml AgNP inhibited biomarkers associated with inflammation for both cultures. Under basal conditions, and in the presence of 250 μg/ml AgNP, WBCs produced acquired immune system cytokines IL-10 and IFNγ. IL-10 synthesis by WBCs was partially inhibited by 250 μg/ml AgNP in the presence of PHA. Proteome profiles of RAW cell supernatants show that AgNPs modulate biomarkers associated with inflammation. WBCs proteome analysis shows modulation of biomarkers associated with anti-inflammatory effects.
Commercial silver nanoparticle (AgNP) production has increased rapidly, with 420 tons produced in 2014 alone. Due to the potent antimicrobial properties of AgNPs, it is predicted the production of AgNPs will increase due to consumer demands. Silver nanoparticles are commonly found in a wide range of consumer products ranging from cleaning products, food, and health and fitness products (1). However, relatively little is known about the toxicological risks posed by these nanoparticles on human and environmental health. This attributes to the rapid increase in research data on the toxicological effects of AgNPs.
In vitro AgNP exposure studies have been conducted on several mammalian immune system cell line types such as human THP-1 monocytes, human peripheral blood mononuclear cells (PMBCs), and the murine macrophage cell line RAW 264.7. Some studies found that the smaller the diameter of the nanoparticle, the greater the toxicity and level of inflammatory biomarker produced by these cells. This was regardless of the concentration range investigated (2-5). There are also conflicting reports on the effects on AgNPs where some reports indicate that no negative effects were seen (6-8). However, the mechanisms whereby AgNPs cause these effects are not fully understood.
It is important to understand the mechanism whereby nanoparticles interfere with biological processes to develop strategies to prevent adverse effects. Proteomics would be key in comprehending this dilemma, as proteomics plays a vital role in aiding the discovery of pathways behind certain cellular processes (9). To date only a limited number of proteome profiles of cells treated with AgNPs have been conducted. These include various bacteria such as Eschericia coli, Bacillus subtilis, and Staphylococcus aureus to evaluate the antimicrobial properties of AgNPs (10, 11). However, none has investigated the effects of AgNPs on macrophages, which is one of the first immune cells the AgNPs encounter in the immune system (12).
The aim of this study was to evaluate the effects of AgNPs on murine macrophages and human whole blood cell cultures (WBC) by monitoring cell viability, inflammatory biomarkers, and cytokines of the acquired immune system. Furthermore, proteome profiling of cells were also conducted to identify potential biomarkers that can be used in future biomonitoring studies.
Silver nanopowder, with poly(vinyl pyrrolidone) (PVP) as a dispersant were purchased from Sigma-Aldrich (Cat. No.576832) and were subsequently characterized by Walters et al,. The nanoparticles were noted to be spherical. Transmission electron microscopy (TEM) of the dry particles revealed that 65 % of the silver nanoparticles were 10 nm in diameter, while a lower percentage (≤ 5 %) was between 50-100 nm. When in an aqueous solution (H2O), ~35 % of the particles were between 20-40 nm and ~15 % were between 70-1000 nm in diameter.
A freshly prepared stock solution (5 mg/ml) of silver nanoparticles in distilled water was used for each experiment. The nanoparticles were subjected to sonication for 5 mins (QSonica, LLC. Misonix sonicators, XL-200 Series) prior to cellular exposures.
The murine macrophage cell line, RAW 264.7, was obtained from American Type Culture Collection (ATCC TIB-71). Cells were maintained in Roswell Park Memorial Institute 1640 (RPMI 1640) media (Sigma-Aldrich) supplemented with 5 % heat inactivated fetal bovine serum (FBS) (Biowest), glutamax (Thermofisher), gentamicin (Sigma-Aldrich) and antibiotic/antimycotic mixture (Sigma-Aldrich). Cells were grown in non-treated tissue culture flasks (SPL Life Sciences) and were subjected to standard tissue culture conditions (37°C and 5 % CO2), with sub-culturing occurring approximately every 2-3 days.
Cells were cultured (1 x 10⁶ cells/ml) in 48 well tissue culture treated plates (Falcon) in complete Dulbecco’s Modified Eagle’s Medium (DMEM) (Lonza). The complete medium was supplemented with 10 % heat inactivated FBS, glutamax, gentamicin and antibiotic/antimycotic mixture. Cells were incubated overnight at 37 °C and 5 % CO2. Cells were then pre-exposed to various concentrations of AgNPs for 2 hrs. Thereafter, cells were either left unstimulated or stimulated with 0.2 μg/ml lipopolysaccharide (LPS). Unstimulated or stimulated samples were incubated overnight (~18 hrs) under standard tissue culture conditions. After the overnight incubation, supernatants were removed, and centrifuged at 12 100 rcfs for 3 mins. Supernatants were used immediately for analysis of nitric oxide (NO), interleukin 6 (IL-6), macrophage inflammatory protein 1α (MIP-1α), MIP-1β, MIP-2, and proteome profiling.
After the overnight incubation, supernatants were removed and cells washed with Dulbecco’s Phosphate Buffered Saline (DPBS) (Lonza). Thereafter, 150 μl of a 1/10 v/v dilution of 2-(4-Iodophenyl)-3-(4-nitrophenyl)-5-(2,4-disulfophenyl)-2H-tetrazolium (WST-1) (Roche) reagent in complete medium was added to each well. Metabolically active cells convert WST-1 reagent to a formazan that can be measured spectrophotometrically. Formazan formation was determined by reading the plate at 450 nm (Multiskan Ex, Thermo Electron Corporation) immediately after WST-1 addition and again after an incubation period of 1 hr at 37 °C. The increase in absorbance at 450 nm is proportional to formazan formation. The level of fomazan formed is directly proportional to cell viability.
This assay is based on the Griess reaction. The amount of nitrite produced by cells was determined using the supernatants. This was used as an indicator of the amount of NO produced upon exposure to the AgNPs. The total NO produced was measured against a doubling dilution range of nitrite standard (Sigma-Aldrich), with an initial concentration of 100 μM (covering 8 concentrations). Nitrite standards or culture supernatant collected (100 µl) were mixed with 100 µl of Griess reagent (1:1 of 1 % sulfanilamide and 0.1 % naphtylethlemidimine-dihydrochloride in 2.5 % phosphoric acid) (all reagents obtained from Sigma-Aldrich). Thereafter, the plate was incubated at room temperature for 15 min. The absorbance was read at 540 nm using a microplate reader (Multiskan Ex, Thermo Electron Corporation). The amount of NO produced by the RAW cells quantified using a standard curve constructed by Excel.
A mouse IL-6 ELISA (e-Bioscience, Ready-Set-Go) kit was used to measure cytokine levels in cell culture supernatants. The kit contained all the reagents for the assay and was performed as per the manufacturer’s instructions. The assay was performed in Nunc maxisorb plates (Nunc, Germany). Supernatants from cells not stimulated with LPS were assayed at a 1/5 v/v dilution in assay diluent, while supernatants of cultures stimulated with LPS were assayed at a 1/40 v/v dilution in assay diluent.
A commercially available antibody array kit (Proteome Profiler, Mouse cytokine Array Panel A, R & D Systems) was used. The kit screens for 40 proteins in duplicate on a nitrocellulose membrane using a dot blot assay. The kit contained all the reagents for the assay and was performed as per the manufacturer’s instructions. This cytokine and chemokine antibody array was used to determine the effects of AgNPs on cytokine and chemokine secretion when exposed to RAW 264.7 macrophage cells. The assay required 500 μl of cell culture supernatants. Supernatants from cultures incubated (a) without LPS and AgNPs, (b) in the presence of 250 μg/ml AgNPs without LPS, (c) in the presence of LPS without AgNPs, and (d) in the presence of LPS and 250 μg/ml AgNPs were screened. Membranes were subjected to chemiluminescence (UVP, Biospectrum Imaging System, Chemi HR 410) in 30 sec intervals to reveal sample-antibody complexes labeled with streptavidin-HRP. Photographs were taken at the end of each exposure period.
Membrane images were quantified using the image processing and analysis Java software, ImageJ. Levels of cytokines and chemokines were expressed as a percentage of the reference spot. Microsoft Excel was used to calculate the percentages which are expressed as mean ± standard deviation (SD).
The upregulated cytokines and chemokines detected by the proteome profiler were selected for ELISA quantification. The cytokines and chemokines selected belonged to the MIP family, namely; MIP-1α, MIP-1β and MIP-2.
Mouse MIP-1α, MIP-1β and MIP-2 ELISAs (R & D Systems) were performed on the unstimulated and LPS stimulated culture supernatants of the RAW 264.7 macrophage cells subjected to 0, 31.25 and 250 μg/ml AgNP exposure respectively. The kits contained all the reagents required for the ELISA and assays were performed as per the manufacturer’s instructions. The samples were all diluted in reagent diluent, 1 % bovine serum albumin (BSA) (w/v). The MIP-1α unstimulated culture supernatants were assayed at 1/27 v/v and stimulated supernatants at a 1/1000 v/v dilution. For the MIP-1β ELISA, the unstimulated culture supernatants were assayed at 1/2 v/v while the LPS stimulated supernatants were assayed at a 1/500 v/v dilution. While the MIP-2 ELISA unstimulated supernatants were assayed undiluted and the mitogen stimulated supernatants were used at a 1/100 v/v dilution.
Blood was collected by a health practitioner, in a clinical practice, from healthy males who were not using any medication. Ethical clearance to collect blood was obtained from the University of the Western Cape (Ethics No.10/9/43). Informed consent was also obtained from the participant. The blood was collected using venipuncture directly into 3.2 % sodium citrate vacuum tubes (Greiner bio-one). The blood was processed immediately. The preparation of whole blood for cell culture was performed under sterile conditions.
Human whole blood was diluted with RPMI 1640 media to give a 10 % v/v mixture. Blood was either left unstimulated or stimulated with LPS (Sigma-Aldrich) (0.1 µg/ml). Unstimulated or LPS stimulated WBCs were incubated overnight with various concentrations of AgNPs (2.5, 25 and 250 μg/ml) or 0.1 % Tween20 v/v (Merck) in 48 well cell culture trays (Falcon) at 37 °C. After the incubation period, culture supernatants were collected and screened for IL-6 and MIP-1β (R & D Systems) using commercially available ELISA kits.
Human whole blood was diluted with RPMI 1640 media (Sigma-Aldrich) to give a 10 % v/v mixture. Blood was either left unstimulated or stimulated with phytohaemmagglutinin (PHA) (Sigma-Aldrich) (16 µg/ml). Unstimulated or PHA stimulated WBCs were incubated overnight with various concentrations of AgNPs (2.5, 25 and 250 μg/ml) or 0.1 % Tween20 v/v in tissue culture treated 48 well plates at 37 °C. After the incubation period, culture supernatants were collected and screened for interleukin 10 (IL-10) and interferon gamma (IFNγ) using commercially available ELISA kits (e-Bioscience).
The assay was performed as per the manufacturer’s instructions (BioVision, LDH-Cytotoxicity Colorimetric Assay Kit II). Unstimulated culture supernatants were used for the assay. Briefly, 100 μl of LDH reaction mix was added to 10 μl sample supernatants and incubated for 30 mins at room temperature. Thereafter, plates were read at 450 nm. The amount of LDH in supernatant is directly proportional to cytotoxicity.
Human DAS ELISA kits (IL-6, IL-10 and IFNγ) (e-Bioscience, Ready-Set-Go) and MIP-1β (R & D Systems) were used to measure cytokine levels in WBC supernatants. Supernatants used for IL-6 and MIP-1β analysis were diluted 1/10 v/v in assay diluents while the supernatants for IL-10 and IFNγ were assayed undiluted. Assays were performed in 96 well Nunc maxisorb plates (Nunc, Germany). The kits contained all the reagents for the assay and were performed as per the manufacturer’s instructions.
A commercially available proteome profile kit (Proteome Profiler, Human Cytokine Array Kit, R & D Systems) was used. The kit screened for 36 proteins in duplicate on a nitrocellulose membrane using a dot blot assay. The kit contained all the reagents for the assay and was performed as per the manufacturer’s instructions. Supernatants from cultures incubated (a) without LPS and AgNP, (b) in the presence of 25 μg/ml AgNP without LPS, (c) in the presence of LPS without AgNP, and (d) in the presence of LPS and 25 μg/ml AgNPs were screened. The same procedure was followed as previously stated. Membranes were subjected to a ultra sensitive chromogenic 3,3’,5,5’-Tetramethylbenzidine (TMB) membrane substrate (Thermo Scientific) to reveal sample-antibody complexes labeled with streptavidin-HRP. Photographs were taken of the blots after the exposure to the substrate. Quantification of pixel density was calculated as previously mentioned.
Assays were performed in triplicate. Data was calculated using Microsoft Excel and is presented as mean ± SD. One way analysis of variance (ANOVA) using SigmaPlot 12.0 was used to assess statistical differences with P 0.0.1 being deemed significant.
Unstimulated RAW cell cultures exposed to 50 and 250 μg/ml AgNP in the presence of 2 % FBS notably (P < 0.0.01) decreased cell viability compared to the control (Figure 1a). RAW cells in the presence of 10 % FBS exposed to the highest concentration of AgNP, 250 μg/ml significantly (P < 0.0.01) decreased metabolic function compared to the control.
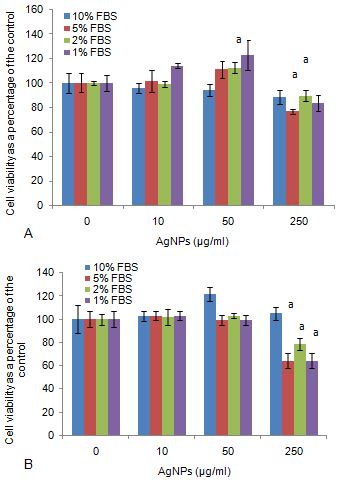 Figure 1
Cell viability of RAW 264.7 macrophage cells exposed to various FBS and AgNP concentrations in (a) the absence of LPS or (b) the presence of LPS. Data represents mean ± SD with n = 9. Bars marked with letters indicate significant difference (P < 0.0.1). Significance demarcated by: a- significantly different compared to control, 0 μg/ml AgNPs (P < 0.0.01).
RAW cells stimulated by LPS, exposed to 250 μg/ml AgNP in the presence of 5, 2, and 1 % FBS significantly (P < 0.0.01) inhibited cell metabolism compared to the control (Figure 1b). No effects were seen at the other FBS concentrations in the presence of the nanoparticle, and in the absence or presence of LPS.
RAW cells exposed to media only, 50 μg/ml AgNP and in the presence of 2% FBS significantly (P < 0.0.01) upregulated NO production (Figure 2a). NO was also notably upregulated by 250 μg/ml AgNP in the presence of 10, 5, 2, and 1 % FBS.
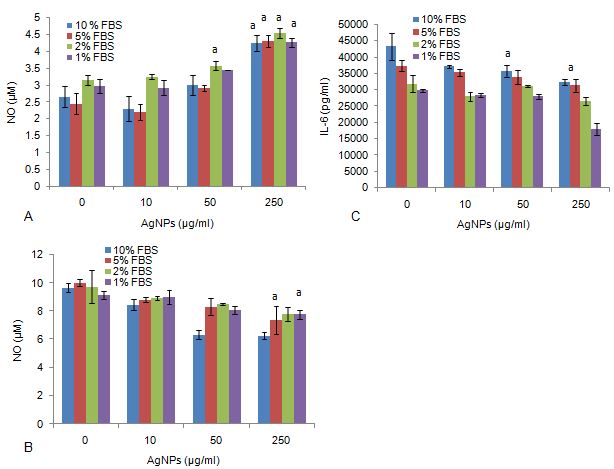 Figure 2
The production of inflammatory biomarkers from RAW 264.7 cells exposed to various FBS and AgNP concentrations, monitoring: (a) Nitric oxide (NO) production in the absence of LPS, (b) NO production in the presence in LPS and (c) Interleukin 6 (IL-6) production in the presence of LPS. Data represents mean ± SD with n = 9. Bars marked with letters indicate significant difference to control (P < 0.0.1). Significance demarcated by: a- significantly different compared to 0 μg/ml AgNPs (-LPS) (P < 0.0.01); b- significantly different compared to 0 μg/ml AgNPs (+LPS) (P <0.0.01).
RAW cells exposed to 250 μg/ml AgNP, stimulated by LPS in the presence of 5 and 1% FBS significantly (P < 0.0.01) reduced NO production from the cells (Figure 2b). No notable effects were seen at the other FBS concentrations in the presence of the nanoparticle, and in the absence or presence of LPS.
IL-6 was significantly (P < 0.0.01) reduced under a simulated inflammatory response (+LPS), exposed to 50 and 250 μg/ml AgNP in the presence of 10 % FBS (Figure 2c). IL-6 was not affected by the other AgNP concentrations in the presence of the various FBS concentrations. RAW cells exposed to media only, in the presence of varying AgNP and FBS concentrations did not affect IL-6 synthesis.
AgNP between 0-250 μg/ml had no effect on the viability of cells (Figure 3a). However, in the absence of LPS, AgNP concentrations ≥ 15.6.25 μg/ml significantly upregulated (P < 0.0.01) cell metabolic activity compared to the culture control.
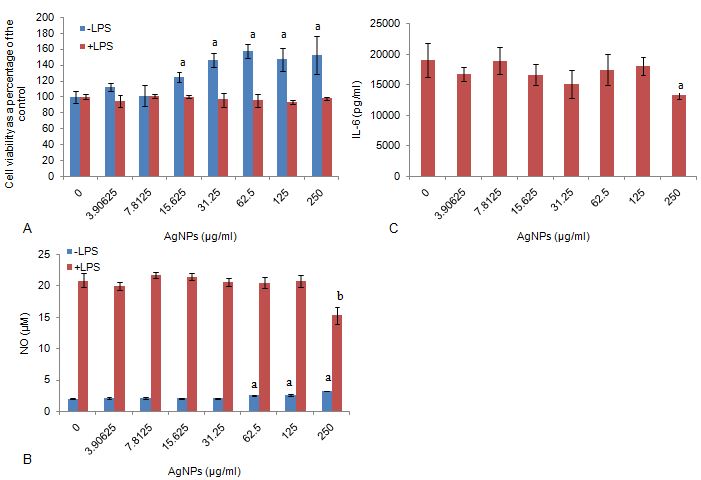 Figure 3
Monitoring (a) cellular metabolic activity of RAW 264.7 cells in the absence and presence of LPS, (b) NO production in the absence and presence of LPS and (c) IL-6 production by RAW 264.7 macrophage cells exposed to AgNPs in LPS stimulated cell cultures. Data represents mean ± SD with n = 9. Unstimulated cultures did not synthesize IL-6 (data not presented). Bars marked with letters indicate significant difference to control (P < 0.0.1). Significance demarcated by: a- significantly different compared to 0 μg/ml AgNPs (-LPS) (P <0.0.01), b- significantly different compared to 0 μg/ml AgNPs (+LPS) (P < 0.0.01).
Similar to the viability data (Figure 3a), AgNP concentrations ≥ 62.5 μg/ml significantly upregulated (P < 0.0.01) NO production in cultures not stimulated by LPS (Figure 3b). However, NO was notably inhibited (P < 0.0.01) by the highest concentration of AgNP (250 μg/ml) in LPS stimulated cultures compared to the culture control.
AgNP between 0-250 μg/ml did not affect IL-6 synthesis in unstimulated cultures (Figure 3c). The LPS stimulated cultures mirrored the NO data (Figure 3b), as the highest concentration of AgNP (250 μg/ml) significantly inhibited (P < 0.0.01) IL-6 synthesis compared to the culture control.
Culture supernatants were screened using a cytokine and chemokine array to monitor the effects AgNPs had on their secretion. Screening of the cytokines and chemokines were expected to identify potential biomarkers that can be monitored to assess the effects of AgNPs on the RAW cells.
Culture supernatants from cells not stimulated with LPS and without the presence of AgNPs (negative control) revealed that intracellular adhesion molecule-1 (CD54/sICAM-1) and macrophage inflammatory protein-1 alpha (CCL3/MIP-1α) were present (Figure 4a). Other cytokines and chemokines were present in 250 μg/ml AgNP treated culture supernatants that were not evident in culture supernatants from cells not exposed to AgNPs. These were tumour necrosis factor alpha (TNF-α); monocyte chemoattractant protein-1 (CCL2/MCP-1/JE); macrophage inflammatory protein-1 beta (CCL4/MIP-1β) and macrophage inflammatory protein-2 (CXCL2/MIP-2) (Figure 4c). Therefore, AgNPs stimulated the upregulation of these cytokines and chemokines, along with MIP-1α and CD54. These results were corroborated by the quantification of the membranes. CD54/sICAM-1; TNF-α; CCL2/MCP-1/JE; CCL3/MIP-1α; CCL4/MIP-1β and CXCL2/MIP-2 were statistically different (P < 0.0.01) and upregulated in 250 μg/ml AgNP exposed culture supernatants when compared to the supernatants of cells not exposed to AgNPs (Table 1).
| Cytokines and Chemokines | Positive Control | Negative Control | 250 μg/ml AgNPs |
|---|---|---|---|
| Reference Spot | 100 ± 11.79 | 100 ± 6.37 | 100 ± 14.90 |
| IP-10 | 106.54 ± 11.68 | 0 ± 0 | 0 ± 0b |
| G-CSF | 48.37 ± 3.60 | 0 ± 0 | 0 ± 0b |
| TNF-α | 110.24 ± 1.23 | 0 ± 0 | 11.77 ± 4.41a,b |
| IL-6 | 50.93 ± 2.71 | 0 ± 0 | 0 ± 0b |
| MCP-1/JE | 45.84 ± 4.66 | 0 ± 0 | 11.34 ± 0.87a,b |
| sICAM | 113.94 ± 6.41 | 15.86 ± 6.55 | 34.09 ± 4.31a,b |
| MIP-1α | 69.18 ± 11.03 | 83.69 ± 9.50 | 121.33 ± 21.87a,b |
| MIP-1β | 59.34 ± 0.18 | 0 ± 0 | 95.88 ± 14.94a,b |
| MIP-2 | 77.57 ± 11.12 | 0 ± 0 | 31.53 ± 4.09a,b |
| RANTES | 125.14 ± 8.71 | 0 ± 0 | 0 ± 0b |
| Membranes were subjected to 3 min 30 sec chemiluminescence exposure. Data is represented as mean ± SD. Significance indicated by a- AgNP at 250 μg/ml significantly different (P < 0.001) compared to negative control, b- AgNP at 250 μg/ml significantly different (P < 0.001) compared to the positive control. | |||
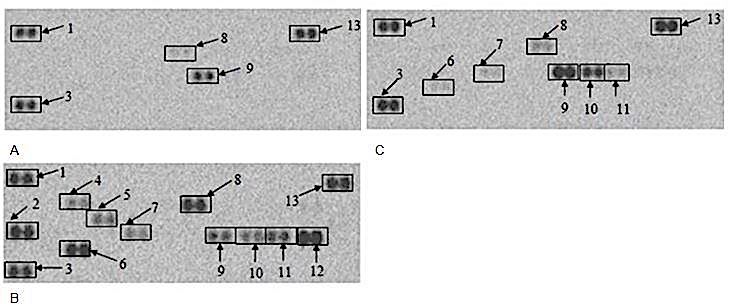 Figure 4
The effect of AgNPs on RAW 264.7 cells. Cells were incubated with (a) medium only, (b) medium containing LPS or (c) 250 μg/ml AgNPs in the absence of LPS. Supernatants were probed using the proteome profiler array as described in methods. Cytokines/ chemokines that were detected were allocated numbers: 1,3, and 13 are reference spots; 6- TNF-α ; 7- CCL2/MCP-1/JE; 8-CD54/ sICAM-1; 9- CCL3/MIP-1α; 10- CCL4/MIP-1β; and 11- CXCL2/MIP-2.
Proteome profile of culture supernatants of media only (Figure 5a), LPS treated RAW 264.7 cells cultured in medium only or in medium containing 250 μg/ml AgNPs (Figure 5b and c) identified the same cytokines and chemokines. These cytokines and chemokines identified were interferon gamma induced protein 10 (CXCL10/CRG-2/IP-10); granulocyte colony-stimulating factor (G-CSF); IL-6; TNF-α; CCL2/MCP-1/JE; CD54/ sICAM-1; CCL3/MIP-1α; CCL4/MIP-1β; CXCL2/MIP-2 and regulated on activation, normal T cell expressed and secreted (CCL5/RANTES). Quantification of the membranes showed no statistical differences between the various cytokine and chemokine levels (Table 2).
| Cytokines and Chemokines | Positive Control | Negative Control | 250 μg/ml AgNPs in the presence of LPS |
|---|---|---|---|
| Reference Spot | 100 ± 11.79 | 100 ± 6.37 | 100 ± 16.19 |
| IP-10 | 106.54 ± 11.68 | 0 ± 0 | 110.74 ± 0.19a |
| G-CSF | 48.37 ± 3.60 | 0 ± 0 | 45.20 ± 2.99a |
| TNF-α | 110.24 ± 1.23 | 0 ± 0 | 108.26 ± 3.40a |
| IL-6 | 50.93 ± 2.71 | 0 ± 0 | 51.35 ± 2.31a |
| MCP-1/JE | 45.84 ± 4.66 | 0 ± 0 | 44.79 ± 1.01a |
| sICAM | 113.94 ± 6.41 | 15.86 ± 6.55 | 114.98 ± 0.54a |
| MIP-1α | 69.18 ± 11.03 | 83.69 ± 9.50 | 73.83 ± 10.58a |
| MIP-1β | 59.34 ± 0.18 | 0 ± 0 | 66.79 ± 1.64a |
| MIP-2 | 77.57 ± 11.12 | 0 ± 0 | 87.94 ± 7.98a |
| RANTES | 125.14 ± 8.71 | 0 ± 0 | 127.67 ± 9.44a |
| Membranes were subjected to 3 min 30 sec chemiluminescence exposure. Data is represented as mean ± SD. Significance indicated by a- AgNP at 250 μg/ml significantly different (P 0.001) compared to negative control. | |||
 Figure 5
The effect of AgNPs on RAW 264.7 cells. Cells were incubated with (a) medium only, (b) medium in the presence of LPS or (c) 250 μg/ml AgNPs in the presence of LPS. Supernatants were probed using the proteome profiler array as described in methods. Cytokines/ chemokines that were detected were allocated numbers: 1,3,and 13 are reference spots; 2-CXCL10/CRG-2/IP-10; 4- G-CSF; 5- IL-6; 6- TNF-α; 7- CCL2/MCP-1/JE; 8- CD54/ sICAM-1; 9- CCL3/MIP-1α; 10- CCL4/MIP-1β; 11- CXCL2/MIP-2; and 12-CCL5/RANTES.
The proteome profile analysis of the samples not stimulated by a mitogen revealed that members of the MIP family, namely; MIP-1α, MIP-1β and MIP-2 were upregulated by 250 μg/ml AgNPs. The ELISA quantification of these respective chemokines all showed that 250 μg/ml AgNPs significantly (P < 0.0.01) upregulated their secretion compared to the culture control (Figure 6a, b, c). This trend was also seen in the NO data, where this biomarker was also upregulated in the unstimulated samples exposed to the same concentration (Figure 3b).
 Figure 6
The effect of AgNPs exposed to RAW cells not stimulated by LPS. The quantification of the effects of AgNPs on the secretion of the chemokines: a) MIP-1α, b) MIP-1β and c) MIP-2. Data is presented as mean ± SD with n = 9. Bars marked with letters indicate significant difference to control (P < 0.0.1). Significance demarcated by: a- significantly different compared to the control (P < 0.0.01)
The ELISA quantification of culture supernatants exposed to AgNPs and in the presence of LPS revealed no significant effects on the secretion for all the MIP family chemokines monitored in this study (Figure 7a, b, c). These results reflected that of the proteome profiling analysis of the culture supernatants (Table 2).
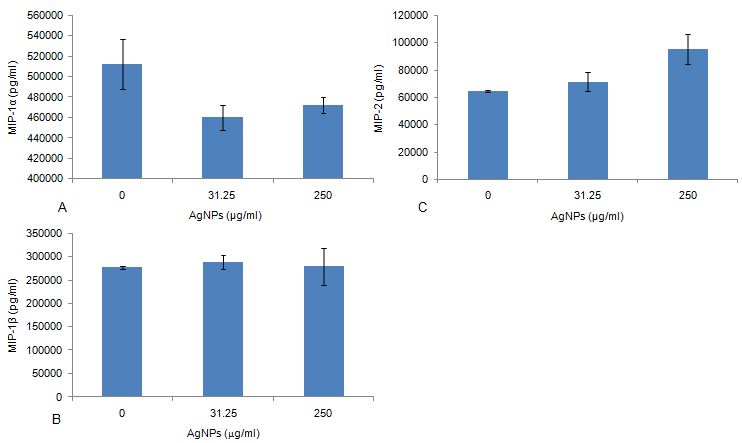 Figure 7
The effect of AgNPs exposed to RAW cells stimulated by LPS. The quantification of the effects of AgNPs on the secretion of the chemokines: a) MIP-1α, b) MIP-1β and c) MIP-2. Data is represented as mean ± SD with n = 9.
AgNP concentrations ≤ 25 μg/ml did not affect cell viability (Figure 8). However, the highest concentration of AgNP (250 μg/ml) significantly reduced (P < 0.0.01) cell viability compared to the culture control.
 Figure 8
Cell viability of WBCs exposed to AgNPs. Data represents mean ± SD with n = 4. Bars marked with letters indicate significant differences (P < 0.0.1). Significance demarcated by: a- significantly different compared to negative control, 0 μg/ml AgNPs (-LPS) (P < 0.0.01).
Unstimulated cultures exposed to AgNP concentrations ≤ 25 μg/ml did not affect IL-6 synthesis (Figure 9a). IL-6 was significantly upregulated (P < 0.0.01) by 250 μg/ml AgNP in cultures not stimulated by LPS. AgNP concentrations ≤ 25 μg/ml notably upregulated (P < 0.0.01) IL-6 synthesis in LPS stimulated cultures. However, in the presence of a mitogen, 250 μg/ml AgNP significantly inhibited (P < 0.0.01) IL-6 synthesis compared to the culture control.
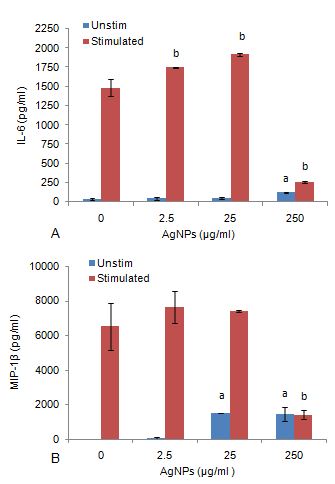 Figure 9
Synthesis of biomarkers associated with inflammation, (a) IL-6 synthesis of WBCs exposed to AgNPs in the absence and presence of LPS, (b) MIP-1β synthesis of WBCs exposed to AgNPs in the absence and presence of LPS . Data represents mean ± SD with n = 4. Bars marked with letters indicate significant difference to 0 μg/ml AgNPs (P < 0.0.1). Significance demarcated by: a- significantly different compared to negative control, 0 μg/ml AgNPs (-LPS) (P < 0.0.01); b- significantly different compared to positive control, 0 μg/ml AgNPs (+LPS) (P < 0.0.01).
AgNP concentrations ≤ 25 μg/ml significantly upregulated (P < 0.0.01) MIP-1β synthesis in cultures not stimulated by LPS (Figure 9b). However, in LPS stimulated cultures, the highest concentration of AgNP (250 μg/ml) significantly reduced (P < 0.0.01) MIP-1β synthesis compared to the culture control.
AgNP concentrations ≤ 25 μg/ml had no effect on IL-10 production in cultures both in the presence or absence of PHA (Figure 10a). At the highest AgNP concentration (250 μg/ml), IL-10 was significantly upregulated (P < 0.0.01) in cultures not stimulated by PHA. However, in cultures stimulated by PHA and exposed to 250 μg/ml AgNPs, IL-10 was notably inhibited (P < 0.0.01) compared to the culture control. This inhibition of IL-10 allowed for an IC50 of 29.67 μg/ml to be calculated (Figure 10b).
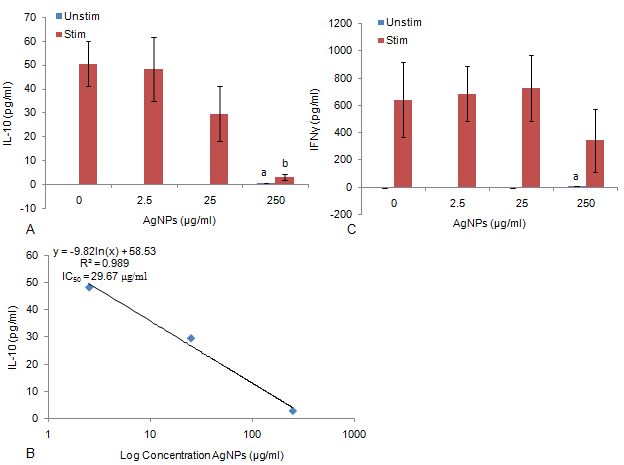 Figure 10
Synthesis of acquired immune system biomarkers (a) IL-10 synthesis of WBCs exposed to AgNPs in the absence or presence of PHA, (b) IC50 determination of AgNPs on IL-10 production by PHA stimulated WBCs, (c) IFNγ synthesis of WBCs exposed to AgNPs in the absence or presence of PHA . Data represents mean ± SD with n = 4. Bars marked with letters indicate significant difference to 0 μg/ml AgNPs (P < 0.0.1). Significance demarcated by: significantly different compared to negative control, 0 μg/ml AgNPs (-PHA) (P < 0.0.01); b- significantly different compared to positive control, 0 μg/ml AgNPs (+PHA) (P < 0.0.01).
AgNP concentrations had no effect on IFNγ production in cultures stimulated by PHA (Figure 10c). However, at 250 μg/ml AgNP, IFNγ was significantly upregulated (P < 0.0.01) in cultures not stimulated by PHA compared to the culture control.
A proteome profile of WBCs exposed to 25 μg/ml AgNPs under unstimulated conditions and media only revealed the respective cytokines and chemokines expressed by WBCs under these conditions (Figure 11). Quantification of the membranes revealed that the AgNPs significantly suppressed (P < 0.0.01) the synthesis of MIF and RANTES (Table 3). Whereas, the other cytokines and chemokines expressed upon exposure to media only and AgNPs are virtually indistinguishable from each other (Figure 11a and 11b).
| Cytokines and Chemokines | Positive Control | Negative Control | 25 μg/ml AgNPs |
|---|---|---|---|
| Reference Spot | 100 ± 7.28 | 100 ± 14.51 | 100 ± 5.57 |
| IL-1ra | 16.92 ± 1.46 | 0 ± 0 | 0 ± 0b |
| MIF | 17.56 ± 1.51 | 19.57 ± 1.65 | 10.57 ± 1.91a,b |
| MCP-1 | 26.26 ± 2.54 | 0 ± 0 | 0 ± 0b |
| Serpin E1 | 32.40 ± 2.49 | 27.39 ± 0.66 | 24.26 ± 2.26b |
| MIP-1α/β | 70.22 ± 4.11 | 0 ± 0 | 0 ± 0b |
| RANTES | 62.94 ± 2.55 | 41.71 ± 0.45 | 34.27 ± 1.37a,b |
| sICAM | 37.15 ± 0.59 | 32.33 ± 1.00 | 35.98 ± 2.19 |
| IL-6 | 29.31 ± 4.81 | 0 ± 0 | 0 ± 0b |
| IL-8 | 50.27 ± 8.41 | 0 ± 0 | 0 ± 0b |
| IL-1β | 20.29 ± 0.99 | 0 ± 0 | 0 ± 0b |
| Membranes were subjected to chromogenic exposure. Data is represented as mean ± SD. Significance indicated by a- AgNP at 25 μg/ml significantly different (P<0.001) compared to negative control, b- AgNP at 25 μg/ml significantly different (P< 0.001) compared to the positive control. | |||
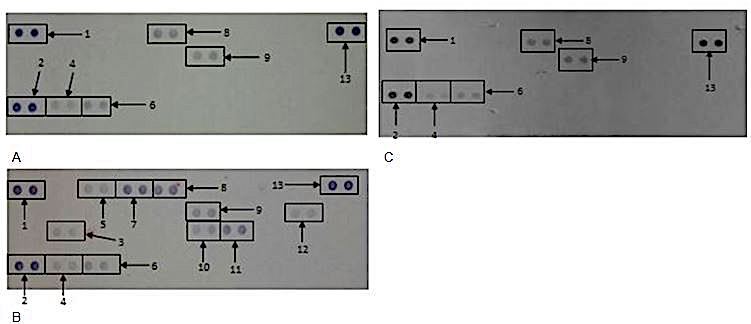 Figure 11
The effect of AgNPs on WBCs. Cells were incubated with (a) medium only, (b) medium containing LPS or (c) 25 μg/ml AgNPs in the absence of LPS. Supernatants were probed using the proteome profiler array as described in methods. Cytokines/ chemokines that were detected were allocated numbers: 1,2, and 13 are reference spots; 4- MIF; 6- Serpin E1; 8- RANTES; 9-ICAM-1.
The proteome profile analysis of WBCs treated with a mitogen or in the presence of 25 μg/ml AgNPs showed that MCP-1 was inhibited by the AgNPs (Figure 12). Upon the quantification of the membranes, a significant reduction (P < 0.0.01) of the following cytokines and chemokines was exhibited due to AgNP exposure. Those cytokines and chemokines are: IL-1ra; MIF; Serpin E1; RANTES; ICAM-1 and IL-1β (Table 4).
| Cytokines and Chemokines | Positive Control | Negative Control | 25 μg/ml AgNPs in the presence of LPS |
|---|---|---|---|
| Reference Spot | 100 ± 7.28 | 100 ± 14.51 | 100 ± 5.98 |
| IL-1ra | 16.92 ± 1.46 | 0 ± 0 | 8.36 ± 0.17a,b |
| MIF | 17.56 ± 1.51 | 19.57 ± 1.65 | 6.99 ± 0.50a,b |
| MCP-1 | 26.26 ± 2.54 | 0 ± 0 | 0 ± 0b |
| Serpin E1 | 32.40 ± 2.49 | 27.39 ± 0.66 | 19.97 ± 1.10a,b |
| MIP-1α/β | 70.22 ± 4.11 | 0 ± 0 | 62.27 ± 2.16a,b |
| RANTES | 62.94 ± 2.55 | 41.71 ± 0.45 | 34.99 ± 0.42a,b |
| sICAM | 37.15 ± 0.59 | 32.33 ± 1.00 | 26.97 ± 0.01a,b |
| IL-6 | 29.31 ± 4.81 | 0 ± 0 | 23.18 ± 0.29a |
| IL-8 | 50.27 ± 8.41 | 0 ± 0 | 49.47 ± 0.26a |
| IL-1β | 20.29 ± 0.99 | 0 ± 0 | 6.97 ± 0.32a,b |
| Membranes were subjected to chromogenic exposure. Data is represented as mean ± SD. Significance indicated by a- AgNP at 25 μg/ml significantly different (P < 0.001) compared to negative control, b- AgNP at 25 μg/ml significantly different (P < 0.001) compared to the positive control. | |||
 Figure 12
The effect of AgNPs on WBCs. Cells were incubated with (a) medium only, (b) medium containing LPS or (c) 25 μg/ml AgNPs in the presence of LPS. Supernatants were probed using the proteome profiler array as described in methods. Cytokines/ chemokines that were detected were allocated numbers: 1,2, and 13 are reference spots; 3- IL-1ra ; 4- MIF; 5-MCP-1; 6- Serpin E1; 7- MIP-1α/β; 8- RANTES; 9-ICAM-1, 10- IL-6, 11- IL-8 and 12- IL-1β.
Nanoparticles possess unique characteristics due to their higher surface to volume ratio compared to bulk chemicals. This results in superior reactivity compared to their bulk products (14). The unique characteristics of the nanoparticles aid in their translocation into cells where they are speculated to result in cytotoxicity and other cellular responses (4, 15-18). Macrophages are believed to be one of the main cell types that encounter and process nanoparticles, resulting in the modulation of biological responses such as immune reactions (12). Given the extent of AgNP use, it is important to monitor the effects of AgNPs on macrophages and the immune system in its entirety.
Due to the uncertainty of final FBS concentrations of cells exposed to AgNPs (3, 8, 19, 20), as a preliminary evaluation in this study, RAW cells were exposed to various AgNP concentrations, 10, 5, 2, and 1 % FBS and either in the absence or presence of LPS. The highest FBS concentration, 10%, aided in protecting the cell from the cytotoxic and anti-inflammatory (NO) effects of the AgNPs.
AgNP concentrations ≥ 15.625 μg/ml stimulated RAW cell growth in unstimulated cultures. Kaur and Tikoo found that RAW cells exposed to AgNPs synthesized by the reduction with sodium borohydride (BSNPs) had no effect on viability across a 0 – 100 μg/ml concentration range (8). However, Park et al, found that RAW cells exposed to AgNPs resulted in a 20 % reduction in cell viability when exposed to 1.6 μg/ml for 24 hrs (19). In another study, 10 μg/ml of AgNPs caused a 30 % reduction in cell viability of RAW cells after a 24 hr exposure period (22). These results further add to conflicting reports on how AgNPs affect macrophages. Both Park et al, and Giovanni et al, reported a particle size > 100 nm and this could account for the reduction in cell viability (19, 20). The ? 100 nm size of the nanoparticles would impact on other factors such as the zeta potential and agglomerative effect of the AgNPs, thus altering the properties of nanoparticles. Change in particle size would impact on how the nanoparticles are translocated into the cell.
Conversely, WBC viability was reduced by 250 μg/ml AgNPs. Greulich et al, found that no cytotoxicity was evident when PMBCs were exposed to a concentration range of 5-30 μg/ml for 24 hrs (7). The nanoparticles, however, had a notable stimulatory effect on unstimulated monocytes at 25 and 30 μg/ml respectively; and had no effect on T-cells. The results of this study, reflect the findings of Greulich et al, as AgNP concentrations ≤ 25 μg/ml had no cytotoxic effects (7). However, a larger concentration range was investigated in this study, which revealed AgNPs to be cytotoxic at 250 μg/ml.
This study shows that AgNPs inhibits NO and IL-6 at 250 μg/ml in stimulated RAW cell cultures. NO was stimulated at AgNP concentrations ≥ 62.5 μg/ml in unstimulated RAW cultures. Park et al, noted that NO increased by two fold in unstimulated RAW cell cultures at 1.6 μg/ml AgNPs compared to the control (19). Current results are similar to what was seen in this study, however, the effects were at higher concentrations. Martínez-Gutierrez et al, reported that AgNPs stimulated IL-6 secretion in human THP-1 monocytes at 5 and 10 μg/ml. In another study, where alveolar macrophages were exposed to AgNPs, no detectable levels of IL-6 were found in culture supernatants after a 24 hr exposure (6). This data corroborates conflicting reports of the effects AgNPs has on biomarkers associated with inflammation, as unstimulated cultures did not synthesize IL-6 in this study.
AgNP concentrations ? 25 μg/ml stimulated IL-6 and MIP-1β synthesis in unstimulated WBC cultures. These inflammatory biomarkers were inhibited by 250 μg/ml AgNPs in LPS stimulated cultures. The only other study conducted on PBMCs found that AgNPs had an immunostimulatory effect. Greulich et al, found that inflammatory biomarkers were upregulated by the AgNP concentration range 5 – 20 μg/ml, which is similar to what was found here (7).
The acquired immune cytokines, IL-10 and IFNγ was upregulated in unstimulated WBC cultures by 250 μg/ml AgNP. IL-10 was inhibited in PHA stimulated cultures at the same AgNP concentration. Martinez-Gutierrez et al, found that a AgNP concentration range of 5 – 10 μg/ml induced IL-10 production in phorbol 12-myristate 13-acetate (PMA) stimulated THP-1 cells (21). On the contrary, no effects were seen on IL-10 production at the above mentioned concentration range in this study. Conversely, Shin et al, found that PBMCs inhibited IFNγ production in PHA stimulated cultures at AgNP concentrations ≥ 3 μg/ml, compared to no effect in this study (2).
The stimulation of IL-6, MIP-1β, IL-10 and IFNγ under basal conditions and the suppression of these cytokines under a simulated immune response could potentially be detrimental to the immune system, as it could result in immunostimulation or immunosuppression respectively.
The proteome profile of RAW 264.7 cells without and after AgNP treatment gives indications of cytokines and chemokines modulated by the particles. Culture supernatants in the presence of the mitogen, LPS, with and without AgNP exposure revealed no differences in the levels of cytokines and chemokines monitored. Clear differences were seen in the culture supernatants of cells not stimulated with LPS, for unexposed and exposed 250 μg/ml AgNPs supernatants. The 250 μg/ml AgNPs supernatants of cells not treated with LPS showed that the following cytokines and chemokines were upregulated by AgNPs: TNF-α; CCL2/MCP-1/JE; CCL4/MIP-1β and CXCL2/MIP-2. The above mentioned cytokines and chemokines have various, different but interconnective functions (Table 5). TNF-α, plays a vital role in controlling the production of other cytokines which are mainly produced by macrophages (24). Whereas, the MIPs (CCL4/MIP-1β and CXCL2/MIP-2) have chemotactic properties which are specific to neutrophils and aids in their recruitment in response to infection, injury and cancer (25). Similar results were seen using a Multiplex system, where TNF-α; CCL4/MIP-1β and CXCL2/MIP-2 were upregulated regardless of the size of the AgNPs as this trend was seen at 20, 80 and 113 nm. However, only nine cytokines and chemokines were monitored at one time (21). This proteome profiler system allows 40 cytokines and chemokines to be monitored at the same time compared to only nine using Multiplex assays. CCL2/MCP-1/JE is one of the major chemokines known for tissue healing and regulates the migration and infiltration of monocytes/macrophages to the site of infection. This involves the migration of monocytes from the blood stream across the vascular endothelium. (26). MCP-1 exhibits all four elements of inflammatory mediated wound healing by activating macrophage migration and infiltration, fibroblast proliferation, connective tissue proliferation and capillary arteriogenesis (27). Therefore, TNF-α, MIP-1β, MIP-2 and MCP-1 all assist in the defense of the immune system and macrophages when it encounters AgNPs. The Figure reproduced with permission from Wolters Kluwer Health, Inc. Hoh et al, proposed a pathway whereby the above mentioned cytokines work together to promote wound healing when analyzing the repair of murine carotid aneurysms under both in vivo and in vitro conditions (Figure 13) (25). This proposed pathway could apply to the exposure of the murine cell line RAW 264.7 to AgNPs and indicates the way the immune system would react in order to promote cell and tissue healing as the cell would sense damaging effects upon AgNP exposure and during an aneurysm. These specific cytokines and chemokines will be released in order to combat cellular damage and promote cellular healing. (Table 5 and Figure 13)
| Mediators | Target Cell | Cellular Effect |
|---|---|---|
| CXCL10/IP-10; TNF-α | Neutrophils | Proliferation |
| CCL3/MIP-1α; CCL4/MIP-1β; CXCL10/IP-10 | Th1 CD4+ cells | Migration, proliferation, activation, differentiation |
| CCL2/MCP-1 | Th17 CD4+ cells | Proliferation, migration |
| CCL4/MIP-1β; CXCL10/IP-10 | CD8+ cells | Migration, proliferation, activation, differentiation |
| CCL2/MCP-1; G-CSF | B cells | Maturation, proliferation, IgG and IgM production |
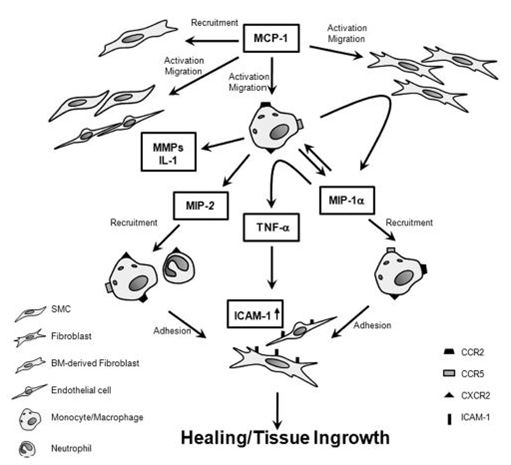 Figure 13
The Figure reproduced with permission from Wolters Kluwer Health Inc, Hoh et al, proposed pathway whereby various cytokines play different but interconnective roles in order to promote wound healing in murine carotid aneurysms under both in vivo and in vitro conditions (25).
The proteome profile of WBCs exposed to media only and 25 μg/ml AgNP under basal conditions indicated no major differences between cytokines and chemokines synthesized. However, 25 μg/ml AgNP exposure of LPS treated cell inhibited MCP-1, IL-1ra and IL-1β under a simulated inflammatory response compared LPS treated cells in the absence of AgNP. This indicates that biomarkers associated with inflammation and the recruitment of cells to promote tissue healing would be inhibited if an individual already experiencing an inflammatory response would be exposed to a AgNP concentration of 25 μg/ml. This is conflicting, as IL-6 was significantly upregulated under stimulated conditions. These results are also contradictory to the RAW cell data although it could be attributed to the higher concentration investigated.
To date only a few studies have looked at the proteome profile of RAW cells, but none on WBCs when exposed to certain ‘substances’. These include the Chinese herbal formula, “Zuojin Pill” extract, Bi-Qi capsule, resveratrol, polished and sandblasted (surface roughness) of titanium disks to name a few (28-31). No investigative work has looked at the effects silver or any other nanoparticle on the proteome profile of RAW macrophages and WBCs. Therefore, this assay allows investigators to focus on potential targets of the nanoparticles using a quick method that can monitor multiple end-points.
Silver nanoparticles upregulated RAW cell metabolism and NO production under basal conditions. However, RAW cell NO and IL-6 responses were inhibited by 250 μg/ml. Notable changes in RAW cytokines and chemokines were seen upon proteome profiling analysis. The cytokines and chemokines upregulated by AgNPs in unstimulated cultures could potentially be used to assess the effects of AgNPs on macrophages. These cytokines and chemokines identified are: TNF-α; CCL2/MCP-1/JE; CCL4/MIP-1β; CXCL2/MIP-2; CD54/sICAM-1 and CCL3/MIP-1α. Thus, in depth studies on AgNP toxicity should be conducted using these potential biomarkers.
The highest AgNP concentration (250 μg/ml) exhibited cytotoxic effects on WBCs. Biomarkers associated with inflammation was upregulated by AgNPs under basal conditions but inhibited in a simulated inflammatory response. A similar trend was seen with adaptive immune responses, humoral and cell mediated immunity. A proteome profile revealed that AgNPs would inhibit biomarkers associated with inflammation in an individual already experiencing an inflammatory response.
The authors would like to thank the National Research Foundation (NRF) for funding this study.