
Academic Editor: Miro Šimun Alebić
Background: SIRT3 regulates the generation of reactive oxygen species (ROS) in human granulosa cells (GCs). Increased levels of oxidative stress may cause follicular dysplasia in GCs of polycystic ovary syndrome (PCOS) patients. However, expression and regulation of SIRT3 in GCs of PCOS patients have not yet been investigated. The present study is conducted to determine the correlation between SIRT3 and hyperandrogenism in luteinized GCs of PCOS patients. Methods: The mRNA and protein expression of SIRT3 were analysed in the luteinized GCs from the controls and non-obese PCOS patients. Dihydrotestosterone (DHT) was added to the primary cultured GCs to test the effects of androgen excess on intracellular ROS and SIRT3 expression. A DHT-induced PCOS murine model was used to confirm the effects in vivo. Results: In the matched case-control study including 32 pairs of the controls and non-obese PCOS patients, we showed that the expression of SIRT3 was increased in luteinized GCs of non-obese PCOS patients compared with normovulatory controls. Moreover, DHT induced oxidative stress and SIRT3 expression in human GCs, which was further confirmed in a murine PCOS model. Conclusions: These results indicated that the increased expression of SIRT3 was induced by hyperandrogenism in GCs of non-obese PCOS patients.
Polycystic ovary syndrome is one of the most prevalent endocrine disorders in women of reproductive age. Women with PCOS are characterized by hyperandrognism, abnormal folliculogenesis and ovulatory dysfunction. Granulosa cells (GCs) play an important role in folliculogenesis. Altered gene expression was reported in GCs of PCOS patients [1]. Although the pathogenesis of PCOS remains unclear, dysregulation of GCs may affect follicular environment and follicular growth.
Hyperandrogenism is one of the main features of PCOS. Hyperandrogenism induces oxidative stress which has detrimental effects on GCs and oocytes [2, 3]. Theca cells have an intrinsic defect accounting for excess androgen production in PCOS patients [4]. Excess androgen induces FSH receptor expression in GCs, which in turn induce LH receptor expression in theca cells [5]. Therefore, GC dysfunction also contributes to hyperandrogenism in PCOS patients.
Oxidative stress is caused by excess production of reactive oxygen species (ROS) relative to antioxidants. A 20-fold increase of ROS levels was detected and reported to induce cell apoptosis in GCs of PCOS patients [6, 7]. Oxidative stress initiates GC apoptosis during follicular atresia [2]. Thus, increased apoptosis of GCs may contribute to follicular atresia in PCOS. These findings suggest that oxidative stress-induced apoptosis may play an important role in follicular dysplasia in PCOS patients.
Sirtuins belong to a family of conserved nicotinamide adenine dinucleotide (NAD)-dependent protein deacytylases. Among the sirtuins, SIRT3 mainly located in mitochondria plays a critical role in maintenance of the homeostasis of ROS in oocytes and embryos [8, 9]. SIRT3 deacytylate and activate mitochondrial metabolic enzymes such as isocitrate dehydrogenase 2 and glutamate dehydrogenase [10]. It is reported that SIRT3 is involved in the folliculogenesis and luteinization processes in GCs [11]. However, expression and regulation of SIRT3 in GCs of PCOS patients is still unknown.
We hypothesized that high levels of androgen induced SIRT3 expression in GCs of PCOS patients. To exclude the effect of obesity, we recruited non-obese women with PCOS and the matched controls. We analyzed the expression of SIRT3 in luteinized GCs of PCOS patients and the controls. The dihydrotestosterone (DHT) was used to mimic the hyperandrogenic state of PCOS patients. We showed that DHT induced oxidative stress and SIRT3 expression in GCs of PCOS patients and the controls. Additionally, SIRT3 expression was increased in GCs of DHT-treated mice. These results indicated that the elevated expression of SIRT3 was induced by androgen excess in GCs of non-obese PCOS patients.
Women with male infertility or tubal factor infertility, regular menstrual cycles, serum testosterone (T) level below 2 nmol/L, and body mass index (BMI) below 27 served as controls. PCOS was diagnosed refer to the Rotterdam revised criteria [12]. PCOS patients with high LH received oral contraceptive pretreatment (OCP) to reduce the basal LH before controlled ovarian stimulation (COS). The non-obese PCOS patients enrolled had oligo- or anovulation, serum T level above 2 nmol/L, polycystic ovary morphology and BMI below 27. The exclusion criteria were abnormal serum level of prolactin, endometriosis, dysfunctional thyroid or systemic diseases. Plasma levels of luteinizing hormone (LH), anti-Müllerian hormone (AMH), T, estradiol (E2) and follicle-stimulating hormone (FSH) were collected and measured between day 3 and day 5 of the menstrual cycle before controlled ovarian stimulation.
Serum levels of AMH, LH, FSH, T, E2 and prolactin (PRL) were determined by chemiluminescence immunoassay (CLIA). The inter-assay coefficients were 5.9% for AMH, 6.8% for LH, 5.6% for FSH, 12.1% for T and 9.2% for E2. The intra-assay coefficients were 3.6% for AMH, 5.1% for LH, 4.4% for FSH, 7.9% for T, 7.0% for E2 and 11.2% for PRL.
All patients underwent ovarian stimulation using the long
gonadotrophin-releasing hormone (GnRH) agonist (Ferring, Kiel, Germany) protocol according to our previous
work [13]. Briefly, patients were given daily subcutaneous injections of 0.1 mg
GnRH agonist from day 20 of a menstrual cycle until the day of
human chorionic gonadotrophin (hCG) trigger. Ovarian stimulation was initiated
with 150 international unit (IU) recombinant human FSH (rhFSH, Merck Serono, Geneva, Switzerland) per day. Recombinant hCG
(Ovidrel, Merck Serono) was injected, when at least three follicles reached
Follicular fluids from follicles reached
For the GC pellet harvested from follicular fluids and ovaries from the murine model, total RNA was extracted by the Total RNA Kit II Kit (Omega Bio-Tek). For the primary cultured GCs, total RNA was extracted by MicroElute Total RNA Kit (Omega Bio-Tek, Norcross, GA, USA). The methods were performed from a protocol in our previous study [13]. The efficiencies of the PCR reaction were above 95%. The primers were hSIRT3-F and hSIRT3-R for human SIRT3, hGAPDH-F and hGAPDH-R for human GAPDH, mAMH-F and mAMH-R for mouse AMH, mFOXO1-F and mFOXO1-R for mouse FOXO1, mFOXO3A-F and mFOXO3A-R for mouse FOXO3A, mSIRT3-F and mSIRT3-R for mouse SIRT3, mGAPDH-F and mGAPDH-R for mouse GAPDH. The sequences of the primers are listed in Table 1.
| Primer name | Sequence (5 |
| hSIRT3-F | CGGCTCTACACGCAGAACATC |
| hSIRT3-R | CAGCGGCTCCCCAAAGAACAC |
| hGAPDH-F | GAAGGTGAAGGTCGGAGTC |
| hGAPDH-R | GAAGATGGTGATGGGATTTC |
| mAMH-F1 | GGGGCACACAGAACCTCT |
| mAMH-R1 | GCACCTTCTCTGCTTGGTTG |
| mFOXO1-F1 | CGTGCTTACAGCCTTCTA |
| mFOXO1-R1 | ACCTCCATCGTGACAAAA |
| mFOXO3A-F1 | GATAAGGGCGACAGCAACA |
| mFOXO3A-R1 | CCGTGCCTTCATTCTGAAC |
| mSIRT3-F | TATGGGCTGATGTGATGGCG |
| mSIRT3-R | AGTCGGGGCACTGATTTCTG |
| mGAPDH-F1 | TGGCAAAGTGGAGATTGTTGCC |
| mGAPDH-R1 | AAGATGGTGATGGGCTTCCCG |
The method was performed as described previously [13]. The murine monoclonal
antibody against SIRT3 (Santa Cruz Biotechnology, sc-365175, Santa Cruz Biotechnology, Dallas, TX, USA) and beta-actin
(Proteintech, 60008-1-Ig, Proteintech, Wuhan, Hubei, China) were used. The signal intensities of the bands were
measured by ImageJ software (Bethesda, Maryland, NIH). The protein expression of
SIRT3 was normalized to
The intracellular ROS of GCs were examined by the general oxidative stress
indicator (CM-H2DCFDA, Invitrogen). The CM-H2DCFDA was prepared in DMSO
immediately before use. The cultured GCs were incubated with 10
All procedures were reviewed and approved by the Animal Ethical Committee of the Laboratory Animals Center of Chongqing Medical University. Female C57BL/6J mice were purchased from Shanghai slake experimental animal Co., Ltd (Shanghai, China). Mice were bred and housed in a temperature-control room (20–22 °C, on a 12/12 h light/dark cycle. The protocol of generating a PCOS mouse model was modified from the previous study [14]. After acclimating to the laboratory conditions with a standard diet and water for 3 days, mice (19 days of age) arranging from 8.6 to 10.5 g weight were randomly divided into two groups (n = 8 per group). The dihydrotestosterone (DHT) group was implanted with a DHT release pellet (Innovative Research of America, Sarasota, FL, USA). The pellets contained 2.5 mg of DHT with a 90-day continuous release. The control group was treated with a placebo pellet. After 90 days of treatment, mice were killed by cervical dislocation, and the ovaries were collected.
Vaginal smear analysis was performed to assess the estrous cycle for 10 consecutive days before the mice were killed. Briefly, vaginal cells were collected by saline lavage and placed on a glass slide. After air-drying, the slides were stained with 0.1% methylene blue solution (Sigma-aldrich, St. Louis, MO, USA). The stages of the estrous cycle were identified by the relative ratio of cell types observed in the slides as described previously [15].
Total serum T was assayed using RIA kit with 125I-labelled ligands (Beijing North institute of Biological Technology) according to the manufacturer’s instruction. The radioactivity was measured by a Wallac Wizard 1470 automatic gamma counter (PerkinElmer). The detection efficiency was 75%. The extraction efficiency was 92%. The detection limit was 0.02 ng/mL.
Data are presented as the means
The clinical parameters of patients were summarized in Table 2. Compared with
the normovulatory controls, basal levels of AMH and T as well as antral follicle
count (AFC) were significantly increased in non-obese PCOS patients (p
| Variable | Controls | PCOS patients |
| N | 32 | 32 |
| Age (yr) | 30.33 |
29.17 |
| BMI (kg/m |
22.73 |
25.43 |
| AMH (ng/mL) | 4.52 |
10.35 |
| AFC | 19.60 |
33.80 |
| LH (IU/L) | 4.57 |
4.48 |
| FSH (IU/L) | 7.03 |
6.40 |
| T (nmol/L) | 1.45 |
2.72 |
| E2 (pmol/L) | 159.33 |
169.83 |
| PRL (mIU/L) | 298.12 |
352.97 |
| Insulin 0 (mU/L) | 7.35 |
9.56 |
| Insulin 120 (mU/L) | 33.32 |
63.47 |
| Glucose 0 (mmol/L) | 4.94 |
5.38 |
| Glucose 120 (mmol/L) | 5.88 |
6.73 |
| HOMA-IR | 1.69 |
2.49 |
| BMI, Body mass index; AFC, Antral follicle count; PRL, Prolactin.
| ||
 Fig. 1.
Expression of SIRT3 in human GCs between normovulatory
women and non-obese PCOS patients. (A) Differential expression of SIRT3
mRNA in GCs between the two groups. Data were expressed as fold changes relative
to the control. Bars represent means
To assess the effects of hyperandrogenism, GCs from the controls and PCOS patients were treated with vehicle or DHT, a nonaromatizable androgen, and the intracellular ROS levels were measured by CM-H2DCFDA (Fig. 2A–D). Then, the fluorescence intensity was quantified. GCs of the controls showed scant ROS generation, while ROS was significantly increased in GCs from PCOS patients (Fig. 2E). And DHT treatment significantly stimulates ROS generation in GCs from both the controls and PCOS patients. Next, we performed quantitative RT-PCR analysis to assess the effects of DHT on the expression of SIRT3 (Fig. 2F). The result revealed that DHT up-regulated the expression of SIRT3.
 Fig. 2.
Effects of DHT on intracellular ROS and SIRT3
expression in the luteinized GCs of the controls and PCOS patients. The primary
cultured GCs were treated with vehicle or DHT (10 nM) for 24 h before further
analysis. Intracellular ROS levels were measured by CM-H2DCFDA. Representative
images are shown as following: (A) GCs of the controls treated with vehicle. (B)
GCs of PCOS patients treated with vehicle. (C) GCs of the controls treated with
DHT. (D) GCs of PCOS patients treated with DHT. The fluorescence intensities were
assessed by the ImageJ software (E). Bars represent means
For in vivo experiments, a DHT-induced PCOS murine model was established. Menstrual irregularities are a key feature of PCOS patients. We performed vaginal smears experiments to determine the estrous cycles of the mice. The control mice showed regular estrous cycles, while the DHT-treated mice exhibited disrupted estrous cycles (Fig. 3A,B). No cystic follicles were detected in the control mice. In contrast, such follicles were observed in DHT-treated mice (Fig. 3C,D). The number of antral follicles was obviously increased in DHT-treated mice compared with the controls (Fig. 3D). To confirm that the DHT treatment caused hyperandrognism, the serum T level was measured. As expected, the serum T level was dramatically raised in DHT-treated mice (Fig. 3E). The expression of specific genes such as AMH, FOXO1 and FOXO3A were associated with PCOS in ovaries [16, 17]. Our results showed that the expression of these genes was significantly enhanced in the ovaries of the DHT-treated mice compared with the controls (Fig. 3F). Consistent with the results in primary culture cells, the expression of SIRT3 was also significantly elevated in DHT-treated mice (Fig. 3F).
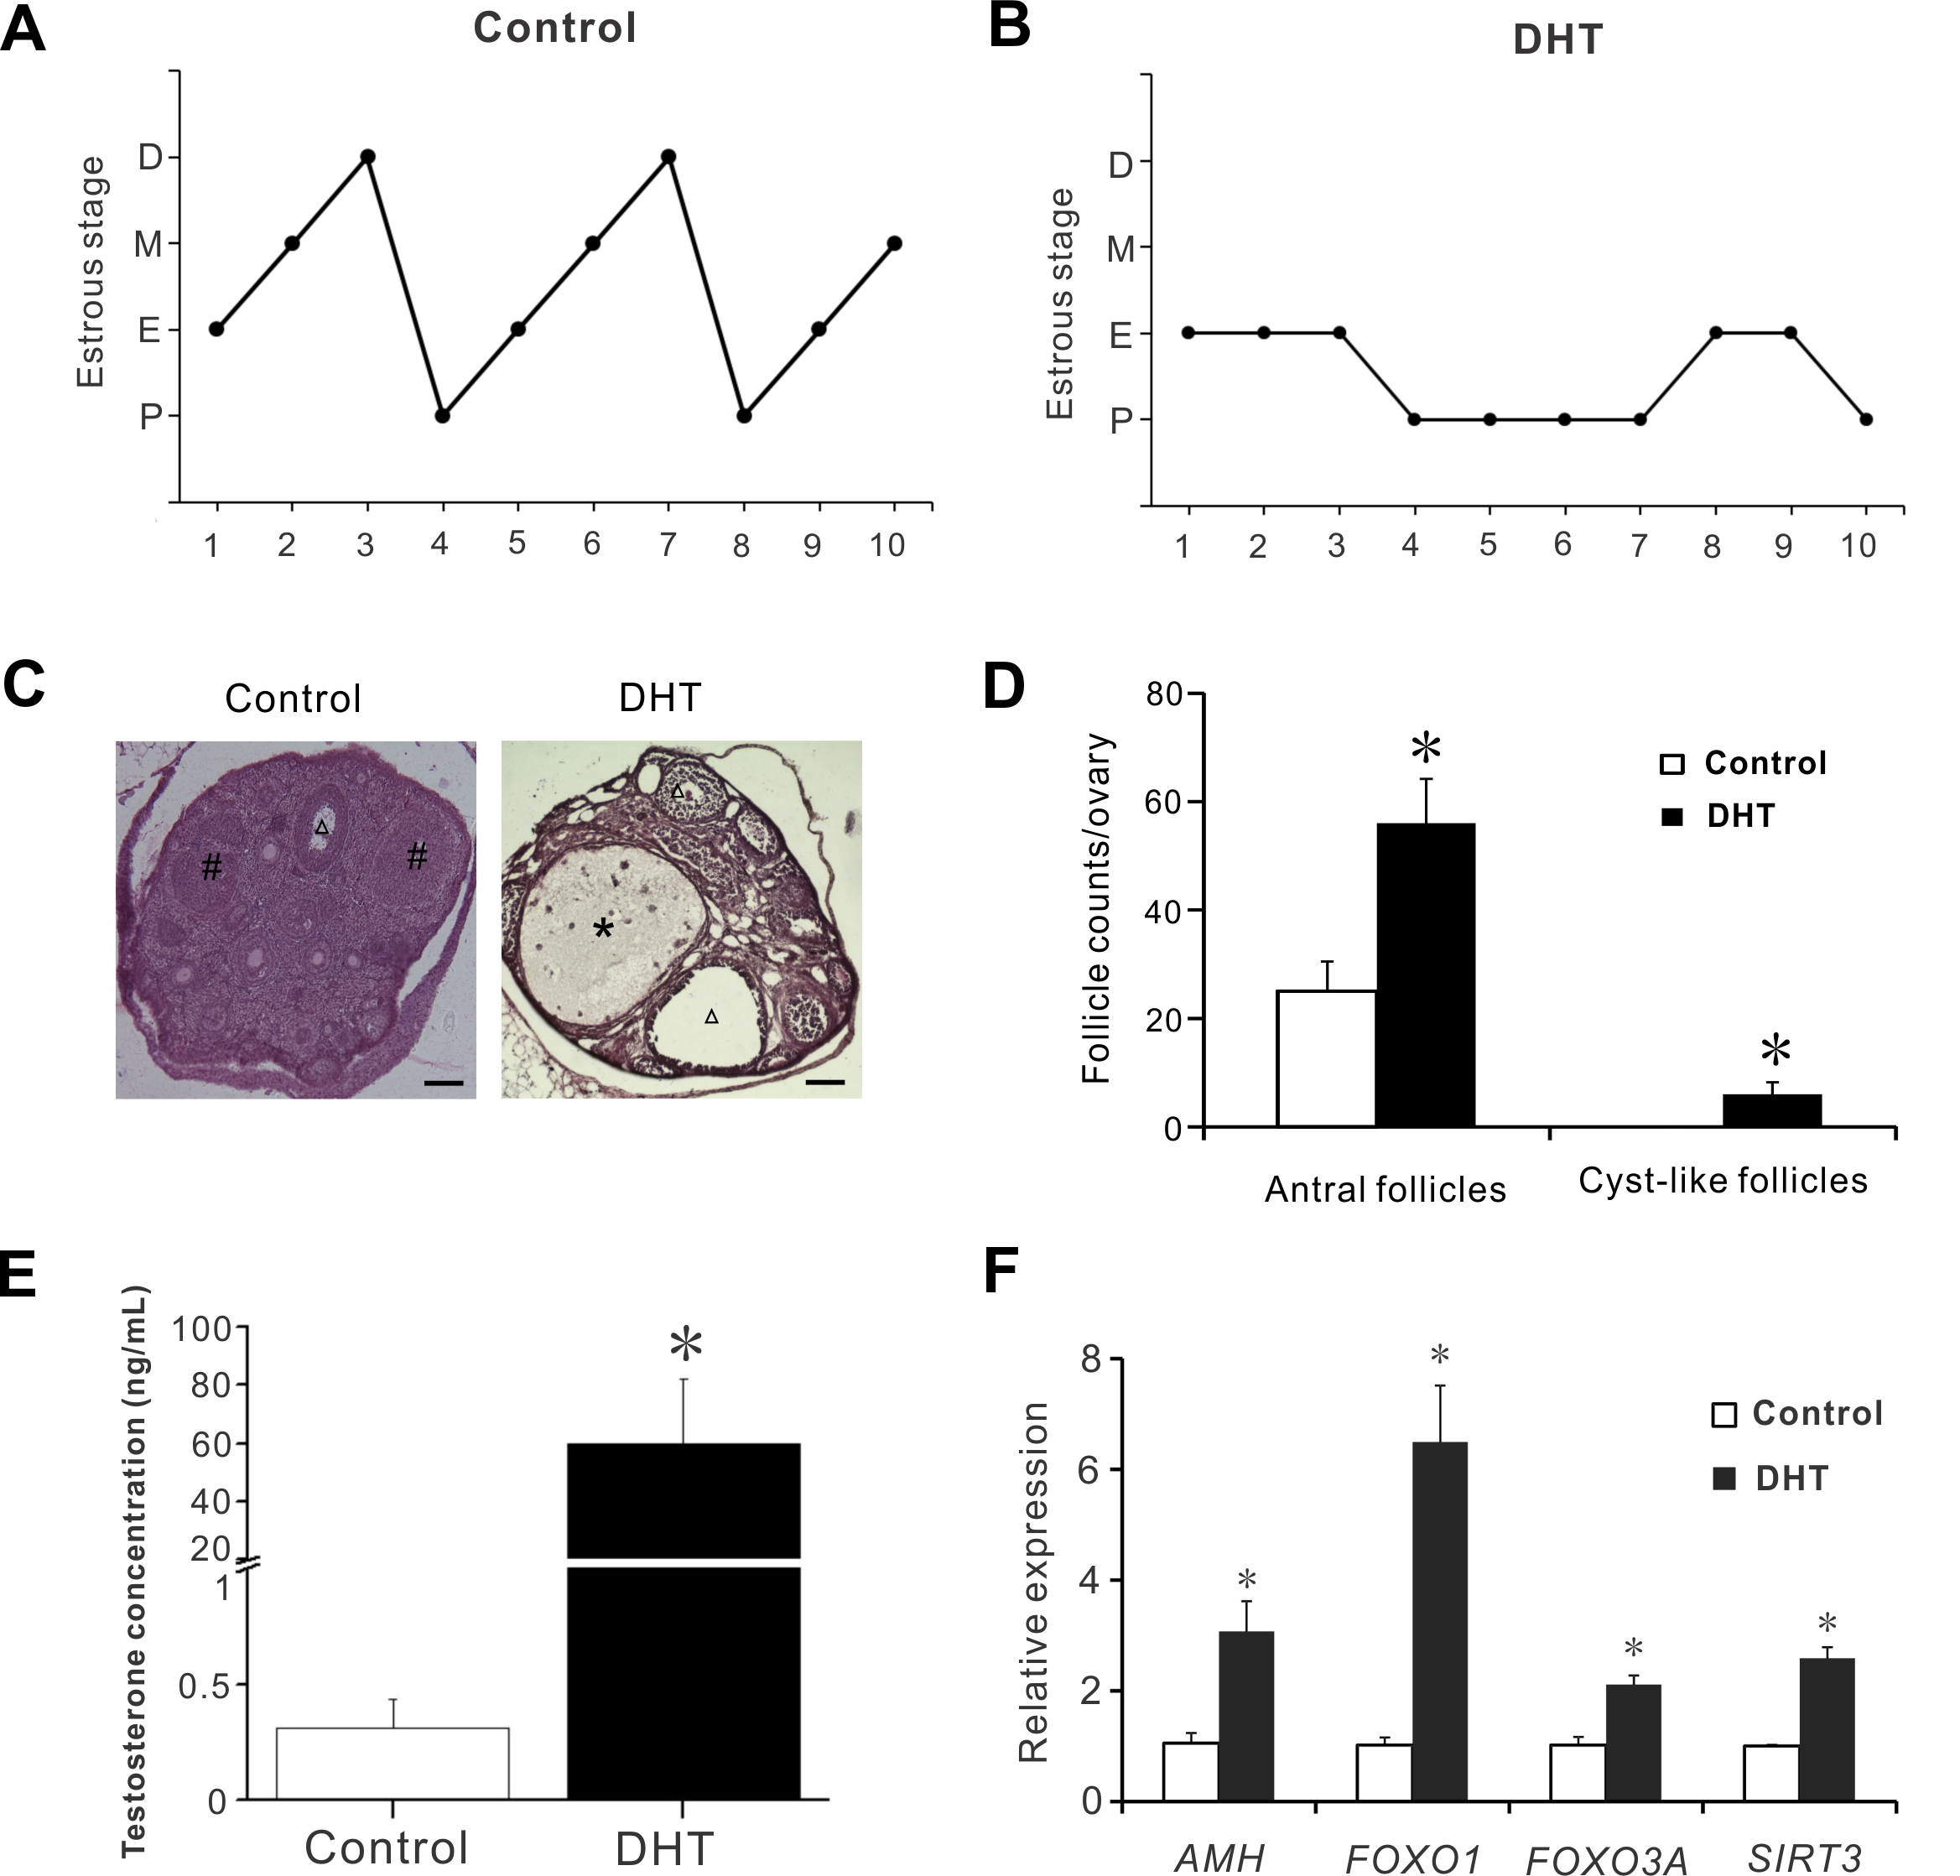 Fig. 3.
Ovarian morphology, serum testosterone levels and ovarian gene
expression in a murine model of PCOS. (A) Representative estrous cycle of the
control mice. (B) Reprentative estrous cycle of the DHT-treated mice. (C)
Representative HE staining of ovarian sections from the controls and DHT-treated
mice. Asterisk indicates cyst-like follicles. Triangle indicates antral
follicles. # indicates corpora lutea. Scale bar = 50
Oxidative stress induced by ROS plays a pivotal role in apoptosis, and has detrimental effects on oocytes [3, 18]. PCOS patients had higher levels of oxidative stress and apoptosis in the follicles compared to non-PCOS patients [19, 20]. A previous report showed the presence of SIRT3 expression in human GCs [11]. A deletion of SIRT3 results in oxidative stress eliciting in GCs. SIRT3 scavenges ROS by activating SOD2 [21]. A meta-analysis showed that SOD activity was higher in PCOS patients than in the controls [22]. Consistent with the previous study, we showed elevated oxidative stress in GCs of PCOS patients [19]. We further found that the expression of SIRT3 was enhanced in GCs of PCOS patients. Although high levels of oxidative stress are detected in women with PCOS, it remains inconclusive whether PCOS patients have poor outcomes of assisted reproductive techniques (ART) treatment [23, 24, 25, 26, 27]. Non-obese PCOS patients have significantly higher total oxidant status and total antioxidant capacity levels compared with the matched controls [28, 29]. Therefore, in our study, higher levels of SIRT3 expression in non-obese PCOS patients may account for the elevated total antioxidant status.
Improvement of insulin resistance decreases the levels of androgen in PCOS patients [30]. Our study showed a positive correlation between T and HOMA-IR levels. Thus, hyperandrogenism may be related to insulin resistance in PCOS patients. Androgens exert their effects by binding to their receptor. Androgen receptor is mainly expressed in GCs throughout follicular development. Therefore, excess androgen may cause GC dysfunction in PCOS patients. In our study, excess androgen induced SIRT3 expression, implying alterations in GC function of PCOS patients.
Communication between the oocyte and GCs is essential for oocyte development [31]. Downregulation of SIRT3 expression altered mitochondrial metabolism and affected the oocyte quality in GCs from patients with reduced ovarian reserve or advanced maternal age [32]. These results suggest high expression of SIRT3 may cause alterations of mitochondrial metabolism in GCs of PCOS patients.
In summary, we showed that SIRT3 expression was increased in luteinized GCs of PCOS patients. Hyperandrogenism promoted oxidative stress and SIRT3 expression in GCs of human and mice. These results suggest that SIRT3 may be involved in the regulation of oxidative stress and GC function in luteinized GCs of non-obese PCOS patients and may be a novel therapeutic candidate for PCOS.
SZ and WD designed the research study. SZ, WD and QL performed the research. SZ, WD and WY analyzed the data. SZ wrote the manuscript. All authors contributed to editorial changes in the manuscript. All authors read and approved the final manuscript.
For human samples, ethics approval was obtained from the Ethics Committee of the First Affiliated Hospital of Wenzhou Medical University (Approved number: YS2016-063 and YS2019-046). For animal experiments, all procedures were reviewed and approved by the Animal Ethical Committee of the Laboratory Animals Center of Chongqing Medical University (Approved number: 2021-184).
Not applicable.
This research was funded by the Natural Science Foundation of Chongqing Municipality (No. cstc2021jcyj-msxmX0097 to SZ), the Natural Science Foundation of Zhejiang Province (No. LQ19H040003 to SZ) and the Natural Science Foundation of Zunyi Medical University (No. F-585 to QL).
The authors declare no conflict of interest.
Publisher’s Note: IMR Press stays neutral with regard to jurisdictional claims in published maps and institutional affiliations.