
Academic Editor: Ambrogio Pietro Londero
Background: In breast cancer, research concerning programmed
death-ligand 1 (PD-L1) on circulating tumor cells (CTCs) is limited. Besides, the
best cell type for determining the prognostic and predictive values of PD-L1 has
not been established. This study investigated associations between PD-L1 on tumor
cells (TCs), CTCs, and tumor-infiltrating immune cells (TIICs), respectively, and
prognosis and clinicopathological features in breast cancer. Methods:
Twenty patients with breast cancer were recruited; one was excluded for confirmed
lymphoma. The PD-L1 on TCs and TIICs was determined via immunohistochemistry;
PD-L1 mRNA expression on CTCs was analyzed. The chi-squared test and Kaplan-Meier
and Cox proportional hazards model analyses were applied. Results: The
median follow-up time was 60 months. Of the 19 patients, 14 had
Breast cancer is the most common malignant tumor worldwide [1, 2]. Mortality in breast cancer patients is mostly due to distant metastasis of circulating tumor cells (CTCs), which may be related to the degree of CTC immunity [3]. The biggest difference between CTC and tumor cell immunity is immune escape, i.e., CTCs that leave the primary tumor microenvironment are exposed to the immune microenvironment of nontumor tissue. The number of peripheral immune cells (ICs) far exceeds the number of CTCs, so the circulatory system can be considered an adverse environment for breast cancer cells [4]. While primary tumors release many cells daily into the bloodstream, only CTCs that escape immunity will develop into distant metastases [5, 6, 7, 8].
In immune escape, PD-1/PD-L1 (programmed cell death protein 1/PD ligand 1) is considered the key factor. PD-1/PD-L1 is widely present in many immune, epithelial, and tumor cells. Drugs relevant to PD-1/PD-L named the immune checkpoint inhibitors (ICIs). ICIs are monoclonal antibodies, which disrupt the ligation of immune checkpoints and receptors, to improve the anti-tumor response [9]. Due to promising outcomes, several PD-L1 ICIs (Atezolizumab, Durvalumab and Avelumab) have been achieved Food and Drug Administration (FDA) approval, for example, in metastatic triple-negative breastcancer (TNBC), non-small cell lung cancer (NSCLC), bladder cancer, urothelial carcinoma [10]. The target PD-1 ICIs, like pembrolizumab, nivolumab and toripalimab, demonstrate the promising effificacy in different cancers, such as melanoma, head and neck squamous cell cancer, NSCLC patients and Hodgkin’s lymphoma [11]. However, concerning breast cancer still different clinical trials are looking for optimizing efficacy and decreasing immune-related adverse events.
As monotherapy or combined anticancer agents to treat breast cancer, all these drugs are being explored [12]. Monotherapy was not that good that, the KEYNOTE-086 [13] and KEYNOTE-119 [14] trials showed response rates lower than 10%, accessing pembrolizumab monotherapy. Several combination treatments have been promising, with chemoimmunotherapy becoming a latest first-line treatment for patients with metastatic TNBC and elevated PD-L1. However, IMpassion130 has limited effectiveness in specific patients (hampered by PD-L1 status and unselected TNBC) [15]. Thus, the selection of breast cancer immunotherapy is hampered by a lack of biomarkers that can predict the response to ICIs. Although PD-L1, usually accessed on tumor cells (TCs) or immune cells (ICs), is considered the most reliable predictor in several tumor types, yet assessment has encountered several limitations, and it is far from standardized.
Thus, the best method for evaluating the PD-L1 status of patients and its prognostic value deserves more discussion. It has been accepted that CTCs affect the prognosis of breast cancer, but there is little research concerning the presence of PD-L1 on TCs, tumor infiltrating immune cells (TIICs), or CTCs [16, 17]. To improve the efficacy of PD-L1 inhibitors, this study investigated associations between PD-L1 on TCs, TIICs, and CTCs, respectively, and patients’ clinicopathological features and prognosis.
Prior to enrollment in this observational study, the patients provided written informed consent. Twenty patients with breast cancer (all women) were enrolled at Peking Union Medical College and Hospital in January 2016 (timepoint M1). For inclusion, the patients were aged 18 to 80 years; and either pre- or post-mastectomy.
Peripheral 10-mL blood samples were collected by venipuncture and stored at in EDTA (ethylenediaminetetraacetic acid) tubes 4 °C until cell isolation. These was all performed within 4 hours. The study cohort included 57 formalin-fixed paraffin-embedded (FFPE) tissue samples. All the sample was performed PD-L1 staining.
Complete clinicopathological data was collected for each patient. Data included pathological type, tumor differentiation, T and N stages, estrogen receptor (ER) and progesterone receptor (PR) status, M1, M2, and HER2 (human epidermal growth factor receptor 2).
The end of follow-up was 18 January 2021 (timepoint M2). At timepoint M1, 10 patients had primary breast cancer and 10 had metastatic breast cancer. At timepoint M2, there was one newly distant metastasis. The main endpoint of follow-up was death, up to 60 months.
The clinicopathological data of the patients were analyzed, including date of surgery, tumor size, pathological type, lymph node metastasis, immunohistochemistry, clinical stage, and patient follow-up. The assessment of distant metastasis was determined according to National Comprehensive Cancer Network (NCCN) guidelines [18].
We used the Canpatrol CTC assay (SurExam, Guangzhou, China;
http://www.surexam.com/) to isolate and classify CTCs [19]. The protocol of the
Canpatrol CTC assay has been described previously [20]. Provided erythrocyte
lysis buffer was added to the peripheral blood samples within 4 hours after
venipuncture, which were then incubated at room temperature for 30 min. To
collect CTCs, the blood samples were filtered using pore-calibrated membrane (EMD
Millipore, Billerica, MA, USA) with 8-
CTCs were classified as 3 phenotypes, i.e., epithelial (epithelial
marker
The amount of PD-L1 on each CTC was judged as none, low, medium, or high, based
on the number of indications (as determined by Canpatrol), or scored nil, 1, 2,
and 3 points, respectively. The total PD-L1 score for each patient was the sum of
the scores on all CTCs. A total PD-L1 score
Four-micron-thick continuous histologic tumor sections were obtained from an
archival FFPE representative tumor block for analysis via immunohistochemistry
(IHC). After deparaffinization and rehydration by transfer through a series of
graded concentrations of ethanol to distilled water, slides were incubated for 15
minutes with 3% H
Two trained observers analyzed the sections. They were blinded to all clinical data. In each sample, we assessed the tumor compartment, without considering the stromal cells. For PD-L1, special emphasis was given so that only membrane staining was considered.
If at least one sample was positive, the patient was classified as positive. The
results were interpreted based on published criteria for the combined positive
score, with the tumor and immune proportion scores included [21, 22]. The scores
were consisting of the ratio of PD-L1
To analyze the association between the amount of PD-L1 on TCs, TIICs, and CTCs
and clinicopathological features, we use the chi-squared and Fisher’s exact
tests. The Kaplan-Meier method and Cox proportional risk model were applied to
analyze the factors influencing prognosis. The statistical analyses were 2-sided,
and p
Among the 20 women patients, one was lost due to a diagnosis of lymphoma, leaving a final study population of 19 patients. Ten patients had received a diagnosis of metastatic breast cancer after surgery; 9 patients had newly diagnosed breast cancer and were prepared for surgery. At baseline (timepoint M1), the patients with and without metastasis were comparable regarding CTC and PD-L1 expression. The median age was 49 years at diagnosis (range, 24–80 y).
In the 19 patients, 14 had more than one CTC in 10 mL peripheral blood. In each
of these 14 patients, PD-L1 was detected on at least one CTC surface (Table 1).
The median PD-L1 total score of the 14 patients was 6 (range, 1–44). Given that
a total PD-L1 score of
| PD–L1 levels on CTCs | |||||||||||||||||
| Nil | Low | Medium | High | PD–L1 on FFPE | |||||||||||||
| Met ** | CTCs | E | E–M | M | E | E–M | M | E | E–M | M | E | E–M | M | Score | TPS score | IPS score | |
| 1 | Yes | 14 | 0 | 0 | 2 | 0 | 2 | 1 | 1 | 7 | 1 | 0 | 0 | 0 | 21 | 0 | 2 |
| 2 | Yes | 25 | 0 | 1 | 0 | 0 | 5 | 2 | 0 | 12 | 2 | 0 | 3 | 0 | 44 | 0 | 2 |
| 3 | Yes | 0 | 0 | 0 | 0 | 0 | 0 | 0 | 0 | 0 | 0 | 0 | 0 | 0 | 0 | 0 | 0 |
| 4 | Yes | 2 | 0 | 0 | 0 | 0 | 2 | 0 | 0 | 0 | 0 | 0 | 0 | 0 | 2 | 0 | 2 |
| 5 | Yes | 0 | 0 | 0 | 0 | 0 | 0 | 0 | 0 | 0 | 0 | 0 | 0 | 0 | 0 | 0 | 0 |
| 6 | Yes | 3 | 0 | 0 | 0 | 0 | 0 | 0 | 0 | 1 | 0 | 0 | 1 | 1 | 8 | 0 | 2 |
| 7 | Yes | 0 | 0 | 0 | 0 | 0 | 0 | 0 | 0 | 0 | 0 | 0 | 0 | 0 | 0 | 0 | 0 |
| 8 | Yes | 0 | 0 | 0 | 0 | 0 | 0 | 0 | 0 | 0 | 0 | 0 | 0 | 0 | 0 | 0 | 2 |
| 9 | Yes | 1 | 0 | 0 | 0 | 1 | 0 | 0 | 0 | 0 | 0 | 0 | 0 | 0 | 1 | 0 | 0 |
| 10 | Yes | 15 | 0 | 1 | 0 | 1 | 4 | 1 | 0 | 6 | 2 | 0 | 0 | 0 | 22 | 0 | 2 |
| 11 | No | 9 | 0 | 0 | 1 | 0 | 0 | 1 | 0 | 6 | 1 | 0 | 0 | 0 | 15 | 0 | 2 |
| 12 | No | 8 | 2 | 2 | 1 | 0 | 1 | 0 | 0 | 2 | 0 | 0 | 0 | 0 | 5 | 0 | 2 |
| 13 | No | 3 | 0 | 0 | 0 | 0 | 0 | 0 | 0 | 3 | 0 | 0 | 0 | 0 | 6 | 0 | 2 |
| 14 | No | 0 | 0 | 0 | 0 | 0 | 0 | 0 | 0 | 0 | 0 | 0 | 0 | 0 | 0 | 0 | 3 |
| 15 | No | 8 | 0 | 1 | 1 | 0 | 2 | 0 | 0 | 4 | 0 | 0 | 0 | 0 | 10 | 0 | 1 |
| 16 | No | 1 | 0 | 0 | 0 | 0 | 1 | 0 | 0 | 0 | 0 | 0 | 0 | 0 | 1 | 0 | 2 |
| 17 | No | 4 | 0 | 0 | 0 | 1 | 1 | 0 | 0 | 2 | 0 | 0 | 0 | 0 | 6 | 0 | 2 |
| 18 | No | 1 | 0 | 0 | 0 | 1 | 0 | 0 | 0 | 0 | 0 | 0 | 0 | 0 | 1 | 0 | 2 |
| 19 | No | 4 | 1 | 0 | 1 | 0 | 0 | 1 | 0 | 1 | 0 | 0 | 0 | 0 | 3 | 0 | 2 |
| * Data is reported as number (n), unless indicated otherwise. ** Met, metastasis on January 2016 (timepoint M1). E, epithelial CTC; M, mesenchymal CTC; E-M, epithelial-mesenchymal CTC; IPS, immune proportion score; TPS, tumor proportion score; FFPE, ormalin-fixed paraffin-embedded; MBC, methylthymol blue complex. | |||||||||||||||||
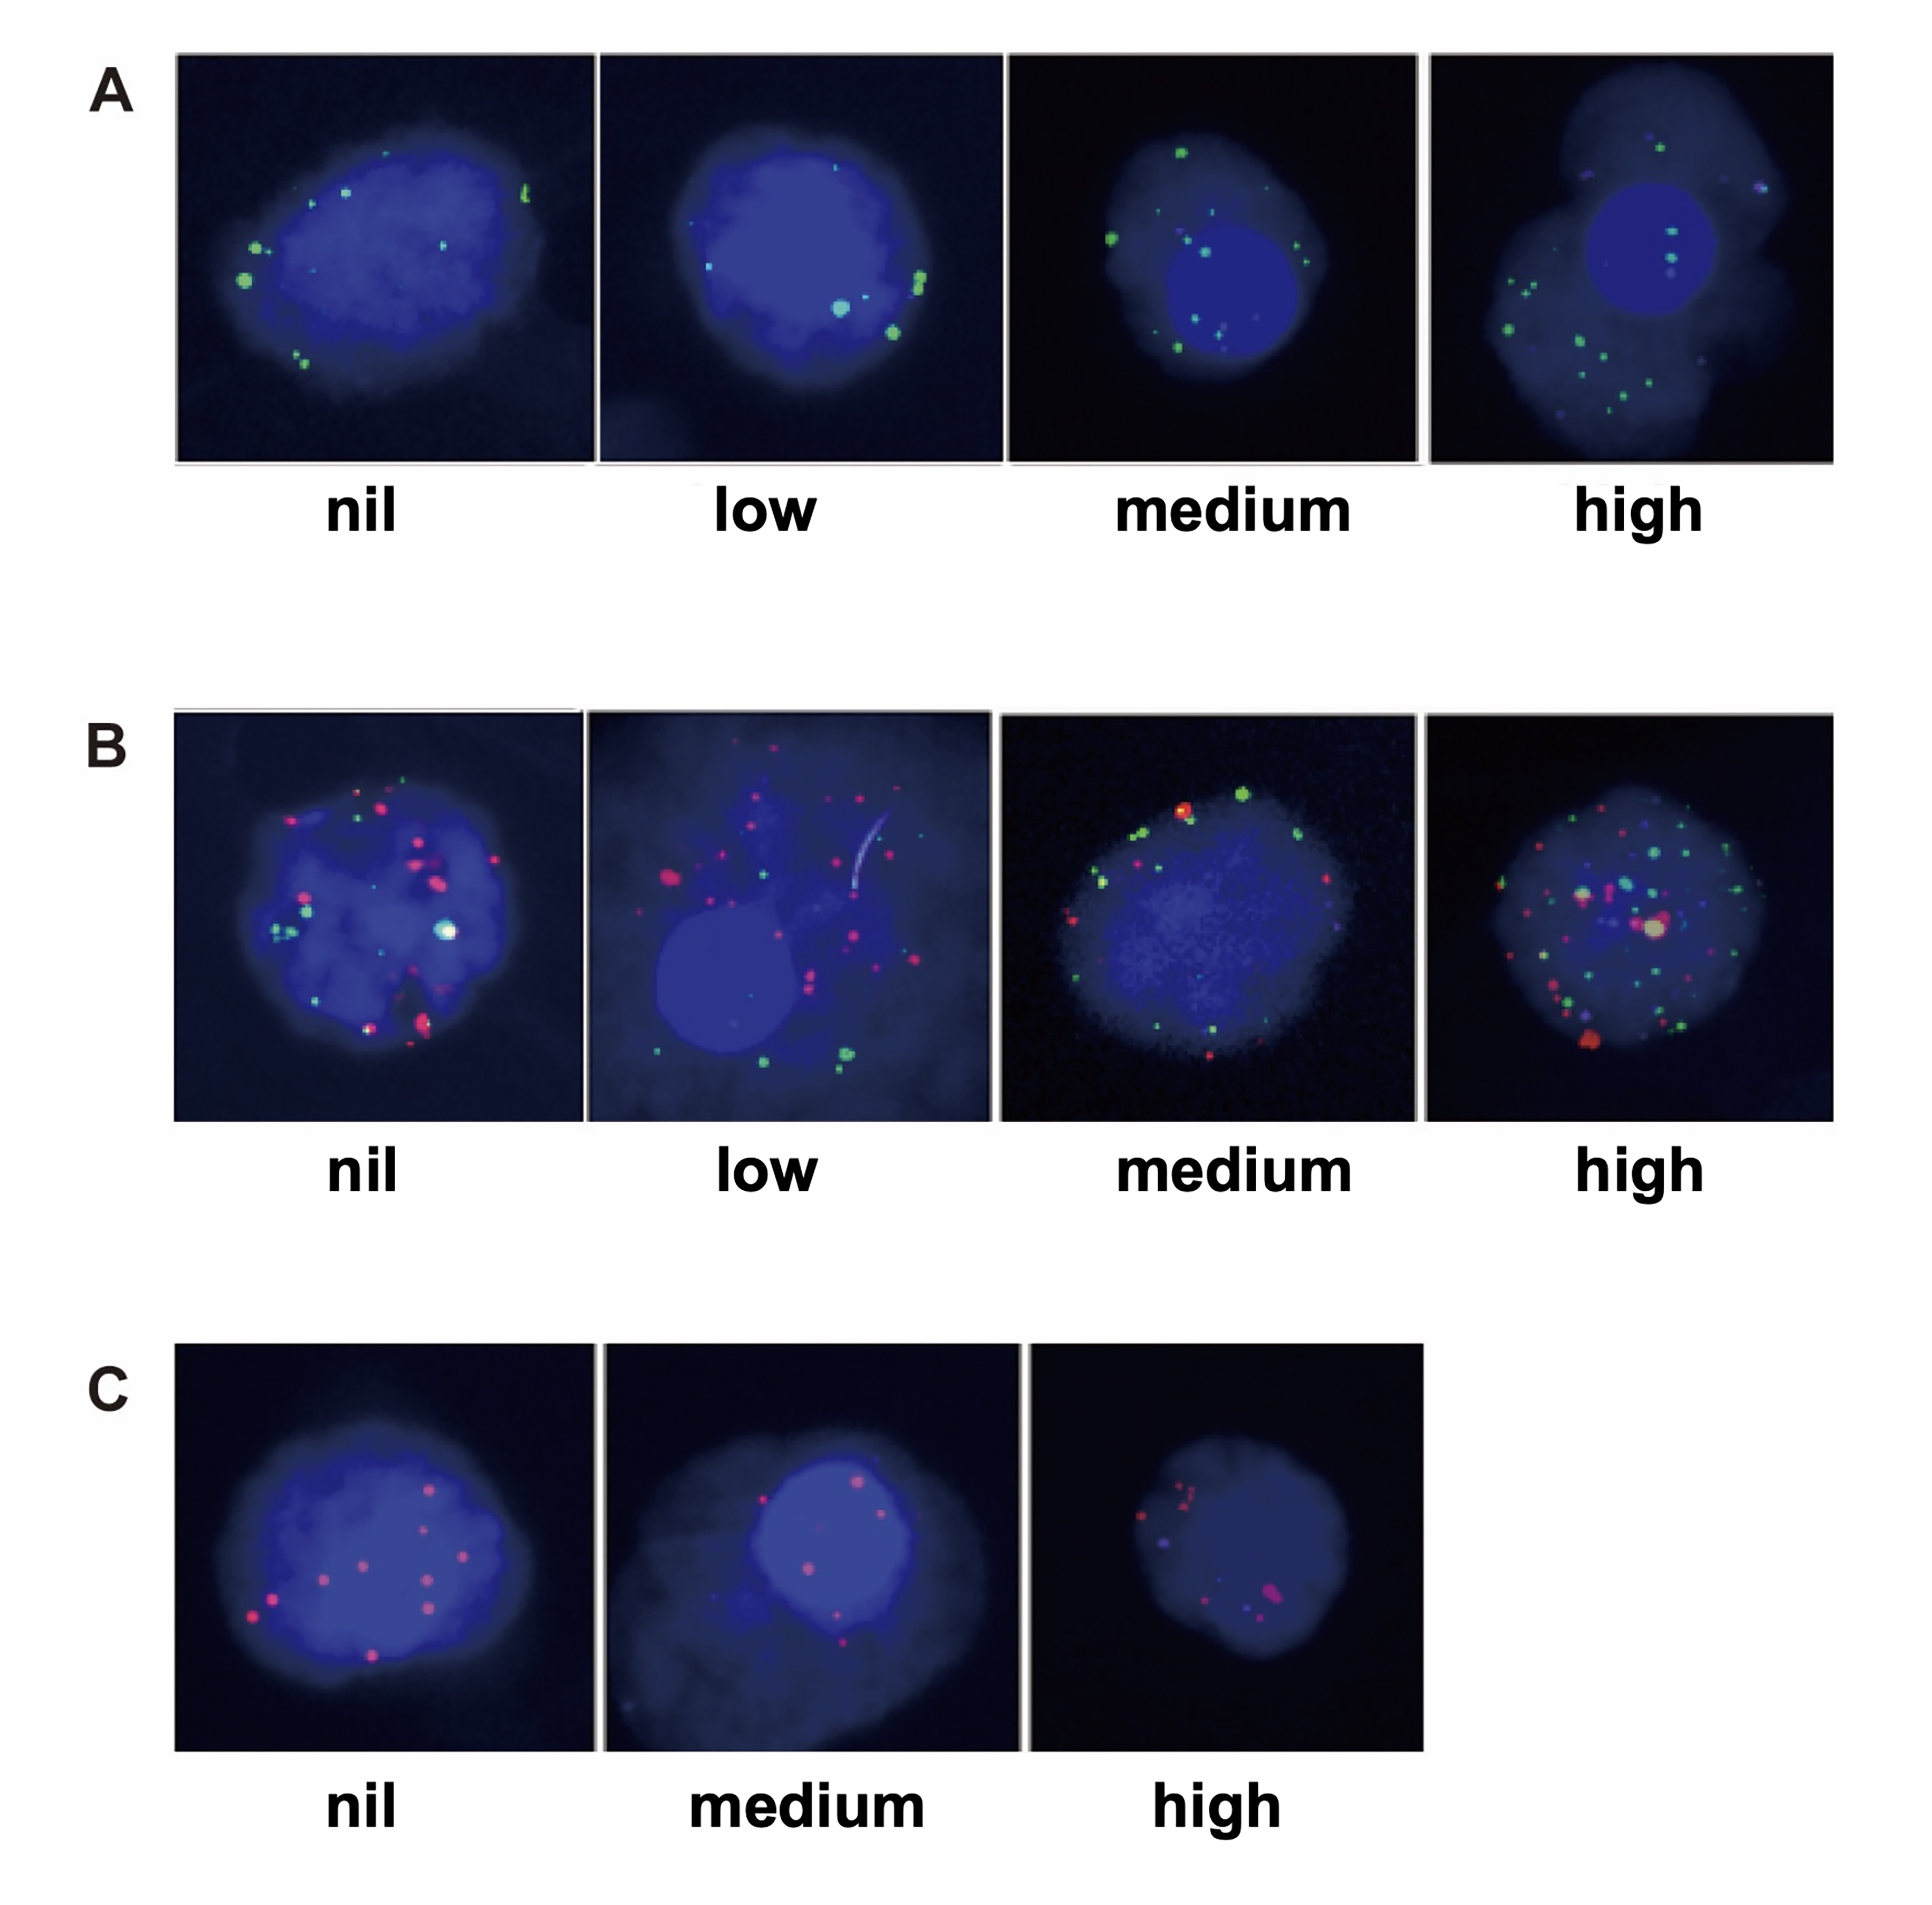 Fig. 1.
PD-L1 intensity (nil, low, or medium) on 3 types of CTCs. (A) Mesenchymal CTC sample, the green dots are mesenchymal markers. (B) Epithelial-mesenchymal CTC. (C) Epithelial CTC sample, the red dots are epithelial markers.
The 19 patients provided 57 FFPE tissue samples, and PD-L1 staining was
performed on every sample. None of the 19 patients had PD-L1 expression on TCs
(
 Fig. 2.
Tissue PD-L1 expression by IHC. (A) primary breast cancer tumor
cells (400
Among the 19 patients, there were 17 cases of invasive ductal carcinoma, and 1 case each of invasive tubular carcinoma and invasive lobular carcinoma. As of January 2016 (the time of recruitment and baseline), the percentages of stage I, II, III, or IV patients were 31.58, 5.26, 10.53, and 52.6%, respectively. The median follow-up was 60 months. Prognosis duration began with the date of CTC detection (January 2016; Table 2).
| Pathology | Differentiation | T | N | M1 | M2 | ER | PR | HER2 | Ki67, % | Death | Months* | |
| 1 | IDC | Moderately | 1 | 1 | 1 | 1 | + | + | – | 30 | Yes | 47 |
| 2 | IDC | Moderately | 2 | 2 | 1 | 1 | + | – | + | 20 | Yes | 6 |
| 3 | ITC | Well | 1 | 0 | 1 | 1 | + | + | – | 2 | No | 60 |
| 4 | IDC | Moderately | 1 | 0 | 1 | 1 | + | + | – | 40 | No | 60 |
| 5 | ILC | Well | 3 | 3 | 1 | 1 | + | + | – | 10 | Yes | 47 |
| 6 | IDC | Moderately | 2 | 1 | 1 | 1 | + | + | – | 20 | Yes | 29 |
| 7 | IDC | Moderately | 1 | 2 | 1 | 1 | + | + | – | 20 | No | 60 |
| 8 | IDC | Moderately | 1 | 1 | 1 | 1 | + | – | + | 10 | No | 60 |
| 9 | IDC | Poorly | 1 | 1 | 1 | 1 | – | – | + | 20 | No | 60 |
| 10 | IDC | Well | 2 | 1 | 1 | 1 | + | + | – | 1 | Yes | 11 |
| 11 | IDC | Poorly | 1 | 0 | 0 | 0 | + | + | – | 90 | No | 60 |
| 12 | IDC | Poorly | 1 | 0 | 0 | 0 | + | + | – | 8 | No | 60 |
| 13 | IDC | Poorly | 1 | 0 | 0 | 0 | – | – | – | 40 | No | 60 |
| 14 | IDC | Moderately | 1 | 0 | 0 | 0 | + | + | + | 5 | No | 60 |
| 15 | IDC | Moderately | 1 | 0 | 0 | 0 | + | + | – | 50 | No | 60 |
| 16 | IDC | Poorly | 1 | 2 | 0 | 0 | + | + | – | 10 | No | 60 |
| 17 | IDC | Poorly | 3 | 2 | 0 | 0 | + | – | + | 75 | Yes | 10 |
| 18 | IDC | Poorly | 2 | 1 | 0 | 0 | – | – | + | 80 | No | 60 |
| 19 | IDC | Moderately | 1 | 1 | 0 | 1 | + | + | – | 40 | No | 60 |
| *Months of follow-up, or if death occurred. IDC, invasive ductal carcinoma; ITC, invasive tubular carcinoma; ILC, invasive lobular carcinoma. | ||||||||||||
There were no associations between PD-L1 expression on TCs, TIICs, or CTCs and clinical pathological characteristics or metastatic status. These lack of associations for PD-L1 on TIICs or CTCs are reflected by the following p-values, respectively: pathological type (p = 0.298, 0.485); tumor differentiation (p = 0.740, 1.000); T stage (p = 0.383, 0.387); N stage (p = 0.111, 1.000); ER status (p = 0.422, 1.000); HER2 (p = 1.000, 1.000); PR status (p = 1.000, 1.000); M1 (p = 0.211, 1.000) and M2 (p = 0.228, 0.658).
The univariate Cox proportional hazards assessment showed that the following were associated with the prognosis of patients: T stage (p = 0.003, hazard ratio [HR] = 4.017, 95% confidence interval [CI]: 1.600–10.084), and PD-L1 on CTCs (p = 0.034, HR = 10.284, 95% CI: 1.189–88.918, Fig. 3). However, the following showed no association with prognosis: age (p = 0.533); pathological type (p = 0.733); tumor differentiation (p = 0.168); N status (p = 0.251); PD-L1 on TIICs (p = 0.924); ER status (p = 0.469); PR status (p = 0.722); M1 (p = 0.139); HER2 (p = 0.722); Ki67 (p = 0.774); epithelial CTC (p = 0.651); mesenchymal CTC (p = 0.734) and epithelial-mesenchymal CTC (p = 0.235, Supplementary Fig. 1 ).
 Fig. 3.
Overall survival analysis. (A) Overall survival analysis of PD-L1 levels on CTC (p = 0.034). (B) Overall survival analysis of T status (p = 0.003).
Results of the multivariate Cox regression analysis indicated that patients with high levels of PD-L1 on CTCs had a lower overall survival (OS) rate (p = 0.029, HR = 94.618, 95% CI: 1.613–5551.594) compared with patients with low levels. In addition, T stage was a prognostic factor (p = 0.01, HR = 14.906, 95% CI: 1.905–116.612).
In clinical trials, ICIs have benefited selected patients. However, targeted molecular therapy requires verified biomarkers to determine indication. Previous research on these issues has led inconsistent results [23, 24], and that the best cell type for determining the prognostic and predictive values of PD-L1 in breast cancer has not been established definitively. Thus, the present study investigated associations between PD-L1 on TCs, CTCs, or TIICs, respectively, and prognosis and clinicopathological features in breast cancer. It was found that PD-L1 expression on TCs and TIICs was not associated with OS. However, patients with high levels of PD-L1 on CTCs had a lower OS rate. These questions have yet to be definitively answered, but the study can serve as a reference for selection of a PD-L1 inhibitor and monitoring during the entire treatment course.
We did not find PD-L1 expression on TCs, which is in accord with Ali et al.’s [25] report, but this differed from the percentages found by the IMpassion130 trial [26]. This may be due to the small sample size, and because patients with other than TNBC were included. Some studies have showed that PD-L1 on TCs in breast cancer points to a bad prognosis, as it does for NSCLC and melanoma [24, 27], although Baptista et al. [23] determined a good prognosis. The present study found no significant association between tissue expression of PD-L1 and survival.
Jacot et al. [16] and Papadaki et al. [17] reported that the PD-L1 rate on CTCs is a poor independent prognostic indicator in metastatic breast cancer. This is consistent with the present study. In our patients, we detected CTCs (whatever their PD-L1 status) in 78.94% , and 31.58% of the patients with 5 or more CTCs, a percentage in line with published pooled analysis [28]. As classically described in MBC [28, 29, 30], we found an association between baseline CTCs and survival.
Interestingly, in accord with the present study, Ali et al. [25] showed that PD-L1 expression in breast cancer is rare, however, enriched in basal-like tumors. And It associated with infiltrating lymphocytes. Schott et al. [31] reported 94.5% of breast cancer patients were positive for PD-L1 on CTCs. This suggests that breast cancer patients may have little PD-L1 in the primary tumor cells (perhaps mostly TNBC cells) but high PD-L1 levels on CTCs. The discrepancy could be due to the mechanism of tumor development, or differences in detection methods, antibodies used, or scoring systems. To date, there is no antibody selection guideline, nor a standard scoring system in breast cancer. Therefore, the heterogeneity of data must be considered cautiously, when obtained via different means such as the CellSearchVR, Parsortix cell separation systems, or others.
Only a few researches have analyzed the levels of PD-L1 on CTCs for cancers of the breast [32], head and neck [33, 34, 35], prostate [36], and lung [37, 38], and other solid tumors. The analysis of the levels of PD-L1 on CTCs in breast cancer patients, and the association between PD-L1 on CTCs in such patients and prognosis, is rare. Our findings should greatly influence PD-L1+ CTC research and will be an indicator for monitoring during immune therapy. We focus on the following aspects, CTC classification, quantitative detection of PD-L1 on CTC and timepoints of detection of PD-L1 on CTCs.
The epithelial-mesenchymal transition of CTCs can result in cell differences that have implications regarding tumor cell proliferation and invasion. Thus, CTCs are now classified as epithelial, epithelial-mesenchymal, or mesenchymal subtypes [39]. The CellSearch system captured epithelial CTCs [40]. In the current study, we capture epithelial CTCs (EpCAM, CKs) and mesenchymal CTCs (VIM, TWIST1), by using CanPatrol CTC enrichment technology and specific probes. In this way we can detect CTCs and type them in the blood samples of our patients. Our results suggest that mesenchymal and epithelial-mesenchymal CTCs portend poor OS, but this is a trend only, not rising to statistical significance. This is consistent with research of other tumors, which showed a correlation between mesenchymal CTCs and tumor recurrence and metastasis [41, 42, 43].
Our research evaluated the density of PD-L1 on CTCs, both qualitatively and
quantitatively. There are very few other similar studies [16, 17], and no
standard method of evaluation. Another study concerning the detection of PD-L1 on
the surface of breast cancer CTCs employed a PD-L1 immune score. Researchers have
scored PD-L1 in SKBR3 TCs and SKBR3 TC clusters quantitatively as nil, 1 (low),
or 2 (high) [32]. In several other studies, more than three CTCs with PD-L1 were
recorded as CTC PD-L1
Previous relevant studies have varied timepoints of detection of PD-L1 on
CTCs—for example, before and after surgery, before and after chemotherapy,
during treatment, or disease progression. Most of the findings are in accord with
ours. For example, after 6 months of treatment, all patients with NSCLC with
progressed disease, and those who had died, had PD-L1
The current research is limited by its small sample size. In addition, at the time the study was conducted, immune suppressants such as PD-L1 inhibitors had not been approved for breast cancer treatment; most of them were in clinical trial. Therefore, all the patients in the present study received only conventional treatment, and no one received immunotherapy. Furthermore, PD-L1 on CTCs should be best detected at various treatment timepoints and locations (tumor, lymph node, and site of metastasis), to clarify whether the treatment itself affects the status of PD-L1 on CTCs at different site, and thus prognosis.
This study determined that high levels of PD-L1 on CTCs may be a prognostic factor that can predict a poor prognosis, especially compared with that of TCs and TIICs. Although the sample size was small, our data warrants a larger cohort in a randomized clinical trial to investigate the value of PD-L1+ CTCs for predicting response to immunotherapy and its association with prognosis. The results of this study are updated and enriched in real time [48]. To continue the analysis of PD-L1 on CTCs as an important biomarker for breast cancer, large-scale validation research must address the optimal method of collecting CTCs; the detection and evaluation criteria of PD-L1 on CTCs; and the optimal sites and timepoints for monitoring.
Our data show that it is feasible to detect the PD-L1 status on CTCs at any stage of breast cancer treatment, and this has prognostic significance. High levels of PD-L1 on CTCs can be a prognostic factor. The dynamic monitoring of PD-L1 on CTCs may be a good choice for efficacy monitoring. Future studies may also consider the effect of different levels of PD-L1 on CTCs. This will provide personalized therapy strategy according to biomarkers.
Not applicable.
CTCs, circulating tumor cells; ER, estrogen receptor; IDC, invasive ductal carcinoma; ITC, invasive tubular carcinoma; PD-1/PD-L1, programmed cell death protein 1/PD ligand 1; PR, progesterone receptor; TCs, tumor cells; TIICs, tumor infiltrating immune cells.
The datasets generated and analyzed during the present study are available from the corresponding author on reasonable request.
XFW, GCZ, and QS designed/performed most of the investigation, data analysis, and wrote the manuscript. SFW provided pathological assistance. JXL contributed to interpretation of the data and analyses. All of the authors have read and approved the manuscript.
The protocol was approved by the Ethics Committee of Peking Union Medical College & Hospital (No. K2520, Beijing, China). Informed consent was attained for every patient included in the study.
Not applicable.
This work was supported by Tsinghua University-Peking Union Medical College Hospital Initiative Scientific Research Program (No. 2019Z), Fundamental Research Funds for the Central Universities (No. 3332021012) and CAMS Innovation Fund for Medical Sciences (CIFMS) (No. 2021-I2M-C&T-B-018). The funding body contributed to the analysis, and interpretation of data.
The authors declare no conflict of interest.
Publisher’s Note: IMR Press stays neutral with regard to jurisdictional claims in published maps and institutional affiliations.