
Objective: In India, despite a reduction in perinatal mortality rate from 2014 to 2019,
still birth rate is still the same at the national average of 4/1000 live
births. As yet there is no nation-wide audit in India except for
facility based audits. Hence the need for a simplified yet effective audit
process exists. The aim of this study was to perform a qualitative perinatal
audit and devise methods for future audits. Methods: We conducted a one year audit for all perinatal deaths using WHO ICD PM and
3-delay classification. Gestational age (GA) specific mortality was calculated for
significant underlying factors using fetuses-at risk approach. Results: We recorded a perinatal mortality rate of 6.1/1000 births among booked cases and
21.32/1000 births among referred cases. Fetal growth restriction was the most
common antenatal condition, accounting to 33.3% of antepartum deaths.
Prematurity accounted to 52% of neonatal deaths. Phase 2 delay with delayed referrals in severe pre-eclampsia and Phase 1 delay
with late visit (
Perinatal death is a devastating experience for the mother and of concern in clinical practice. A regular perinatal audit may identify suboptimal care related to perinatal deaths and thus appropriate measures for its reduction. In India, despite a reduction in perinatal mortality rate from 2014 to 2019, the stillbirth rate is still the same as the national average of 4/1000 live births [1, 2]. In interpreting the results of this paper, it may be important to know the health care system of India. Healthcare is divided into public and private sectors, institutional and non-institutional practice, including informal care providers [2, 3]. In the absence of a national health care system, the reporting of data is poorly established and as yet there is no nation-wide audit in India except for facility-based audits. Hence the need for a simplified yet effective audit process exists. Pattinson et al. [4] have found an average of 30% reduction in mortality following successful audits. Pattinson [4] suggested a minimum standard of tracking stillbirths and pre-discharge intrapartum-related neonatal mortality rates. It is also important to realize the importance of geographical variations in population characteristics and health care challenges. Therefore, there is a need to implement simplified yet effective, facility-based audits, which can be merged into nation-wide audits, catering to the specific needs of each population and their facility.
This study aimed to perform a qualitative perinatal audit using WHO ICD-PM and 3-delay classification and to formulate methods of reducing the perinatal mortality rate (PMR), which are tailor-made for our population and its health care challenges. We have also included gestational age-specific mortalities for stillbirths, adopted from the ‘fetuses-at-risk approach’ of survival analysis [6, 5].
The study adopted a perinatal audit design from ‘Making every baby count Audit’ by the world health organization [4, 7]. This was a prospective audit with monthly audits followed by a yearly summary. The study setting is a 2000 bedded tertiary teaching hospital in the southern Karnataka state of India.
During the study, the obstetric team included 18 obstetricians, 12 labor ward nurses, 12 Neonatology nurses, 5 neonatologists, 30 obstetric residents, and 4 neonatology residents. Our hospital is a 2000 bedded hospital catering to an approximate 50,000 population from Karnataka, Kerala, Goa, etc. The population is therefore diverse in language and culture [8, 9, 10]. The obstetric population attending the hospital is mainly covered by Manipal Health Plan or Medicare [11]. The chief referring hospitals include private practitioners and rural health centers in Shimoga and Karkala.
The study population included all stillbirths and neonatal deaths. A stillbirth was defined as fetal death after at least 26 completed weeks of gestation and early neonatal death was defined as a live birth after 26 completed weeks, dying within the first seven days of birth. We have also included neonatal deaths up to 28 days of life with antepartum or intrapartum causes contributing to the cause of death. Fetuses that died during labor or those that show no signs of maceration were termed as ‘fresh’ stillbirths. All mothers received bereavement counseling. However Perinatal mortality was still calculated using WHO definition i.e., “Sum of infant deaths that occur at less than 7 days of age and fetal deaths with a gestational age of 28 weeks or more per 1000 live births”. However stillbirths from 26 to 28 weeks and neonatal deaths up to 28 days after birth have been included in the analysis [12]. A lower cut off was used for analysis, as the limit of viability at our institute was 26 wks. Infants born at or after 26 wks. were eligible to receive an active intervention.
We conducted this audit from January 2018 to December 2018 for all stillbirths beyond 26 weeks gestation and early neonatal deaths. In comparison to WHO audit [7], we used a lower cut off of 26 weeks according to our NICU set up. These analyses were done in a monthly manner during perinatal mortality meets, conducted in this hospital. The members of the audit committee involved six senior obstetric consultants, two pediatric consultants, and two external advisors. Consultants reviewed the cases and determined the causes during an individual, in-depth analysis of each case. The head of the department had the final word on establishing the cause and delay in each case. The external auditors independently re-reviewed the cases and categorized them. WHO ICD PM Classification was used and underlying factors were divided according to 3-delay classification. Gestational age-specific mortality was calculated for significant underlying factors such as pre-eclampsia and gestational diabetes.
The data was collected in the forms of WHO death certificates and perinatal death indicators according to WHO audit [7]. Additional information including the total number of births and preterm births at each gestational age was collected from the centrally maintained parturition registry. The data was analyzed using descriptive statistical measures. IBM SPSS 20 software used for statistical analysis. This study is approved by the Institutional Ethical Committee of Kasturba Medical College (IEC 434/2019).
WHO-ICD PM Classification is adopted from the “World Health Organization. Making every baby count: audit and review of stillbirths and neonatal deaths” [7].
The Three Delay classification [13] used, adopted from Waisma et al. [14], is as follows:
Delay 1 - Where Patient/Family is unaware of the need for skilled care / unaware of warning signs.
Delay 2 - Where necessary maternal/perinatal health services did not exist. Where distance or cost was a factor.
Delay 3 - Where the patient is received but there was a lack of timely care/poor quality of care.
The audit cycle was adopted from the six steps to the audit cycle described by Pattinson et al. [4], gestational age-specific mortalities for stillbirths, adopted from the ‘fetuses-at-risk approach’ of survival analysis by Yudkin et al. [6, 5].
During the year 2018, we had 3224 deliveries and 3236 live births. Of which we had 52 stillbirths and 37 early neonatal deaths. We recorded a perinatal mortality rate of 6.1/1000 births among booked cases and 21.32/1000 births among referred cases. Fig. 1 shows the flow chart of cases included in the audit.
 Fig. 1.
Flowchart showing cases included in the audit.
Fig. 2a-c show Gestational age-specific mortalities, calculated using fetuses-at risk approach, show a peak mortality rate at 30 weeks, 37 weeks and 38 weeks in pregnancies with early-onset preeclampsia, severe fetal growth restriction, and medically treated gestational diabetes respectively.
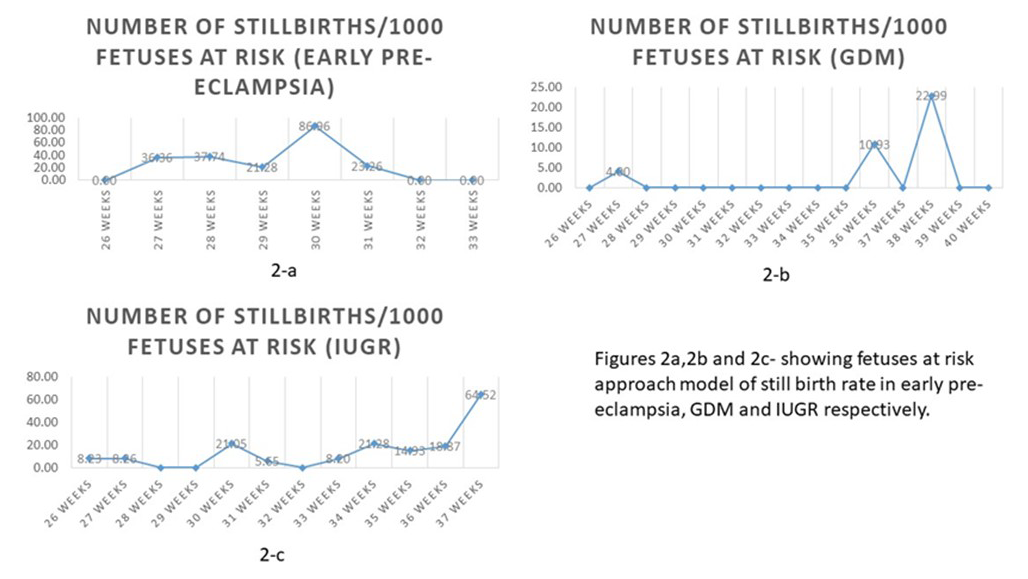 Fig. 2.
Gestational age-specific mortalities, calculated using fetuses-at risk approach, in early pre-eclampsia, GDM and IUGR in 2-a, 2-b and 2-c respectively.
The results using ICD-PM and 3-delay classification are as described in Tables 1-5. The predefined categories in the Tables 1-3 are per WHO ICD-PM classification [18].
During the year 2018, we had 52 stillbirths and 37 early neonatal deaths out of 3224 deliveries and 3236 live births. A ‘booked case’, a common term used in Indian practice, was defined as a pregnant woman who had at least three antenatal clinic visits in our hospital [16, 15]. All others, including those referred from local private practitioners and rural health centers, were categorized as ‘Referred’ cases [16]. We recorded a perinatal mortality rate of 27.5/1000 live births, with 6.1 among booked cases and 21.32 among referred cases. Although perinatal mortality rate is similar to the national average of 27/1000 live births [17], we recorded a higher stillbirth rate. This may be due to high load of referred cases with over 80% received with absent fetal heart rate. Referred cases accounted for 77% of the total birth rate. Of 89 cases, all cases were reviewed for the audit. Causes were identifiable in 80 cases, whereas delays were identifiable in only 25 cases. There were no maternal deaths during the study.
Table 1 shows the causes of antepartum deaths according to ICD-PM. Congenital anomalies have accounted for 18% of the causes of stillbirths. Fetal growth restriction accounted for 33.3%. Maternal medical conditions were associated with up to 51.5% of causes for stillbirth.
MATERNAL |
M1: COMPLICATIONS OF PLACENTA |
M2: MATERNAL COMPLICATIONS OF PREGNANCY |
M3: OTHER COMPLICATIONS OF LABOUR |
M4: MATERNAL MEDICAL AND SURGICAL |
M5: NO MATERNAL CONDITION |
OTHER |
TOTAL number -n (%) |
| PERINATAL CAUSE OF DEATH-ANTEPARTUM DEATH | |||||||
| A1: CONGENITAL MALFORMATIONS, DEFORMATIONS AND CHROMOSOMAL ABNORMALITIES | 2 | 4 | 6 (18) | ||||
| A2: INFECTION | 1 | 1 | |||||
| A3: ANTEPARTUM HYPOXIA | 1 | 5 | 1 | 7 (21) | |||
| A4: OTHER SPECIFIED ANTEPARTUM DISORDER | 1 | 1 | 2 | ||||
| A5: DISORDERS RELATED TO FETAL GROWTH | 3 | 6 | 2 | 11 (33.3) | |||
| A6: FETAL DEATH OF UNSPECIFIED CAUSE | 1 | 5 | 3 | 6 (18) | |||
| TOTAL n (%) | 5 | 17 (51.5) | 11 (33.3) | 33 | |||
Table 2 shows intrapartum deaths according to ICD-PM. Abruption is our leading cause of intrapartum death, accounting to 86%. Preterm births account for 52% of neonatal deaths, sepsis accounting to 25%.
MATERNAL |
M1: COMPLICATIONS OF PLACENTA |
M2: MATERNAL COMPLICATIONS OF PREGNANCY |
M3: OTHER COMPLICATIONS OF LABOUR |
M4: MATERNAL MEDICAL AND SURGICAL |
M5: NO MATERNAL CONDITION |
OTHER |
TOTAL of causes (%) |
| PERINATAL CAUSE OF DEATH- INTRAPARTUM DEATH | |||||||
| I1 : CONGENITAL MALFORMATIONS, DEFORMATIONS AND CHROMOSOMAL ABNORMALITIES | 1 | 1 | |||||
| I2 : BIRTH TRAUMA | |||||||
| I3 : ACUTE INTRAPARTUM EVENT | 19 | 2 | 11 | 1 | 22 (90) | ||
| I4 : INFECTION | |||||||
| I5 : OTHER SPECIFIED INTRAPARTUM DISORDER | |||||||
| I6 : DISEASES RELATED TO FETAL GROWTH | 1 | 1 | |||||
| I7 : INTRAPARTUM DEATH OF UNSPECIFIED CAUSE | |||||||
| TOTAL (%) | 13 (60) | 25 | |||||
Table 3 shows early neonatal deaths, including late neonatal deaths due to
intrapartum factors according to ICD-PM. Extreme prematurity (
MATERNAL |
M1: COMPLICATIONS OF PLACENTA |
M2: MATERNAL COMPLICATIONS OF PREGNANCY |
M3: OTHER COMPLICATIONS OF LABOUR |
M4: MATERNAL MEDICAL AND SURGICAL |
M5: NO MATERNAL CONDITION |
OTHER |
TOTAL n (%) |
| CAUSES OF EARLY NEONATAL DEATH | |||||||
| N1: CONGENITAL MALFORMATIONS, DEFORMATIONS AND CHROMOSOMAL ABNORMALITIES | 3 | 4 | 7 (14.5) | ||||
| N2: DISORDERS RELATED TO FETAL GROWTH | 7 | ||||||
| N3: BIRTH TRAUMA | |||||||
| N4: COMPLICATIONS OF INTRAPARTUM EVENTS | 1 | 1 | 3 | 3 (6) | |||
| N5: CONVULSIONS AND DISORDERS OF CEREBRAL STATUS | |||||||
| N6: INFECTION | 2 | 2 | 1 | 7 | 1 | 12 (25) | |
| N7: RESPIRATORY AND CARDIOVASCULAR DISORDERS | 1 | 1 | 1 | ||||
| N8: OTHER NEONATAL CONDITIONS | |||||||
| N9: LOW BIRTH WEIGHT AND PREMATURITY | 2 | 9 | 1 | 13 | 2 | 27 (52) | |
| N10: MISCELLANEOUS | |||||||
| N11: NEONATAL DEATH OF UNSPECIFIED CAUSE | |||||||
| TOTAL (%) | 34 (57.6) | 48 | |||||
Table 4 shows the causes of perinatal mortality and phases of delay according to
the ‘3-delay’ model. Phase 2 delay was more common than phase 1. Phase 2 delay
with delayed referrals in severe pre-eclampsia and Phase 1 delay with a late
visit (
| Cause | Macerated n | Fresh n | Total n | % | Delay1 | Delay2 | Delay3 |
| % | % | % | |||||
| Fetal Growth Restriction: | 11 | 30.7 | 25 | 25 | 0 | ||
| Very early 27-29 w | 1 | 1 | |||||
| Early 29-34 w | 4 | 3 | |||||
| Late |
1 | 3 | |||||
| With doppler changes | 4 | ||||||
| Severe oligo | 3 | 3 | |||||
| Non immune hydrops fetalis | 1 | 2 | 3 | 5 | |||
| Twin complications | 3 | 3 | 5 | ||||
| Anomalies | 1 | 6 | 7 | 13.4 | 1 | ||
| Sepsis (e.coli) | 1 | 1 | |||||
| Intrauterine hypoxia | 2 | 2 | 5 | ||||
| Eclampsia | 1 | 1 | |||||
| Intrapartum stress | |||||||
| Fetomaternal hemorrhage | 1 | 1 | |||||
| Abruption | 18 | 18 | 34.6 | 17% | |||
| Unexplained | 1 | 7 | 8 | 15 | 40 |
Table 5 shows maternal risk factors associated with perinatal deaths. Hypertension stood out to be the single most common risk factor associated with 50.5% of all the causes. Early-onset pre-eclampsia was seen in up to one-third of cases. Multiple pregnancy and Gestational diabetes are the next most common maternal risk factors (Table 5).
| MATERNAL RISK FACTOR | Number-n | % OF TOTAL DEATHS |
| DIABETES- | 14.6 | |
| 1. GDM CONTROLLED | 11 | |
| 2. GDM WITH FGR | 1 | |
| 3. OVERT DIABETES | 1 | |
| 4. UNCONTROLLED | 1 | |
| Hypertensive disorders | 50.5 | |
| 1. Early onset preeclampsia | 15 | |
| 2. Pre eclampsia | 10 | |
| 3. Recurrent pre eclampsia | 5 | |
| 4. Severe preeclampisa/HELLP | 6 | |
| 5. Eclampsia | 2 | |
| 6. APLA/SLE | 4 | |
| 7. Chronic hypertension | 3 | |
| Heart failure | 1 | |
| Multiple pregnancy | 11 | 12.3 |
| Reccurrent Abruption | 2 | 12.3 |
| Reccurrent Iud | 3 | |
| Recc. Preg loss | 1 |
We used the fetuses-at risk approach, first described by Joseph et al. [6] in 2017 to calculate gestational-age specific mortalities, compared to the traditional births-based model. This formulation involved replacing the denominator of mortality rates, from ‘total births at the gestational age’ to ‘surviving fetuses at the gestational age’.
Births-based model-
The GA-Specific mortality rate at ‘x’ GA = No of stillbirths at ‘x’/total births *1000
Fetuses at risk approach-
The GA-Specific mortality rate at ‘x’ GA = No of stillbirths at ‘x’/surviving fetuses at ‘x’ *1000
This denominator excludes all fetuses previously stillborn or delivered.
This approach treats gestational age as survival time and allows the estimation of the incidence of stillbirth among the population of surviving fetuses. For example- The incidence of stillbirth in hypertensive pregnancies may be misleadingly low at 40 weeks by birth-based model but would be high by fetuses-at risk approach, as the denominator now includes only the surviving fetuses, as most women may have been delivered before 40 weeks gestation. We extended this approach for pregnancy-related disorders in an attempt to identify the gestational age, at which fetuses may be at risk of stillbirth. This may be particularly important in knowing the nature of the disease in a local population, which may or may not be representative of the general population. This tailor-made approach to facility based-audits may help identify and tackle critical problems relatable to the local population.
The Fig. 2a-c show GA-specific mortalities for 1000 fetuses at risk for each condition. The X-axis represents surviving fetuses at risk in mothers with the given condition and Y-axis represents GA specific mortalities for 1000 fetuses at risk. As shown in Fig. 2a, stillbirth rates are highest at 30 weeks gestation in women with early-onset pre-eclampsia, whereas pregnancies with GDM on medical treatment, recorded the highest SB between 38-39weeks (Fig. 2b). Fetuses with severe IUGR with or without Doppler abnormalities had high stillbirths beyond 37 weeks (Fig. 2c). Although these graphs are based on a smaller population compared to national statistics and have not been controlled for associated factors such as associated medical conditions, they do provide an overall insight into the ‘gestational age at risk’ for each condition.
Based on the ICD-PM, 3-Delay model, and GA-specific mortalities, the audit committee suggested and made the recommendations, as listed in Table 6.
| Implementation of perinatal death certificate for better audit |
| Reducing the load of complicated referrals by encouraging early referrals for complicated cases |
| Reducing phase 1 delay by better communication of warning signs |
| Booking visit for all high risk pregnancies with further follow-up at local hospital |
| Early admission for patients with hypertensive disorders |
| Strict handwashing practices and reducing per-vaginal examinations |
| Encouraging autopsy and karyotyping in all perinatal deaths |
| Regular briefing of residents and nursing staff on labour room practices |
On review of literature, developed countries have established national level audits whereas developing and under-developed countries have published facility-level audits.
In 2009, Mbaraku et al. [13] conducted a perinatal audit of 2 years using 3-delay classification and ‘process audit’ Each case was reviewed by comparing with the standard protocol using expert consensus. Substandard care was identified and attempts were made to rectify.
In 2017 Musafil et al. [19] conducted a one-year perinatal audit in hospitals of Rwanda, Africa using three delay classification. Factors contributing to mortality and potentially avoidable deaths, considering the local resources and feasibility, were identified using a three-delay model.
In 2018, Lavin et al. [20] conducted a three-year perinatal audit with ICD-PM classification. The data was originally collected in the South African classification system followed by conversion to ICD-PM. The original classification did not include the timing of death and Lavin et al. have found ICD-PM to be more efficient. The main benefit was found to be the linking of maternal condition which allowed better analysis.
Our study was the first of its kind to combine both ICD PM and 3 delay classification. The study also features gestational age-specific mortalities. Core difficulties were easily identifiable using this audit process.
Implications of Practice and/or Policy.
This audit sets an example for the implementation of both ICD-PM classification and 3-Delay classification in a perinatal audit, first of its kind to our knowledge, and the use of ‘fetuses-at risk’ approach to define and customize management to individual populations, as it is often noted that local population may not represent the larger general population.
We found that ICD-PM and 3-delay classification was simple and easy to apply with wide areas of opportunities for secondary analysis. The gestation age-specific mortality by fetuses at risk approach can be found helpful for clinical decision-making for ideal admission/induction time and future audits.
Small sample size due to shorter audit interval. Prospective audit with ICD-PM, 3-delay, and gestational age-specific mortalities for the following years would reflect better.
Facility-based audit. May only be representative of tertiary level care. Expanding to all facilities of the state comes with the difficulties of obtaining data and maintaining confidentiality.
Underlying genetic cases may have been missed due to a lack of autopsies. Cultural barriers still exist preventing full evaluation of stillbirth.
RU, SVP and MVP conceived the concept. RU and MZ contributed to the design, data collection and implementation of the research. LL also contributed to the data collection. MZ conducted the data analysis. RU and MZ wrote the manuscript. All authors contributed to editorial changes in the manuscript. All authors read and approved the final manuscript.
The authors thank Dr. Jonala Chaitanya Reddy, PGY2 pediatric resident, MAHE for assistance in data collection. Thanks to all the peer reviewers and editors for their opinions and suggestions.
The authors declare no competing interests.