
Objectives: To compare forehead height (FH), facial heights (FaHs) and the ratios of biparietal diameter (BPD) and femur length (FL) to these heights in midtrimester normal and Down syndrome (DS) fetuses. Methods: 150 normal and 26 DS fetuses were scanned at 15-25 weeks of gestation. At the mid-sagittal image of the fetal profile, FH, FaH, upper facial height (UFaH) and lower facial height (LFaH) were measured in millimeters with “two line distance” tool. The results were expressed as multiples of the gestation-specific normal median (MoMs) using the regression of the equation derived from normal fetuses. The ratios of BPD/UFaH, BPD/LFaH, BPD/FaH, BPD/FH, FL/UFaH, FL/LFaH, FL/FaH, FL/FH were also assessed. Results: In normal fetuses, FH and FaHs increased linearly with gestational age (GA). UFaH increased linearly from 5.2 mm at 15 weeks to 15.7 mm at 25 weeks. LFaH increased from 9.3 mm at 15 weeks to 32 mm at 25.2 weeks. FaH increased from 16 mm at 15 weeks to 39 mm at 25 weeks. FH increased from 17.7 mm at 15 weeks to 42.8 mm at 25 weeks. Only UFaH was found to be significantly smaller in DS fetuses (with a mean of 0.91 MoM, 95% CI, 0.7-1.1, p = 0.003), than in normal fetuses (1 MoM, 95% CI, 0.6-1.3). Concomitantly, none of the ratios changed with gestation and all were found to be statistically higher in DS fetuses (p < 0.05). Conclusions: UFaH, is smaller in DS fetuses compared with normal fetuses in the midtrimester of pregnancy. The ratios of BPD and FL to all heights are higher in fetuses with DS than in normal fetuses.
In 1866, Langdon Down first described the typical features of Down syndrome (DS). The two main phenotypic features of DS are redundant skin and a flat face with a small nose due to midfacial hypoplasia [1]. These two features have evolved into markers and are used in prenatal screening of this syndrome. The redundant skin has been demonstrated sonographically as increased nuchal translucency in the first trimester, thickened nuchal fold in the second trimester and increased prenasal thickness in both trimesters [2-4]. Midfacial hypoplasia has been addressed sonographically by a number of different markers such as absent or hypoplastic nasal bone, increased frontomaxillary angle, smaller maxilla-nasion-mandible angle, smaller maxilla-mandible-nasion angle and a positive facial profile line [5-10].
Postnatal anthropometric and radiological studies have shown that individuals with DS have different craniofacial patterns. Besides maxillary hypoplasia, short and flat cranial base, hypoplastic frontal and palatine bones, absent vomer, hypo- or oligodontia, and long lower anterior facial height have been demonstrated. In studies concerning the mandible, inconsistent findings have been obtained [11-13].
Although a wide range of facial studies have been conducted in fetuses with DS in the literature, studies on facial heights are limited. From this standpoint, we aimed to evaluate forehead height (FH), facial heights (FaHs) and the ratios of biparietal diameter (BPD) and femur length (FL) to these heights in midtrimester normal fetuses and compare with those of DS fetuses.
FH and FaHs were measured in 150 consecutive singleton unaffected pregnancies scanned at 15 to 25 weeks of gestation and from stored ultrasound midsagittal facial images in 26 DS pregnancies scanned over 3-year period at similar gestational ages from January 2014 to January 2016 at the maternal fetal medicine unit of Istanbul University, Faculty of Medicine. All the fetuses with DS had prenatal diagnoses, in whom chorionic villus sampling or amniocentesis was performed because of detected fetal structural anomaly or high-risk at DS screening tests.
Gestational age (GA) of pregnancy at sonographic assessment was determined by last menstrual period (LMP). If LMP was not available or discordance was present between GA derived from LMP and biometric measurements, GA derived from the first-trimester crown-rump length was used. Fetal BPD and FL were also recorded. All the measurements and detailed fetal anatomic survey had been performed transabdominally using a RAB 4-8 MHz probe (Voluson 730 expert, General Electrics Medical Systems, Zipf, Austria) by one author (I.H.K) who was aware of the fetal karyotype.
Fetal profile had been acquired from as close as possible to the exact mid-sagittal plane of the fetal head with closed mouth, when the angle between sonographic beam and palate was about 45◦. Following identification of vomer, first line was placed onto the upper margin of maxillary bone using two-line distance measurement tool of the machine. Another line parallel to the first line was also tangentially placed onto a level crossing the most prominent border of the cranial vault skin as seen in Figure 1A/1D. The distance between these two parallel lines was measured and recorded as the first measurement. Afterwards, the second line was moved to a level crossing the anterior edge of the inferior part of the frontal bone without setting previous measurement, in order not to require another measurement tool and not to reposition the first line. The distance between the lines at these positions was recorded as upper facial height (UFaH) (Figure 1B-1E). Forehead height (FH) was defined as the difference between the first and second (UFaH) measurements. Then the second line was moved to a parallel position that was tangential to the inferior border of fetal jaw skin. Finally, the distance between the first line and the lastly rearranged line was recorded as lower facial height (LFaH) (Figure 1C-1F). Facial height (FaH) was also defined as the sum of the UFaH and LFaH. Then, the measurements of UFaH, LFaH, FaH, FH and the ratios of BPD/UFaH, BPD/LFaH, BPD/FaH, BPD/FH, FL/UFaH, FL/LFaH, FL/FaH, FL/FH were statistically evaluated and compared between two groups.
 Figure 1.
— Ultrasound images of a normal fetus (A, B, C) and a fetus with Down syndrome (D, E, F) showing the forehead and facial height measurements at 20 weeks of gestation. Figures 1A and 1D, show the two lines passing through the most prominent border of the cranial vault and the upper margin of the maxilla, respectively in a normal fetus and a fetus with Down syndrome. Figures 1B and 1E, show the two lines delineating the upper facial height (UFaH), respectively in a normal fetus and a fetus with Down syndrome. Figures 1C and 1F, show the two lines delineating the lower facial height (LFaH), respectively in a normal fetus and a fetus with Down syndrome.
The images from DS pregnancies were stored to reveal nasal bone, prenasal thickness. Cases with unsatisfactory quality of images were excluded from the study.
Regression analysis was made for all parameters to determine the trends by GA. Through a regression analysis, UFaH, LFaH, FaH, FH were evaluated against GA to assess the linearity or nonlinearity of their relationship. The distributions of measurements of UFaH, LFaH, FaH, FH around the linear regression line were assessed using Kolmogorov- Smirnov normality test. GA-specific multiples of median (MoM) values were calculated using our own regression equation. Mann-Whitney U-test was used to test statistical significances among normal and DS fetuses. A p value < 0.05 was considered statistically significant. The statistical software SPSS 12.0 (Chicago, IL, USA) was used for data analysis.
There are total 26 DS pregnancies with satisfactory quality of images. The measurements obtained from these fetuses were compared with 150 normal fetuses with known postnatal outcome. In fetuses with DS, advanced maternal age (≥ 35 years) was present in 18 cases (60%) and 19 cases had increased risk for aneuploidy at screening tests. There were no abnormal ultrasound findings or markers in the unaffected fetuses. In the DS group, 8 fetuses had no anomalies or markers whereas 11 fetuses had several major structural abnormalities such as cardiac defects (n = 7), esophageal atresia (n = 1), non-immune hydrops fetalis (n = 1), cystic hygroma (n = 1), vermian agenesis (n = 1), and 7 fetuses had at least one of the following soft markers: intracardiac echogenic focus (n = 1), aberrant right subclavian artery (n = 2), pyelectasis (n = 1), nuchal edema (n = 3), hyperechogenic bowel (n = 1), nasal bone hypoplasia (n = 1).
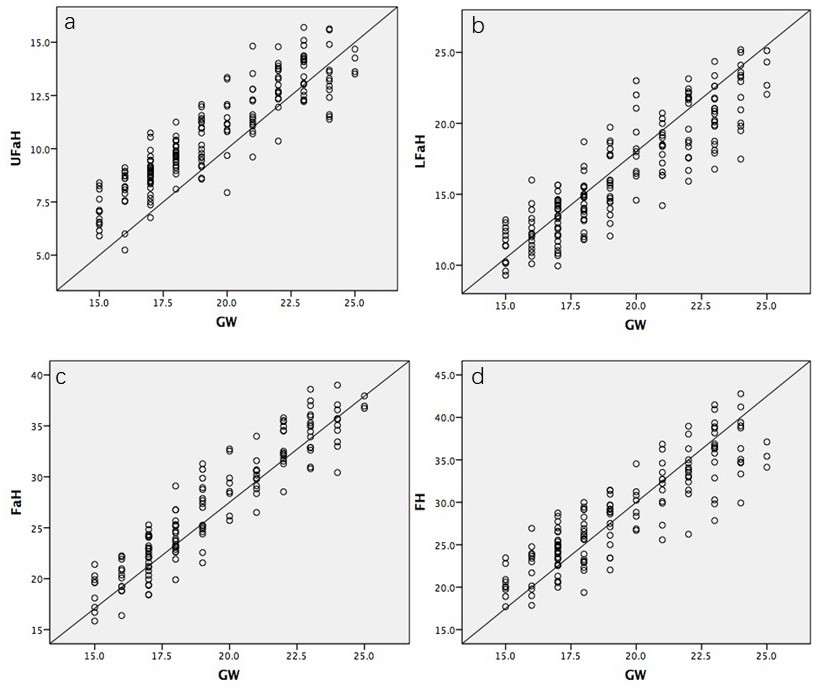 Figure 2.
— Relationship of (a) upper facial height (UFaH), (b) lower facial height (LFaH), (c) facial height (FaH) and (d) forehead height (FH) to gestational age in 150 normal fetuses between 15 and 25 weeks of gestation (GW: gestational age in weeks).
The patients were significantly older in the DS group compared with the group of normal fetuses (Table 1). In the group of normal fetuses, the median maternal age was 29 years (range, 18-41) and the median GA at examination was 19 (range, 15-25) weeks. In 26 fetuses with DS, median maternal age was 35.5 (range, 22-43) and the median GA at examination was 20 (range, 15-25) weeks.
| DS fetuses (n = 26) | Normal fetuses (n = 150) | p Value | |||
|---|---|---|---|---|---|
| Maternal age (years) | (MWU) | ||||
| Median (min-max) | 35.5 (22-43) | 29 (18-41) | 0.001 | ||
| GA (weeks) | |||||
| Median (min-max) | 20 (15-25) | 19 (15-25) | 0.8 | ||
| mm | MOM | mm | MOM | ||
| UFaH | |||||
| Median (min-max) Correlation with GA LFaH | 9.9 (5.9-13.5) | 0.91 (0.7-1.1) | 10.6 (5.2-15.7) | 1(0.6-1.3) | < 0.001 |
| Median (min-max) | 17.8 (10.1-25.1) | 1.05 (0.8-1.3) | 15.6 (9.3-25.2) | 1(0.7-1.3) | 0.09 |
| Correlation with GA | 0.870(P < 0.001) | 0.814(P < 0.001) | |||
| Median (min-max) | 28.7 (16-39) | 1.01 (0.8-1.1) | 25.9 (16-39) | 1(0.8-1.2) | 0.2 |
| Correlation with GA | 0.937(P < 0.001) | 0.934(P < 0.001) | |||
| Median (min-max) | 28.7(15.8-39.1) | 0.98 (0.7-1.1) | 28 (17.7-42.8) | 1(0.7-1.2) | 0.2 |
| Correlation with GA | 0.844(P < 0.001) | 0.870 (P < 0.001) |
All of the facial heights were found to be increased linearly with GA (p < 0.001). UFaH increased significantly with GA from 5.2 mm at 15 weeks to 15.7 mm at 25 weeks (Figure 2a). LFaH increased significantly with GA, from 9.3 mm at 15 weeks to 32 mm at 25.2 weeks (Figure 2b). FaH increased significantly with GA from 16 mm at 15 weeks to 39 mm at 25 weeks (Figure 2c). FH increased significantly with GA from 17.7 mm at 15 weeks to 42.8 mm at 25 weeks (Figure 2d). The related linear relationships with GA were confirmed on polynomial regression: for UFaH = (0.755 x GA in weeks) - 3.868 (r = 0.899, p < 0.001), for LFaH = (1.2 x GA in weeks) - 7.18 (r = 0.814, p < 0.001), for FaH = (1.9 x GA in weeks) - 11.1 (r = 0.934, p < 0.001) and lastly for FH = (1.8 x GA in weeks) - 7.1 (r = 0.87 , p < 0.001). Table 2 shows that quadratic regression curves fitted steady increase in all UFaH, LFaH, FaH and FH measurements in normal fetuses over gestational weeks.
| GA | n | UFaH | LFaH | FaH | FH | ||||
|---|---|---|---|---|---|---|---|---|---|
| Median | Regressed | Median | Regressed | Median | Regressed | Median | Regressed | ||
| 15 | 9 | 7.11 | 7.5 | 11.4 | 10.9 | 19.6 | 17.4 | 20.1 | 19.9 |
| 16 | 12 | 8.2 | 8.2 | 12.1 | 12.1 | 20.2 | 19.3 | 23.2 | 21.7 |
| 17 | 27 | 8.9 | 8.9 | 13.9 | 13.3 | 22.4 | 21.2 | 24.6 | 23.5 |
| 18 | 21 | 9.7 | 9.7 | 14.3 | 14.5 | 23.7 | 23.1 | 25.7 | 25.3 |
| 19 | 17 | 10.9 | 10.5 | 15.8 | 15.7 | 27 | 25 | 28.8 | 27.1 |
| 20 | 8 | 11.3 | 11.2 | 17.1 | 16.8 | 28.9 | 26.9 | 29.5 | 28.9 |
| 21 | 12 | 11.6 | 11.9 | 18.1 | 18 | 30 | 28.8 | 32.5 | 30.7 |
| 22 | 14 | 13.3 | 12.7 | 20.5 | 19.2 | 32.4 | 30.7 | 33.7 | 32.5 |
| 23 | 16 | 14.1 | 13.5 | 20.8 | 20.4 | 34.7 | 32.6 | 36.5 | 34.3 |
| 24 | 11 | 13.2 | 14.3 | 21.8 | 21.6 | 35.7 | 34.5 | 36.3 | 36.1 |
| 25 | 3 | 14.3 | 15 | 22.7 | 22.8 | 36.9 | 36.4 | 35.4 | 37.9 |
To calculate MoM values, the regression equation was used. The median UFaH in normal fetuses was found to be 1.00 MoM and in DS fetuses, the median UFaH was 0.91 MoM. The UFaH was significantly smaller in DS fetuses than in normal fetuses (median, 0.91 MoM (min-max, 0.7- 1.1) vs median, 1.00 MoM (min-max, 0.6 - 1.3); p < 0.001). Table 3 shows the all four MoM values for each of the 26 fetuses with DS.
| GA | UFaH | LFaH | FaH | FH |
|---|---|---|---|---|
| 15.00 | 0.96 | 1.04 | 0.98 | 1.03 |
| 15.00 | 0.88 | 1.07 | 0.96 | 1.01 |
| 15.00 | 0.83 | 0.87 | 0.83 | 0.78 |
| 15.00 | 0.80 | 0.88 | 0.82 | 0.89 |
| 16.00 | 1.09 | 0.94 | 1.00 | 1.04 |
| 16.00 | 1.05 | 1.15 | 1.11 | 0.99 |
| 16.00 | 0.73 | 1.33 | 1.09 | 0.85 |
| 17.00 | 0.84 | 0.90 | 0.89 | 0.99 |
| 18.00 | 0.93 | 1.06 | 1.02 | 0.89 |
| 19.00 | 0.93 | 1.12 | 1.03 | 1.14 |
| 19.00 | 0.84 | 0.93 | 0.89 | 1.07 |
| 19.00 | 0.84 | 0.76 | 0.79 | 1.01 |
| 20.00 | 1.06 | 1.05 | 1.04 | 1.02 |
| 20.00 | 0.95 | 1.34 | 1.17 | 1.06 |
| 20.00 | 0.70 | 1.28 | 1.03 | 0.93 |
| 21.00 | 0.99 | 1.04 | 1.00 | 0.79 |
| 21.00 | 0.95 | 1.16 | 1.06 | 1.07 |
| 21.00 | 0.83 | 1.04 | 0.94 | 0.71 |
| 22.00 | 0.95 | 0.81 | 0.91 | 0.96 |
| 22.00 | 0.95 | 1.13 | 1.10 | 0.86 |
| 23.00 | 0.89 | 0.86 | 0.88 | 0.78 |
| 23.00 | 0.87 | 0.96 | 0.94 | 1.07 |
| 23.00 | 0.87 | 1.08 | 1.01 | 1.03 |
| 24.00 | 1.01 | 1.08 | 1.04 | 0.94 |
| 24.00 | 0.87 | 1.15 | 1.02 | 0.95 |
| 25.00 | 0.97 | 1.07 | 1.03 | 0.98 |
The other heights were not found to be statistically significant among DS and normal fetuses (p > 0.05).
No correlation could be demonstrated between GA and the ratios of BPD and FL to all of the height measurements (Figure 3 and 4). However, statistically all ratios were found to be significantly higher in DS than in normal fetuses (p < 0.05, Table 4).
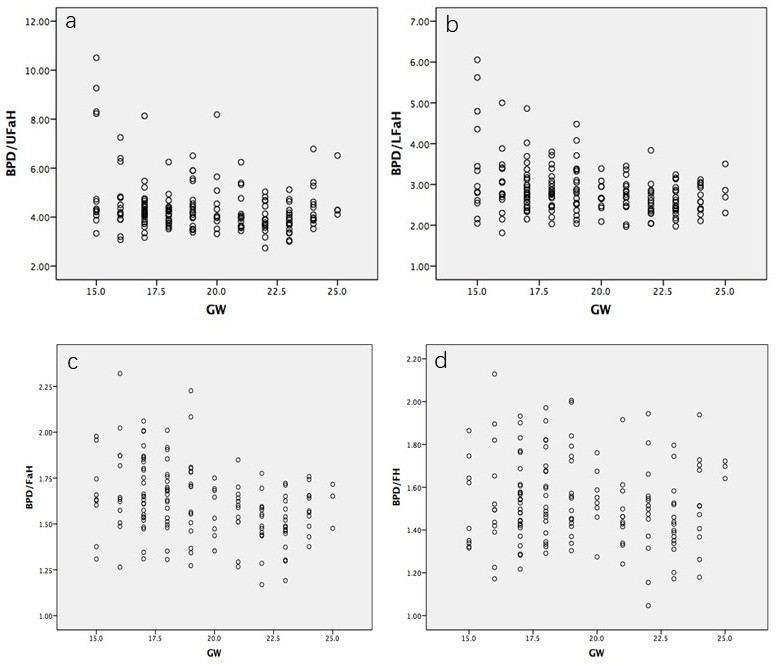 Figure 3.
— Relationship of (a) biparietal diameter to upper facial height ratio (BPD/UFaH), (b) biparietal diameter to lower facial height ratio (BPD/LFaH), (c) biparietal diameter to facial height ratio (BPD/FaH) and (d) biparietal diameter to forehead height ratio (BPD/FH) to gestational age in 150 normal fetuses between 15 and 25 weeks of gestation (GW: gestational age in weeks).
To the best of our knowledge, this is the first prenatal study conducted on FaHs in DS fetuses, reported to date. The finding of our study indicates that the UFaH is smaller in the midtrimester fetuses with DS in comparison to normal fetuses. This novel measurement may be another indicator of the midfacial hypoplasia of fetuses with DS. However, no significant difference was found in other facial height mesurements between fetuses with DS and normal fetuses. Additionally, we report the ratios of biometric measurements (BPD and FL) to all heights were found to be significantly higher in fetuses with DS than in normal fetuses.
Our result is consistent with those of previous postnatal studies investigating anthropometric measurements of the craniofacial regions in individuals with DS. An anthropometric study conducted on individuals with DS reported that the greatest absolute reductions were observed in the face region in comparison to other anatomic areas- with one of the most frequent subnormality being in the upper facial height [14]. Another postnatal study among 127 individuals with DS performed by the same researchers [15], found that 63.1% of the facial measurements taken in six craniofacial regions were within normal limits, whereas 36.9% were found to be abnormal; 90.8% of those abnormal values were below normal and 9.2% were supernormal. In their study, the facial height and upper facial height were found to be abnormally short in 44.1% and 41.9% of the cases, respectively. Another postnatal study evaluating craniofacial pattern profiles in DS documented that underdevelopment of maxilla in comparison to mandibular growth becomes evident with aging [16]. Orthodontists have also demonstrated that individuals with DS had significantly higher lower facial height compared to normal individuals [11]. In our study, we could not demonstrate any significant difference neither in total facial height nor in FH nor in LFaH.
In the prenatal study performed by Den Boogert et al. [17], facial heights were evaluated in a limited number of DS cases, using three-dimensional ultrasound, in the second and third trimesters of pregnancy. They have measured total facial height from nasion to gnathion, without any separation into upper and lower parts. They observed that facial height was within normal limits in 81% of the cases, whereas in 18.1%, the facial height was found to be above the 95th percentile.
Roelfsema et al. [18] analyzed craniofacial variability index by using three-dimensional ultrasound in 126 normal and six different syndromic fetuses. Only one of these syndromic fetuses was affected with DS and showed significantly smaller skull height (vertex to nasion) without any significant difference in upper and lower facial heights. Although it is not appropriate to compare these limited number of prenatal studies because of their methodological discrepancies, it is seen that facial height measurements differ from one study to another.
Our study has many differences from previous studies in terms of methodology, study population and statistical analysis. First, the landmarks that we used to measure the FaHs were considerably different from those used in anthropometric (soft tissue landmarks) and cephalometric (radiologic or bony landmarks) studies. For measurement of UFaH, we used the line along the superior edge of the primary palate (maxilla) rather than the stomion or subnasion. For the measurement of LFaH, we selected the line that was drawn tangentially to the inferior border of fetal jaw skin, taking mainly the menton as a reference point, rather than the gnathion. Second, postnatal studies evaluating the anthropometric and cephalometric measurements have been obtained from a standard position using Frankfort horizontal plane [19]. As den Boogert et al. [17] have reported, since this plane is not practical to attain during antenatal period, we measured all heights in the midsagittal plane which is widely used in the routine evaluation of fetal facial profile. Additionally, our study was a sonography-based one rather than radiologic or anthropometric. Lastly, for statistical analysis we used MoMs for all heights after adjustment for GA, rather than Z-scores because of frequency distributions of results and normalization by log transformation.
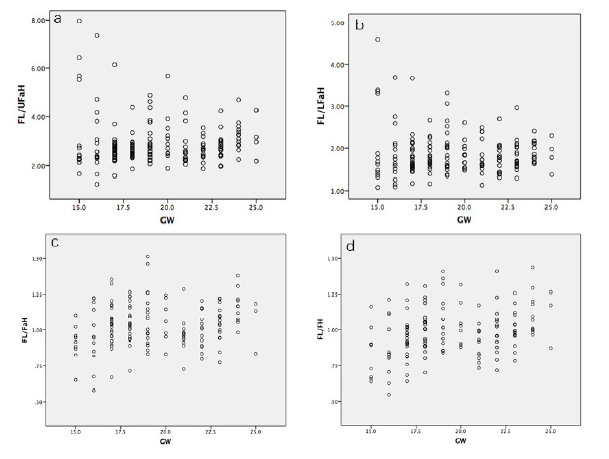 Figure 4.
— Relationship of (a) femur length to upper facial height ratio (FL/UFaH), (b) femur length to lower facial height ratio (FL/LFaH), femur length to facial height ratio (FL/FaH) and (d) femur length to forehead height ratio (FL/FH) to gestational age in 150 normal fetuses between 15 and 25 weeks of gestation (GW: gestational age in weeks).
| Ratios | Karyotype | n | Mean | Std. Deviation | P (MWU) |
|---|---|---|---|---|---|
| BPD/UFaH | Down syndrome | 26 | 6.3576 | 1.5395 | |
| Normal fetuses | 150 | 4.0762 | 0.55805 | < 0.001 | |
| BPD/ LFaH | Down syndrome | 26 | 3.6757 | 1.00191 | |
| Normal fetuses | 150 | 2.7068 | 0.4072 | < 0.001 | |
| BPD/FaH | Down syndrome | 26 | 2.313 | 0.58131 | |
| Normal fetuses | 150 | 1.6187 | 0.2012 | < 0.001 | |
| BPD/FH | Down syndrome | 26 | 2.2457 | 0.513 | |
| Normal fetuses | 150 | 1.5319 | 0.20361 | < 0.001 | |
| FL/UFaH | Down syndrome | 26 | 4.7132 | 1.22548 | |
| Normal fetuses | 150 | 2.6065 | 0.42603 | < 0.001 | |
| FL/LFaH | Down syndrome | 26 | 2.7034 | 0.69898 | |
| Normal fetuses | 150 | 1.7278 | 0.29053 | < 0.001 | |
| FL/FaH | Down syndrome | 26 | 1.7046 | 0.41254 | |
| Normal fetuses | 150 | 1.0341 | 0.15502 | < 0.001 | |
| FL/FH | Down syndrome | 26 | 1.6572 | 0.36406 | |
| Normal fetuses | 150 | 0.981 | 0.16933 | < 0.001 |
There are some limitations of our study, also. The first one is the examiner was not blinded to the fetal karyotype. This may have constituted bias in our study. Second, knowing the average value for UFaH is higher in normal fetuses than in fetuses with DS does not convey discriminatory potential or predictive value. However, our study did not have such a purpose. Also, the predictive performances of FaHs in second-trimester screening for DS could not be obtained from our study, because FaHs were measured from two selected groups of patients and we do not screen a population in a setting of detailed second-trimester sonography. Our study does not address the potential role of facial height measurements in DS screening. Therefore, larger prospective studies would be warranted to evaluate the potential value of measuring UFaH in DS screening and to establish the sensitivity and specificity of these measurements. However, considering the limited number of DS fetuses in previous prenatal studies, our study represents the largest prenatal population with DS assessed for FH and FaHs.
In conclusion, the current study has demonstrated that fetuses with DS had significantly lower UFaH compared to normal cases in the midtrimester of pregnancy. Additionally, the ratios of BPD to FH and FaHs, FL to FH and FaHs were significantly higher in fetuses with DS in comparison to normal fetuses. Although, these measurements may offer a promising marker for DS screening in the future, our findings should be confirmed in larger prospective studies and in order to be used as a marker, the likelihood ratio and utility as an independent finding are needed.
This research was based on the principles of the Declaration of Helsinki. All patients provided informed consent to participate in the study, it was ensured that there was no harm or loss to the patients.
The authors have no conflicts of interest to disclose.